
As the number of user sites or locations increases, having good visibility into the overall quality of connectivity of those sites to your Horizon View data center(s) becomes increasingly important. Having worked with many customers on troubleshooting connectivity between such locations, it has become clear that monitoring only at the physical network layer is not sufficient to properly diagnose user connectivity issues impacting the display protocol. In fact, in most cases, it’s the configuration of the physical layer that causes the issue(s), and the device(s) in question do not have the ability to diagnose or detect their impact to the display protocol.
Alas, all hope is not lost! With vROPs for Horizon, we have the ability to monitor the key metrics related to protocol performance and can alert when those metrics have reached critical thresholds. We can also leverage a handy custom grouping feature to organize the remotely connected sessions into defined sites or locations, based on information available in the user’s session data. We can then leverage Super Metrics to calculate the overall health of the group of connected sessions from that site, and then display and alert when the health has dropped below our SLA thresholds.
Sound like something you want to take on? Then read on!
First things first… 1️⃣

We need a strategy to capture and organize how we determine which connections are from which site. The most common approach is to leverage the known internal subnet IP range for that site, and set that as the primary filter for the custom group. However, additional metrics supplied by the user’s session data can be leveraged as well.
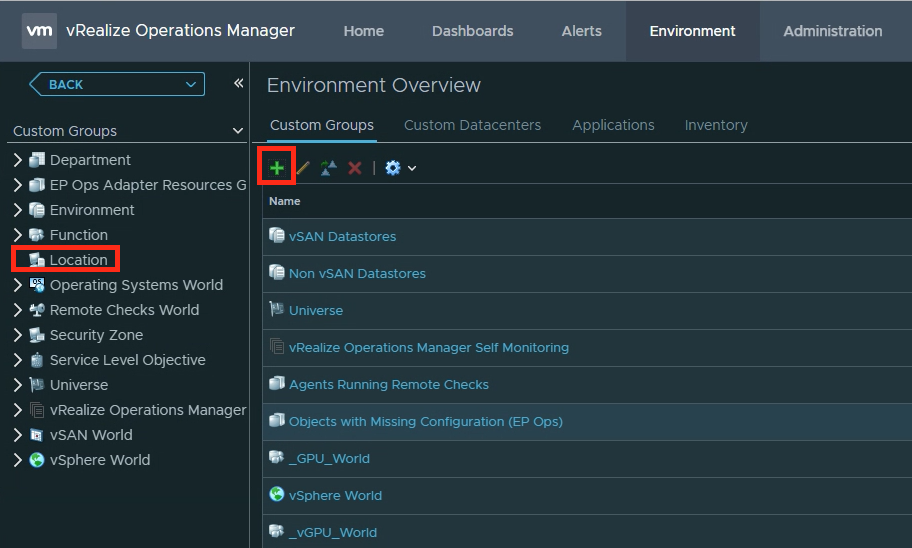
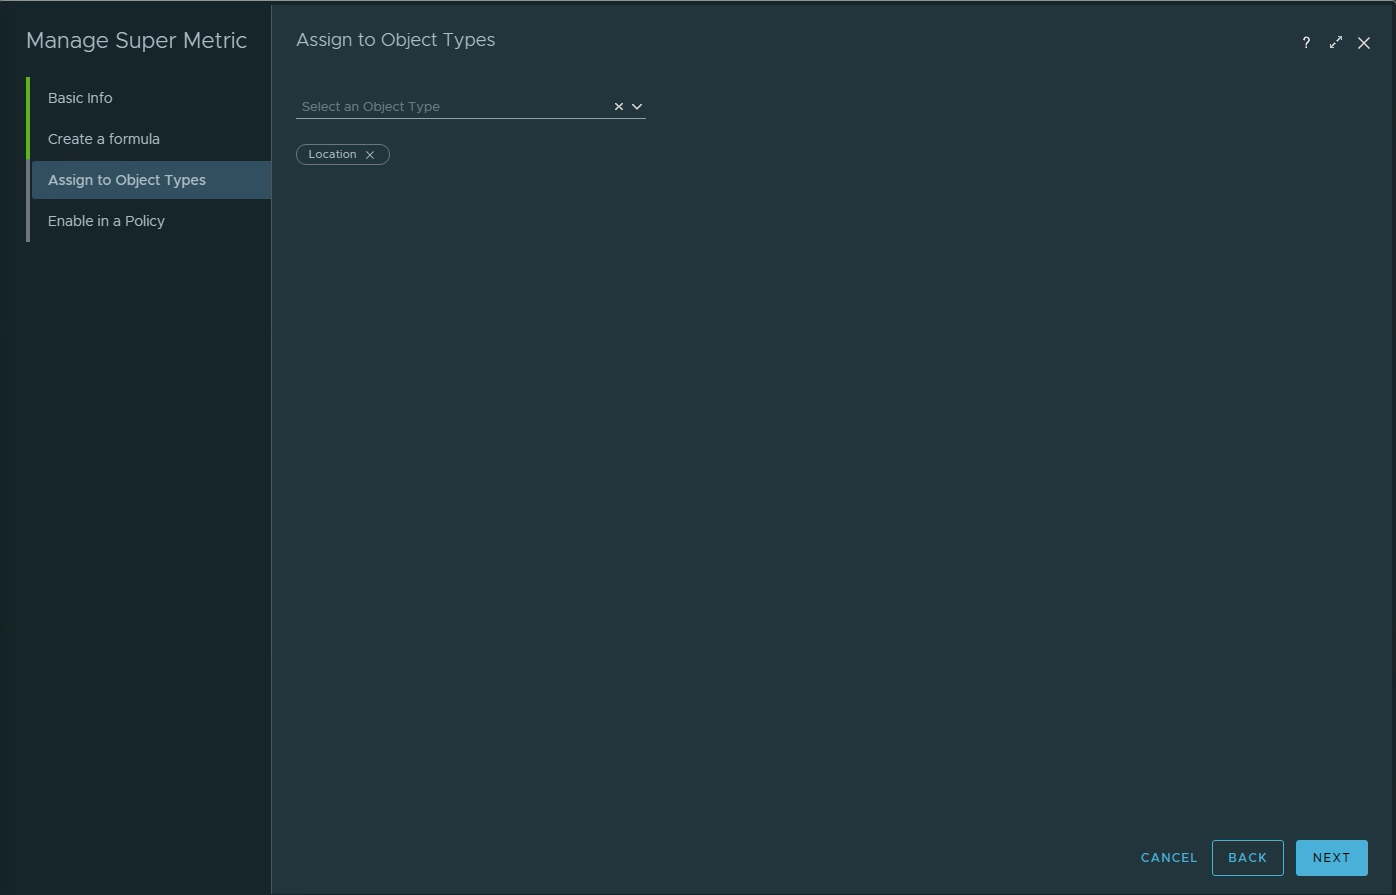
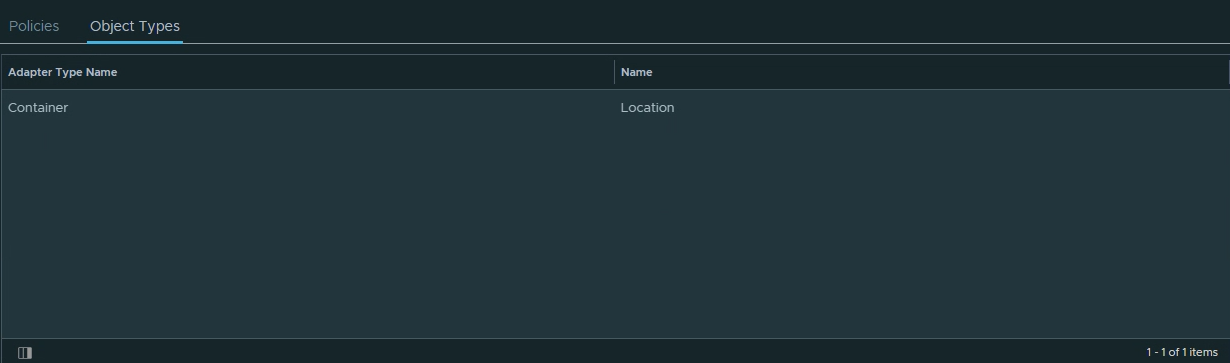
In this example, I will create a new Site labeled “External Users”, under the “Location” group, and filter on all users who have an internal subnet IP containing “192.”.
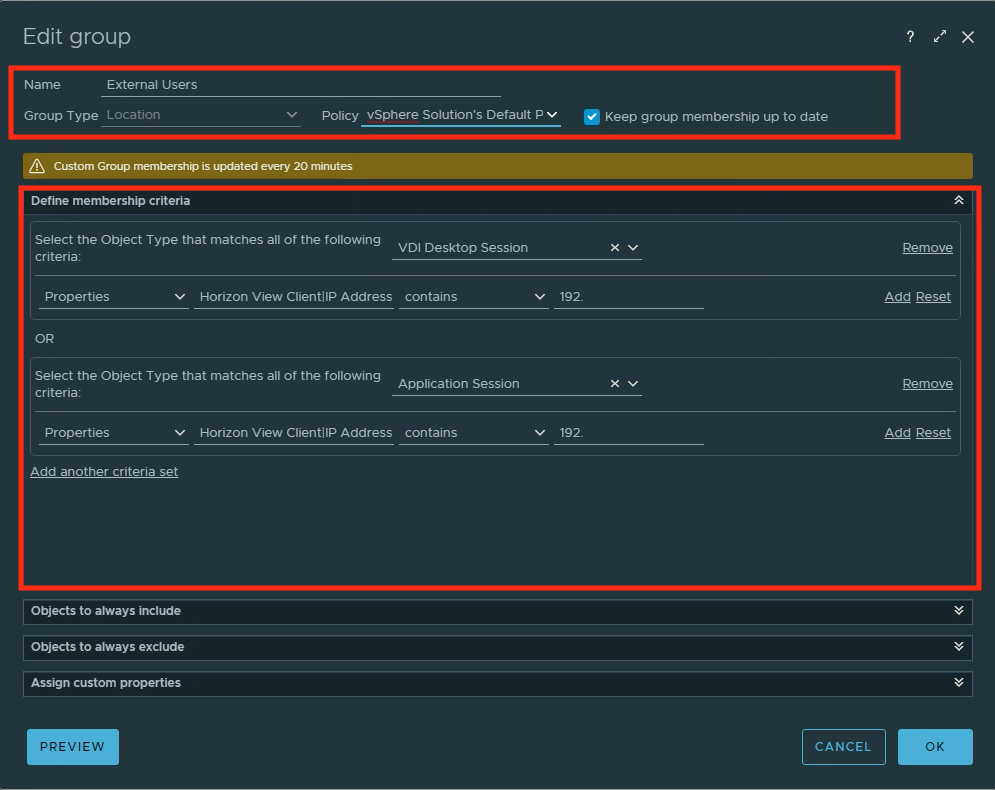
Note: It may take some time before the group starts to populate the sessions, and as noted in the image above, population updates are every 20 minutes.
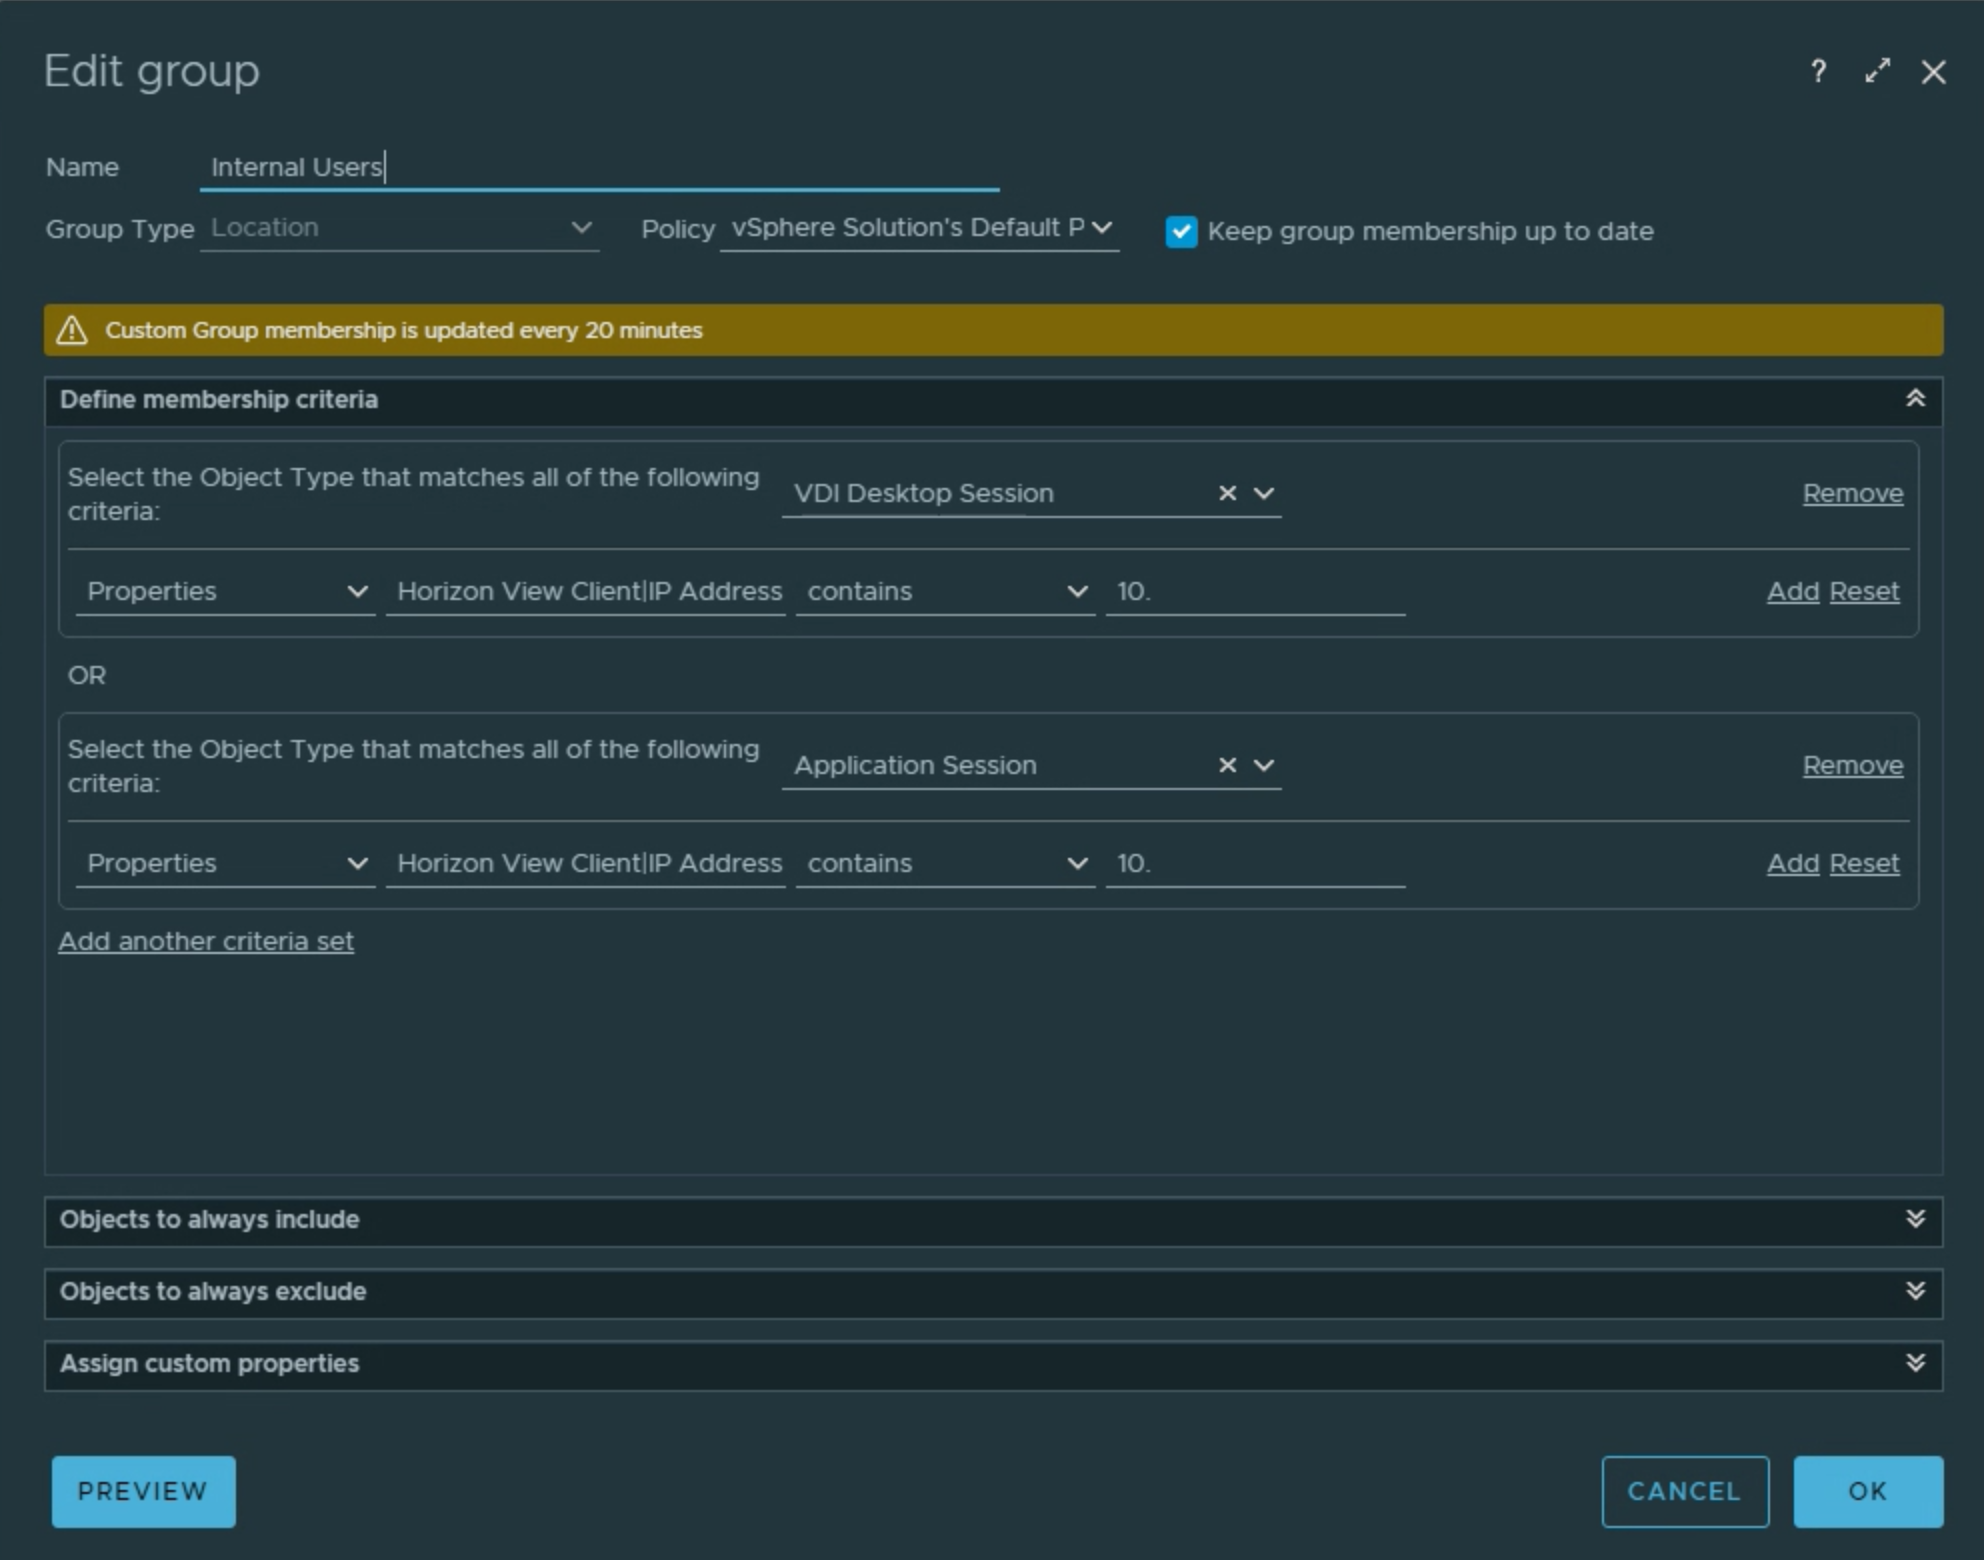
You will also want to create at least one more additional site for comparison purposes. In the example below, I have created an “Internal Users” site that filters on 10.x networks to separate the session traffic.
Second is just after first… as long as we’re counting up! 👆

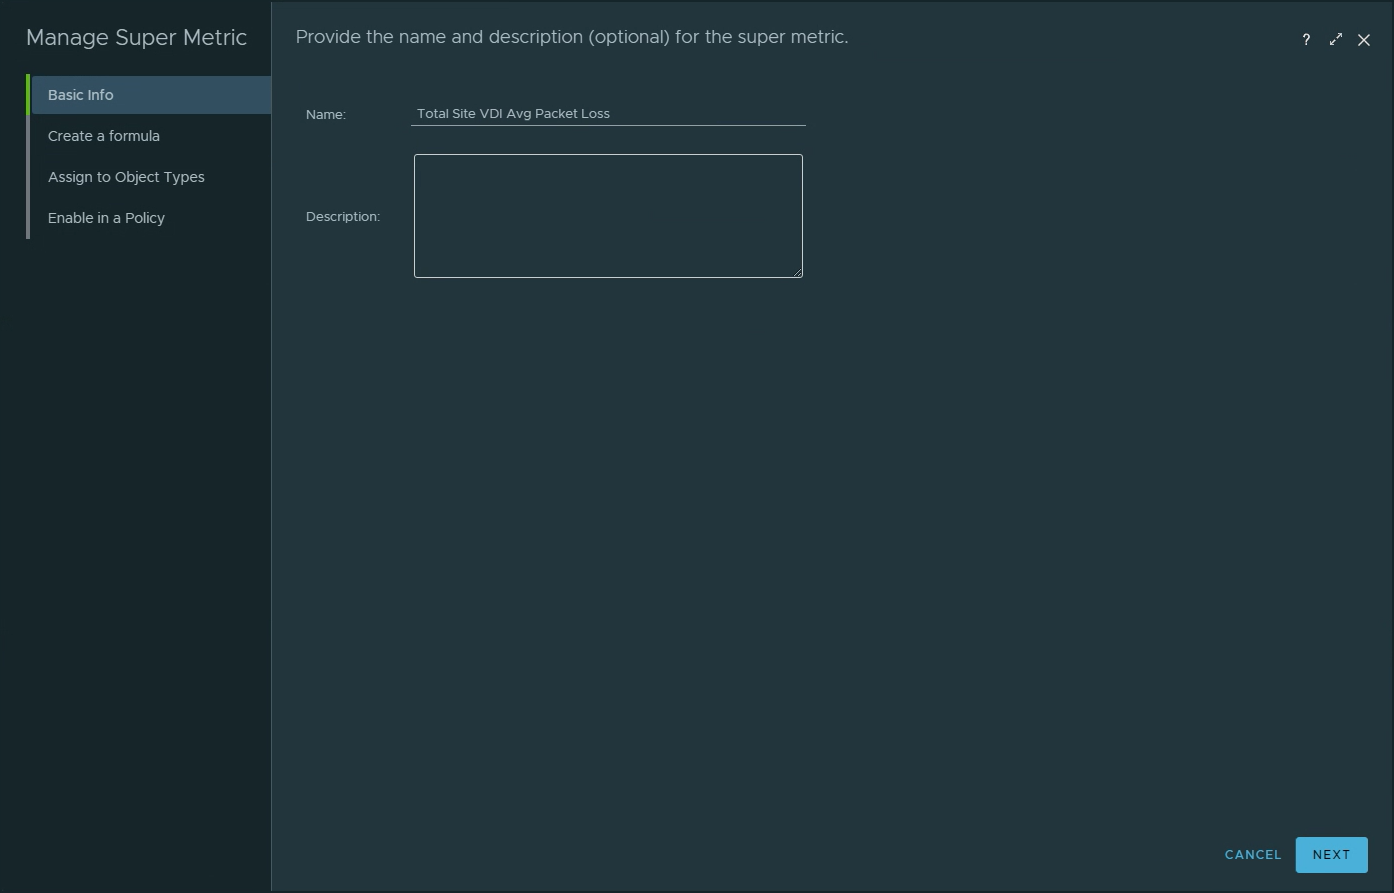
Once your group has started to populate with sessions, it’s time to create meaningful Super Metrics on the group that will give us insight into how well that site is connected.
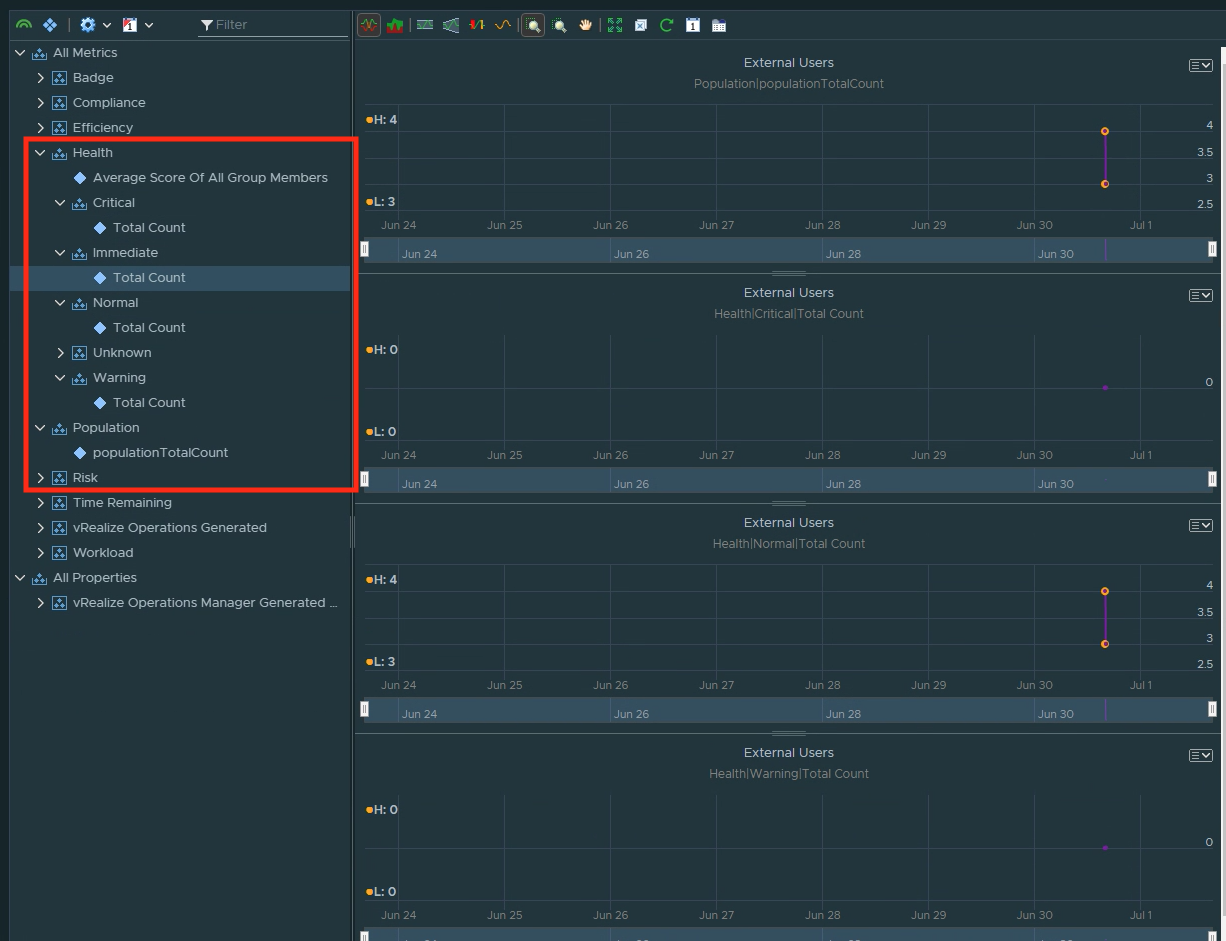
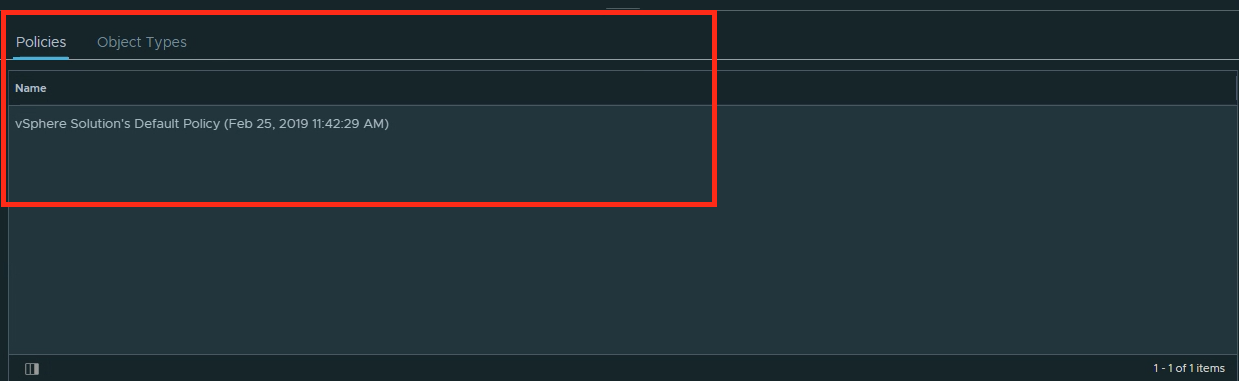
By default, vROPs 7.5+ will create population TotalCount and Health Criticality Total Count metrics. These will be useful in leveraging out-of-box KPI based alerts that track how well users are connected to the Horizon Environment and let us know the distribution of good to bad connected sessions from that site.
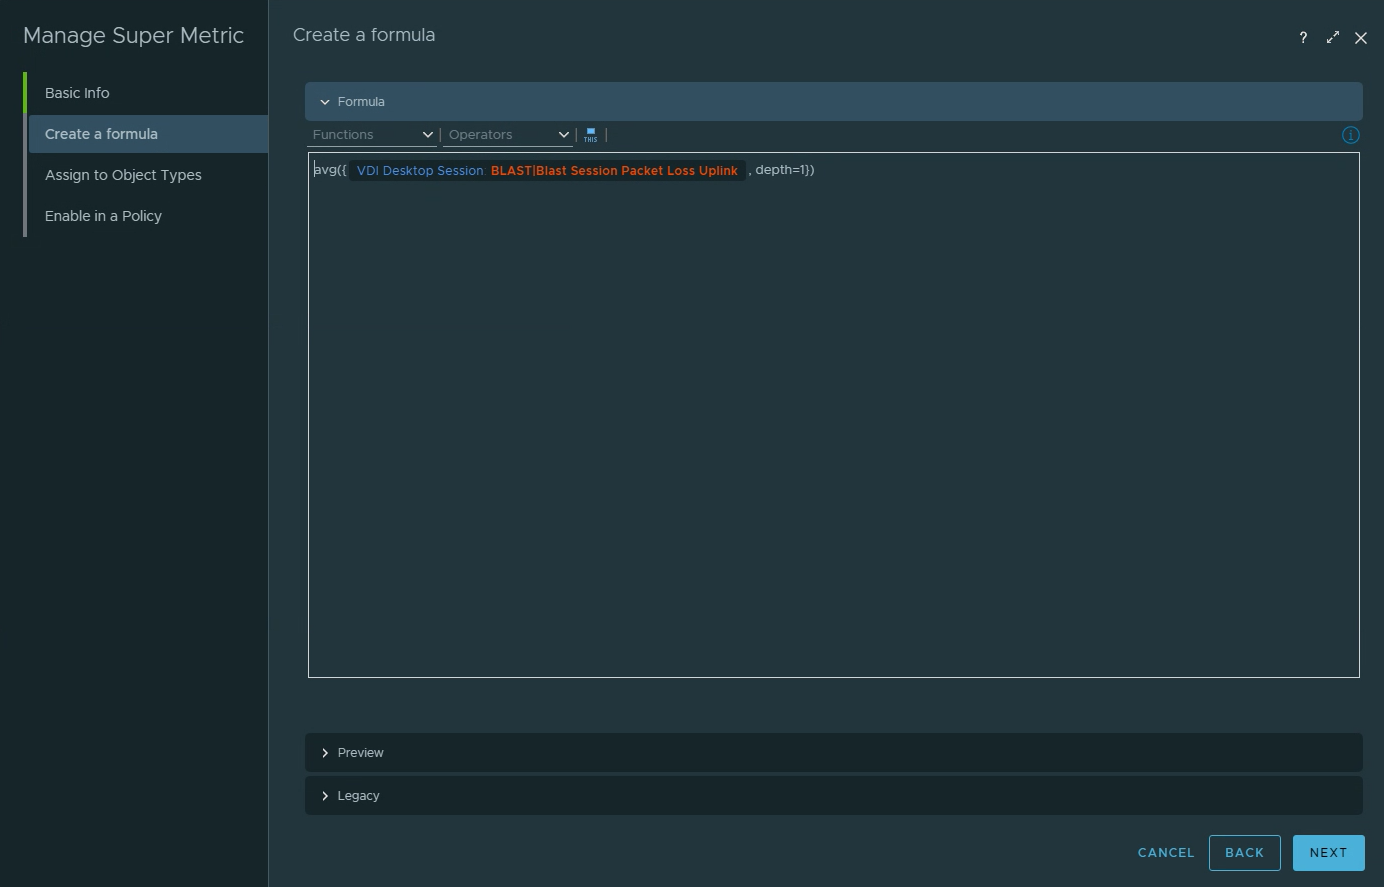
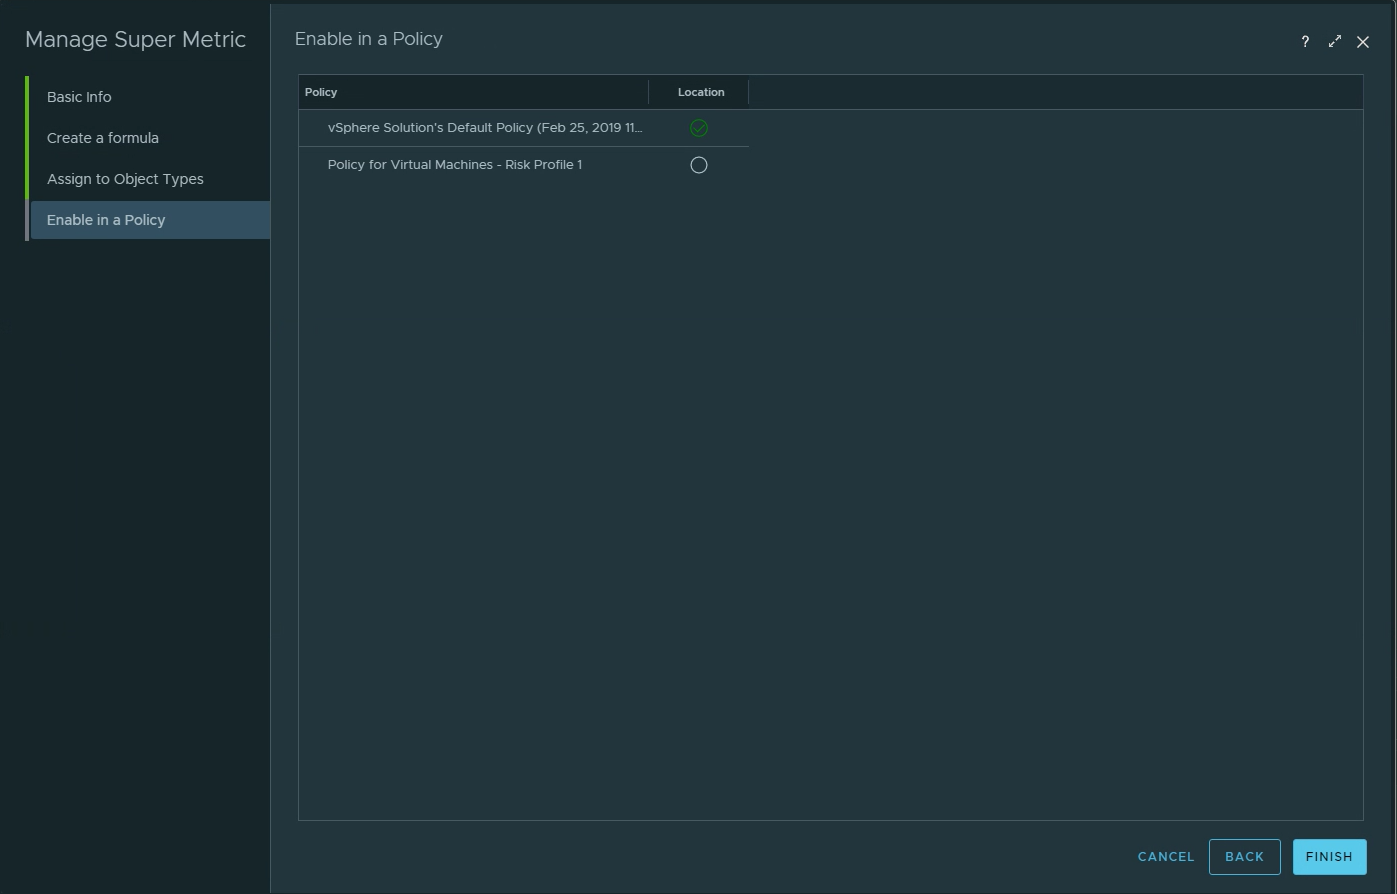
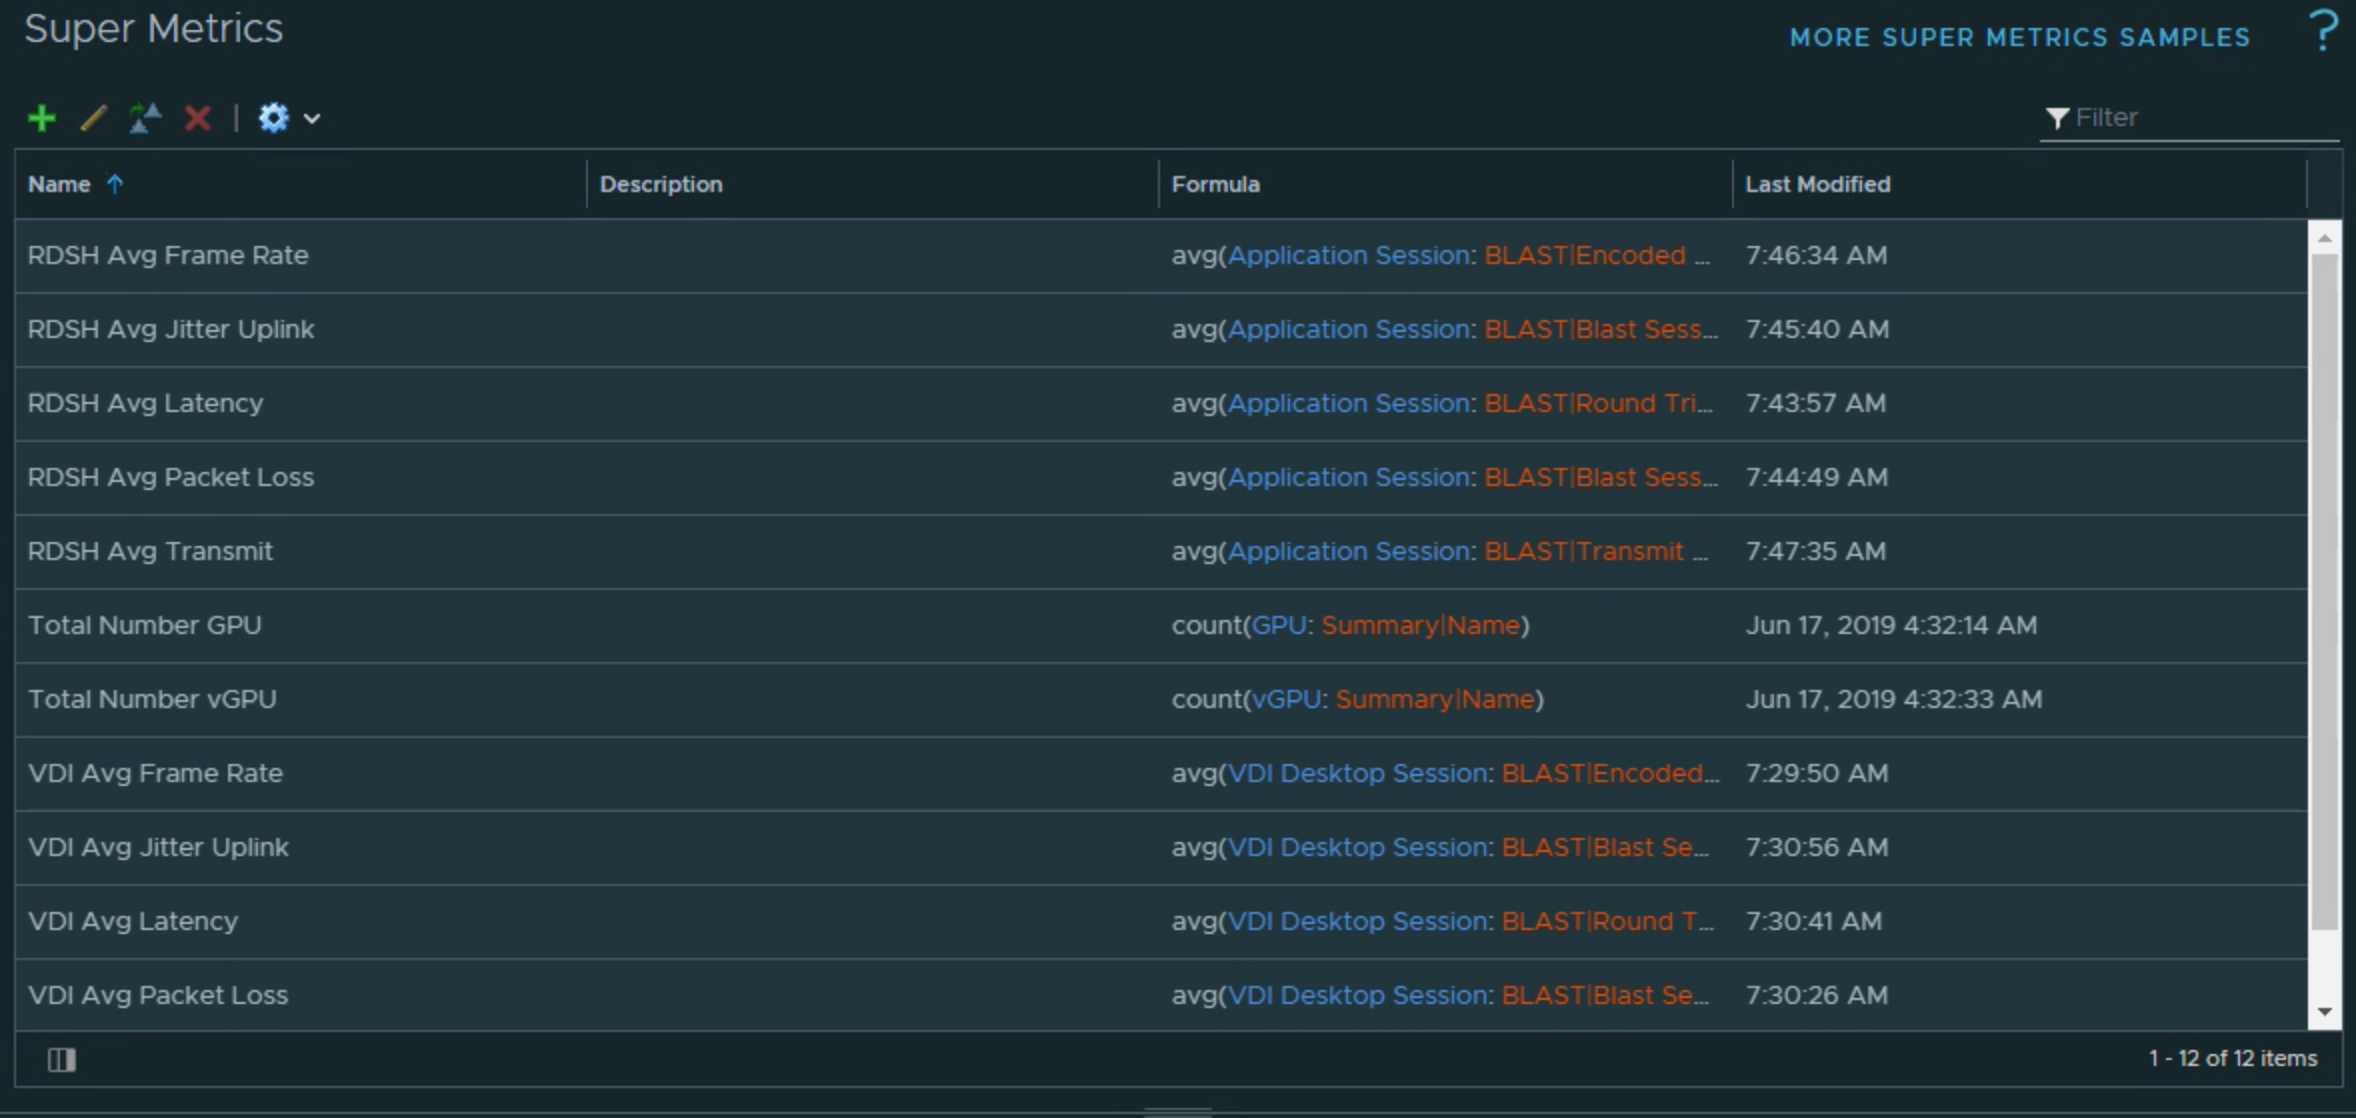
Leveraging Super Metrics, it’s time to create additional site tracking metrics that include, but are not limited to, average site Latency, Packet Loss, Jitter, Frame Rate, and Transmitted Bytes.
Thirdly Rinse and Repeat… ♻️

Continue to create the Super Metrics for the additional session metrics that you want to collect. As in our example below, you will need to do this for both the VDI and Application Sessions individually to capture the metrics from both types of sessions.
Now… what to do with all this stuff? 🤔

Now that we have meaningful Super Metrics on our custom group, it’s time to display that data in a way that it makes it easier to diagnose specific site connectivity issues, and compare that site against other sites that are connecting to our Horizon environment.
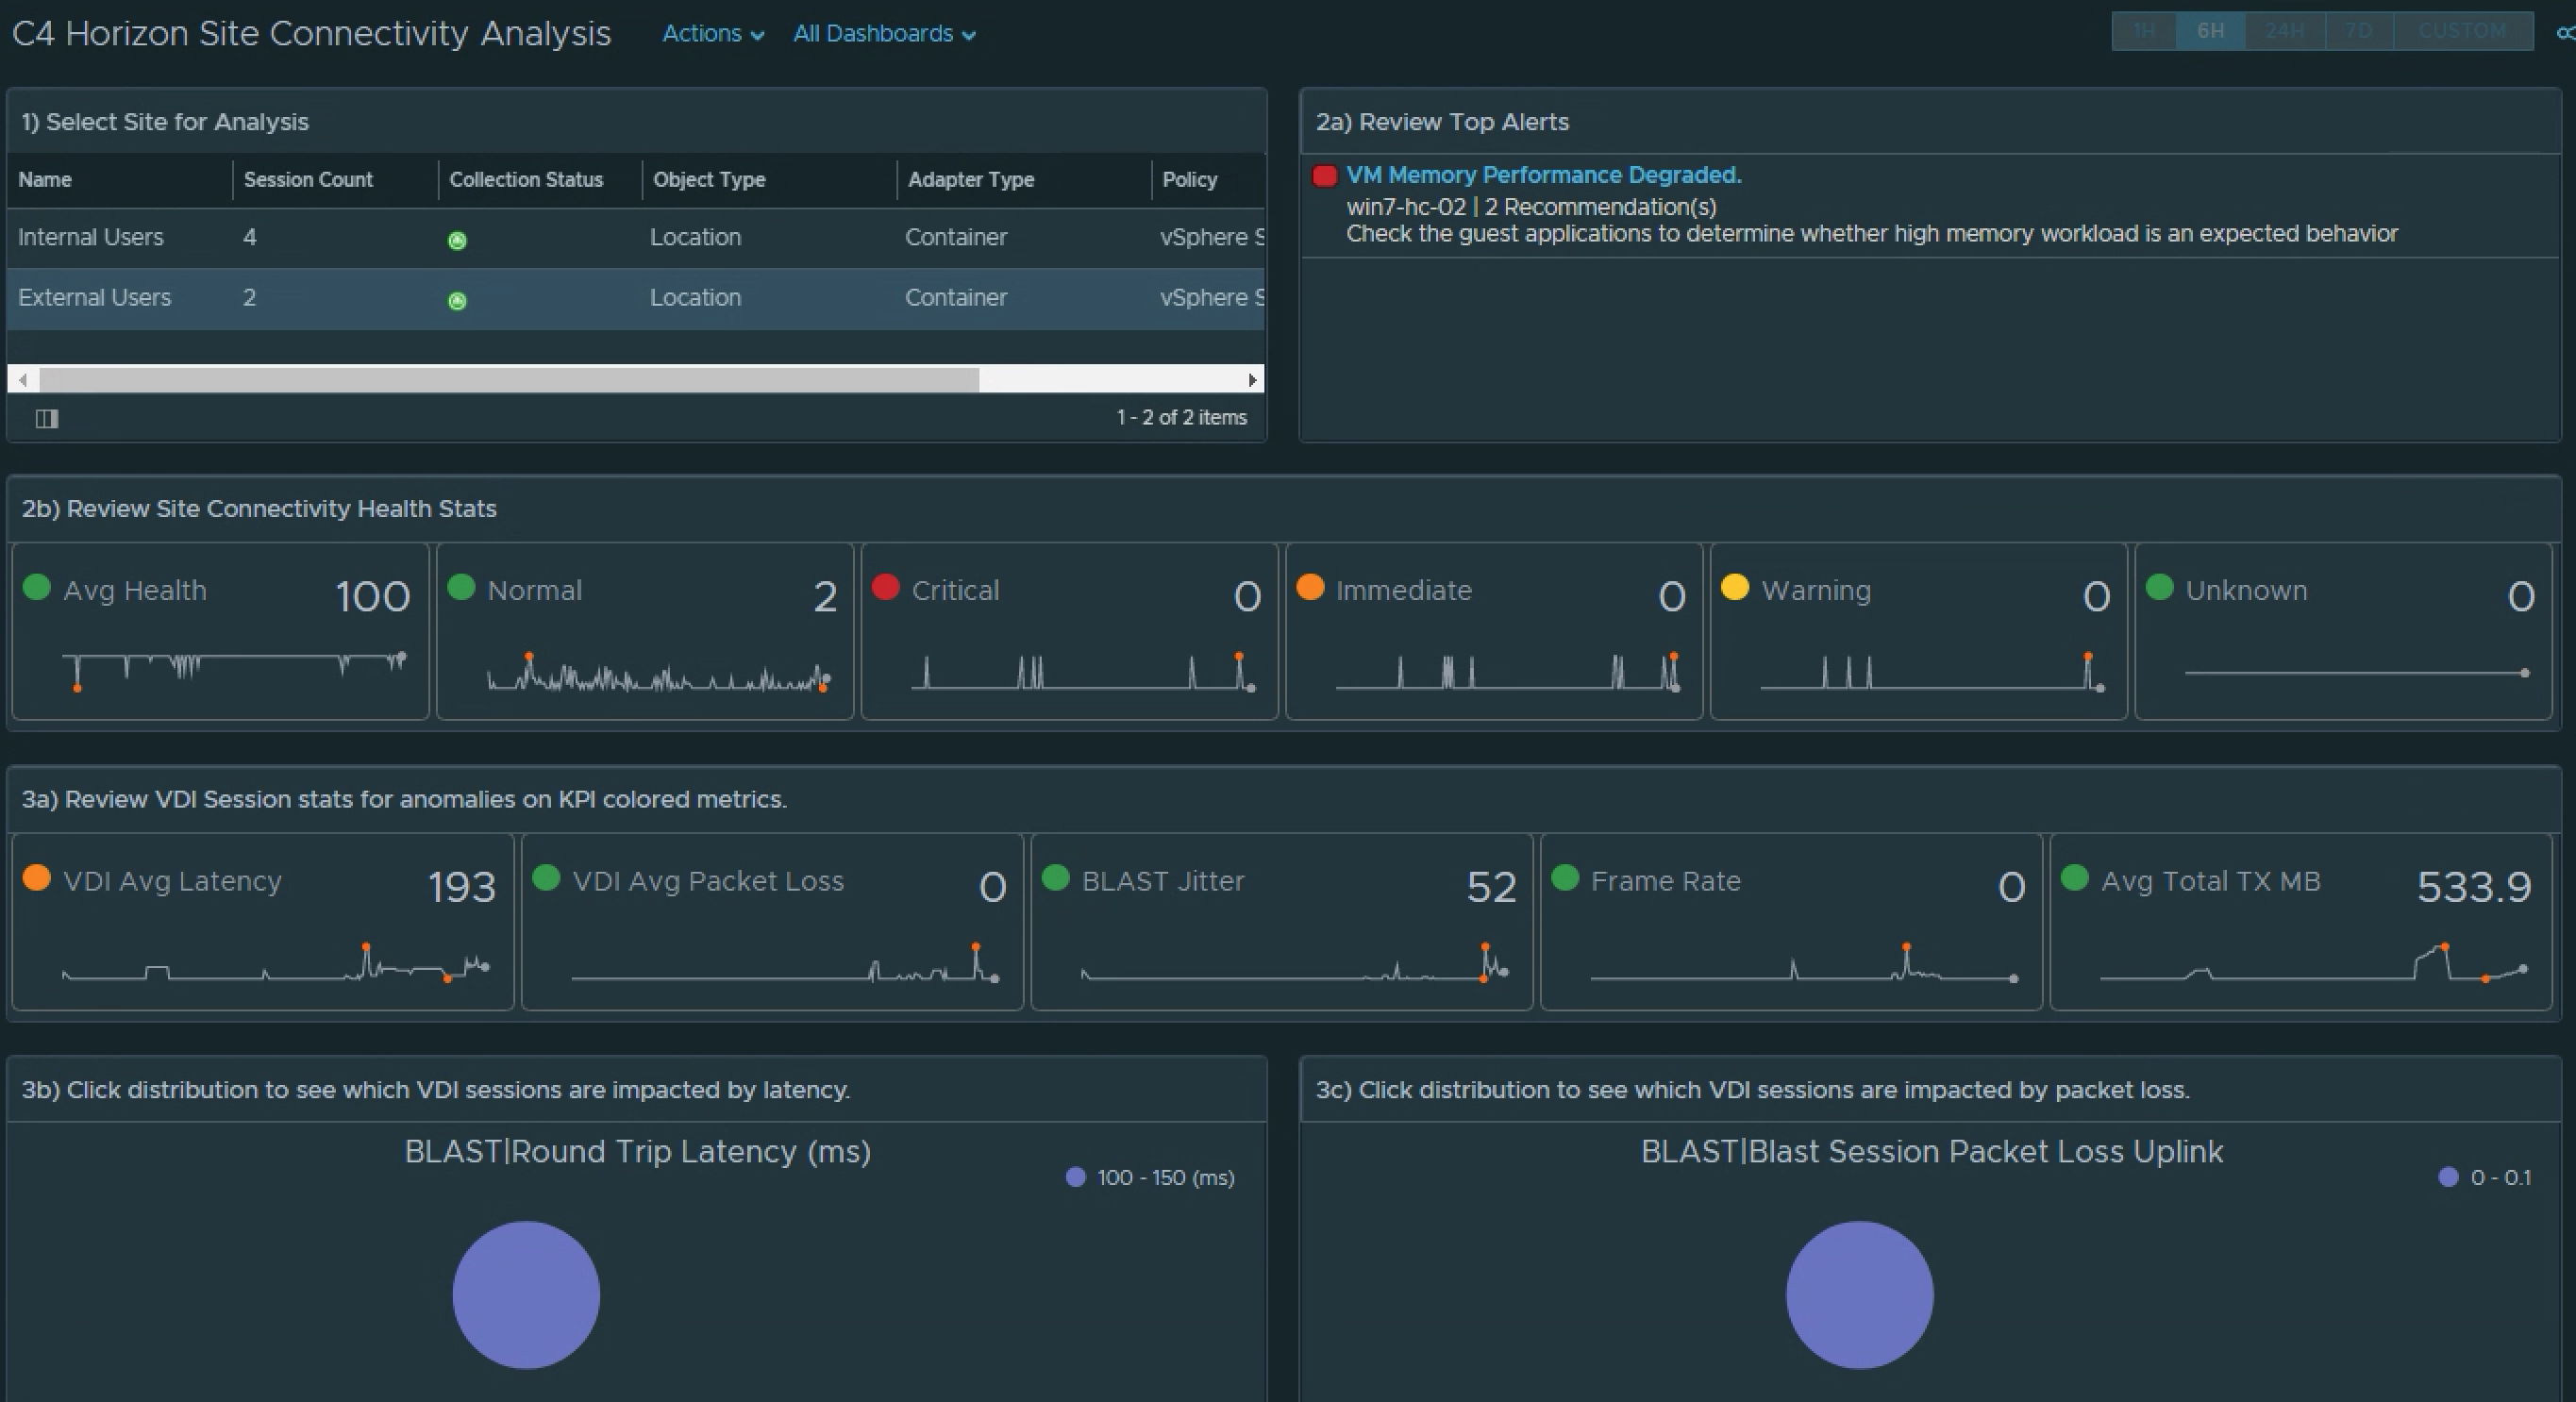
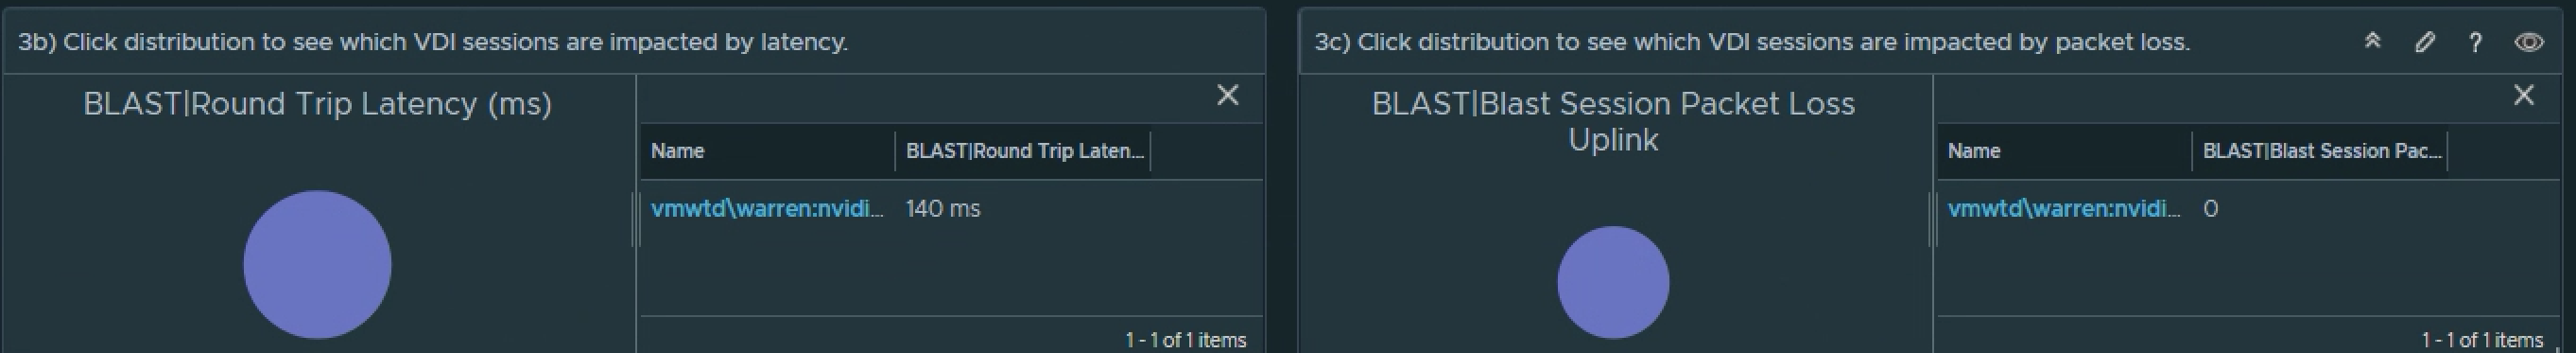
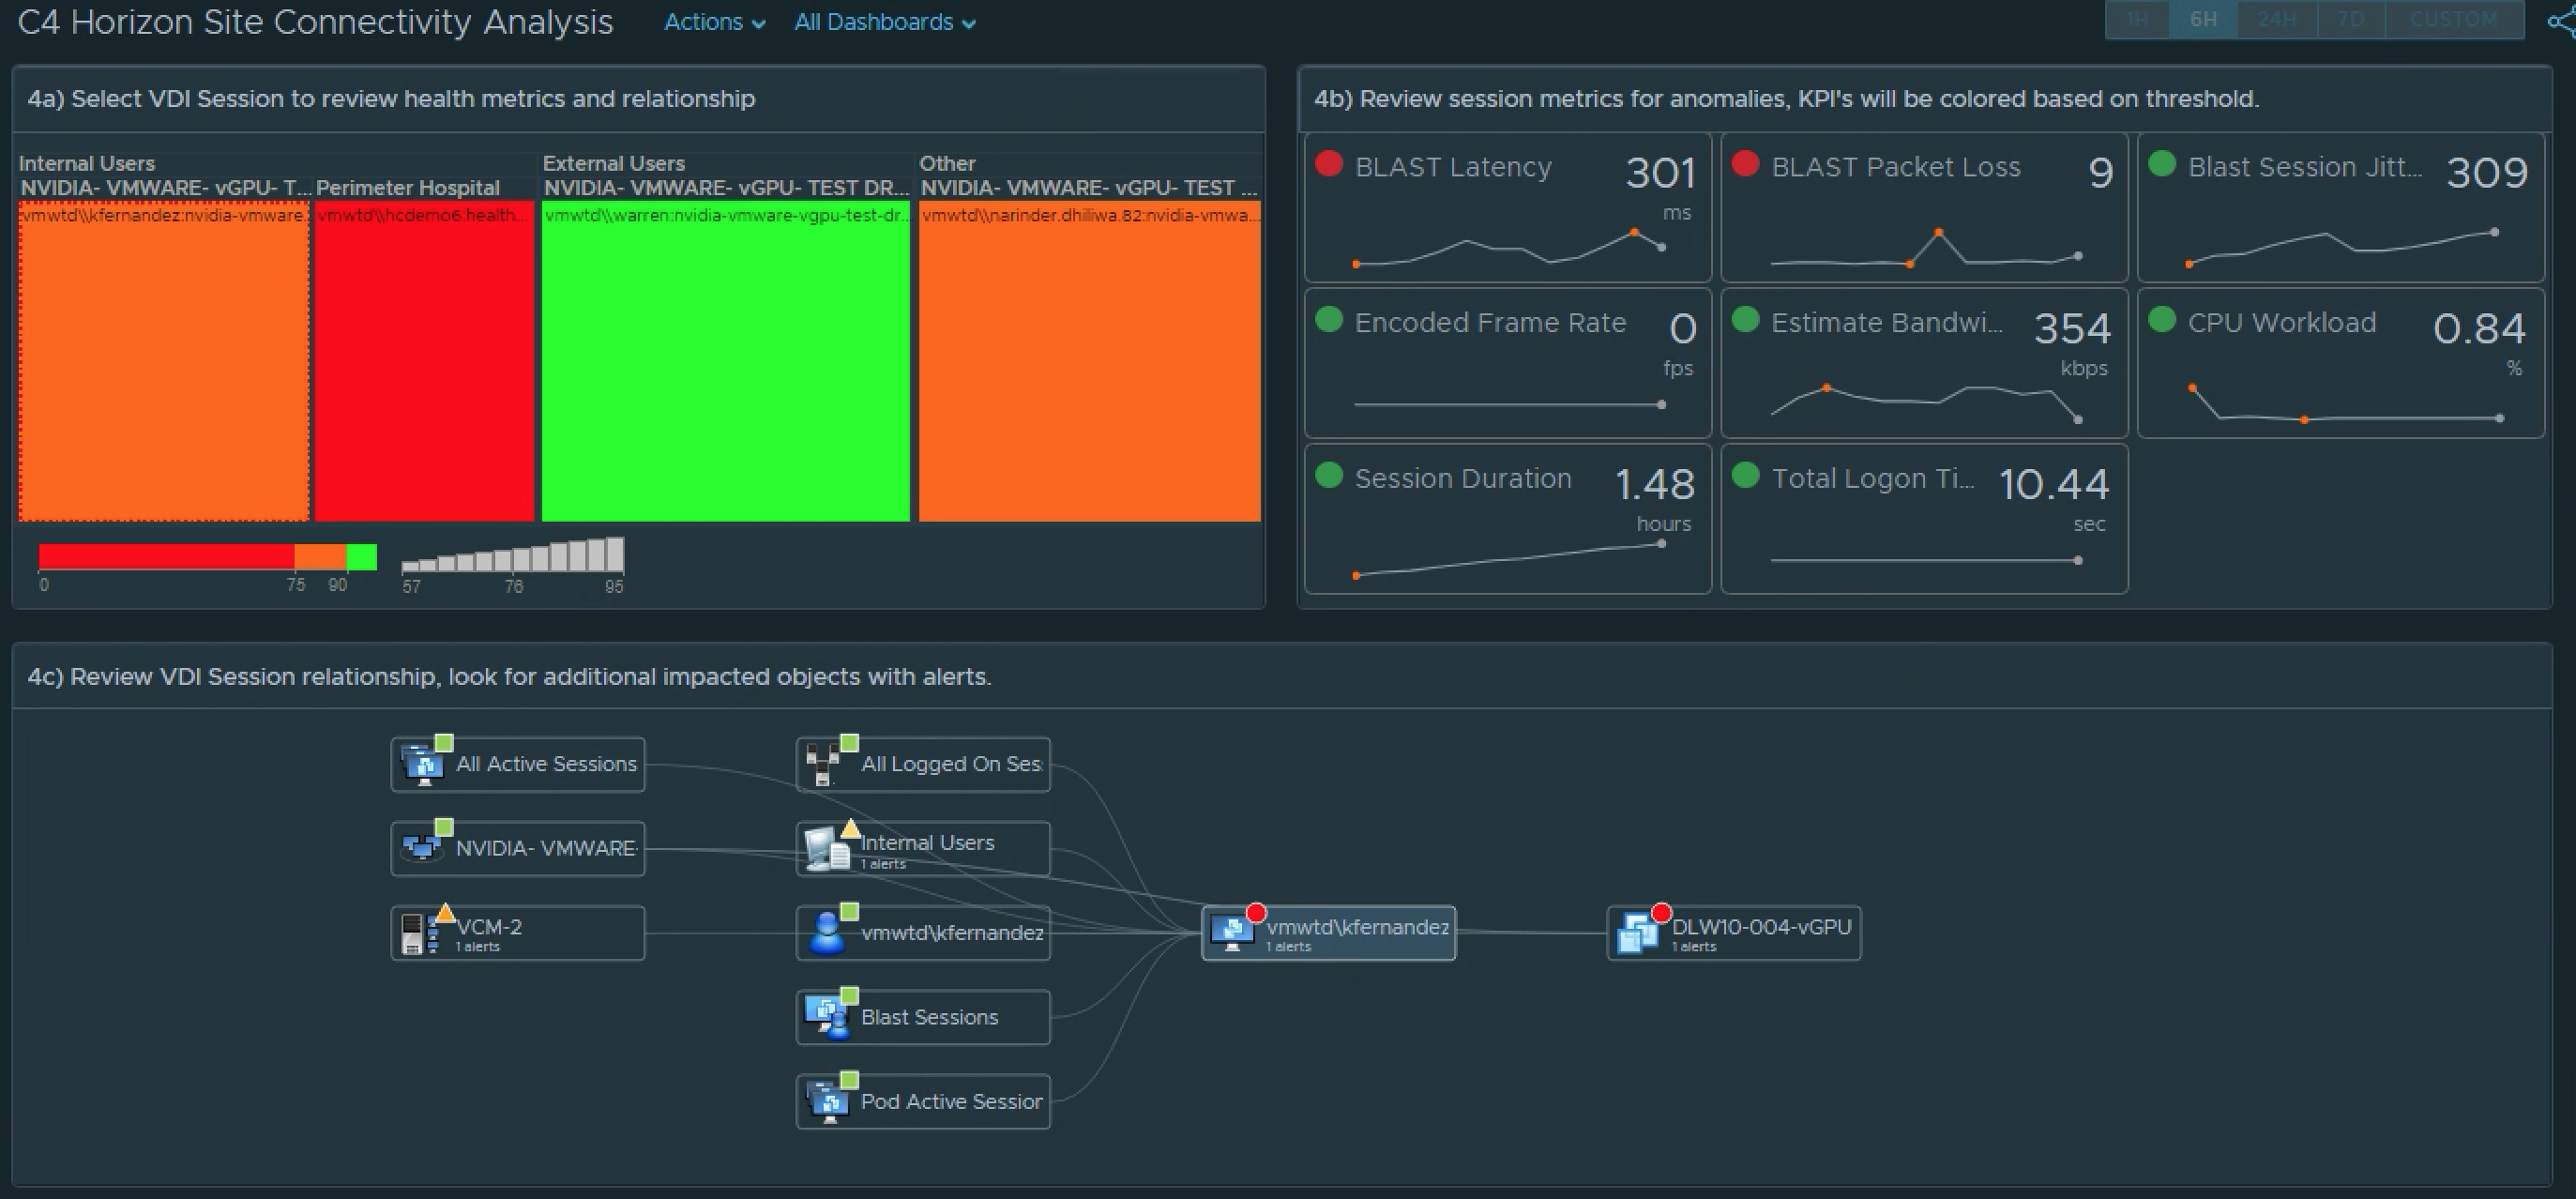
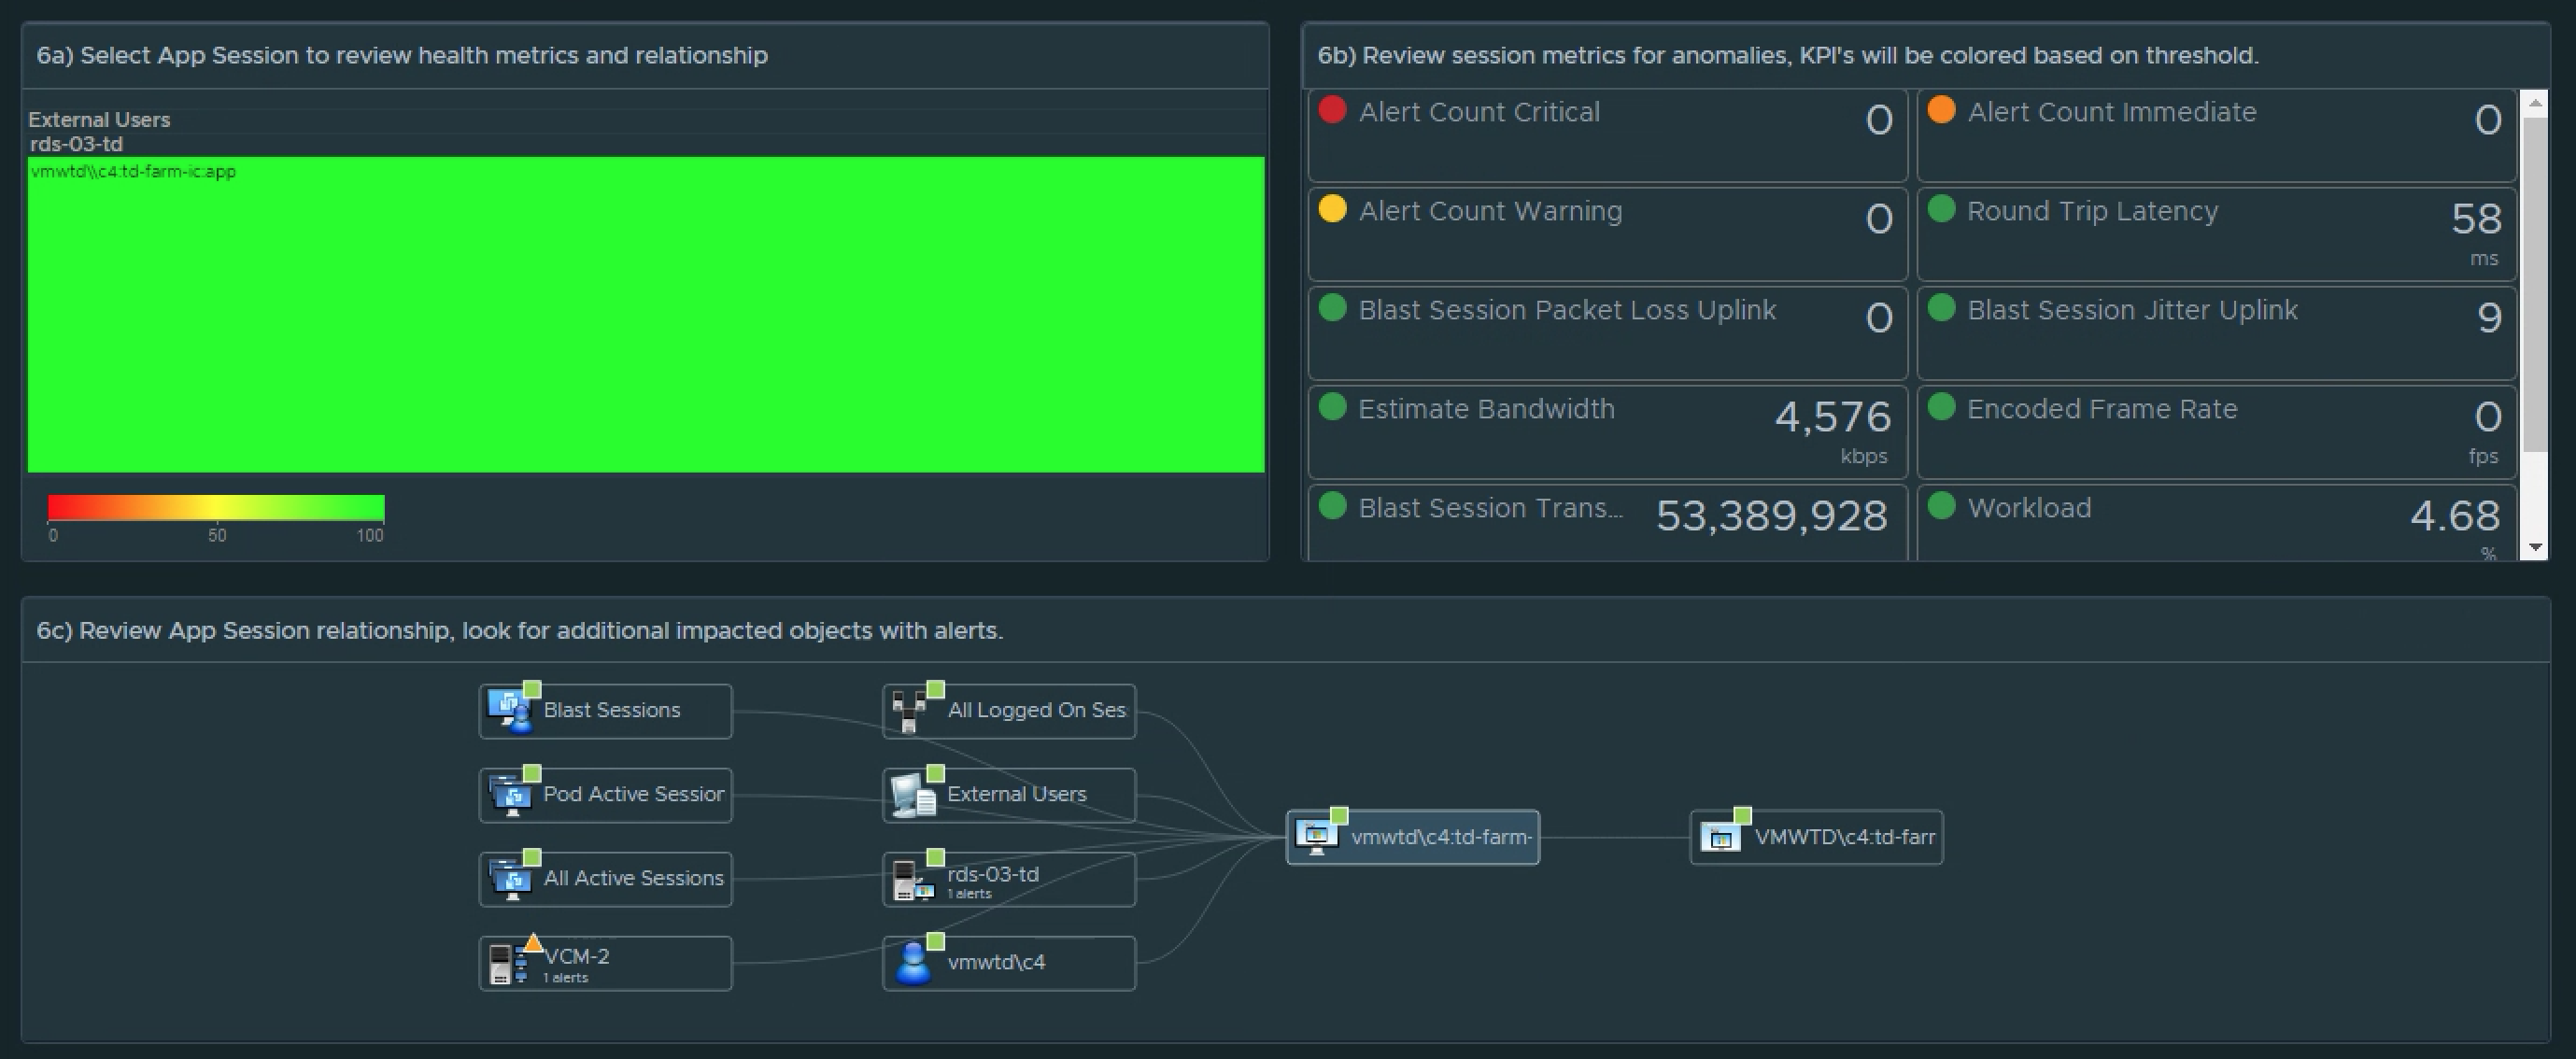
To do so, I’ve created a custom example Dashboard that allows you to select from the list of defined sites, and then display the relevant Alerts and Super Metrics that we defined on those sites. While you can choose to display the data in any manner you see fit, I’ve chosen to use a combination of Scoreboard, Distribution, and Heatmap widgets.
I’ve also chosen to label the widgets using an ordered numbering system with directions so that other users leveraging the dashboard will know how it’s meant to be consumed.

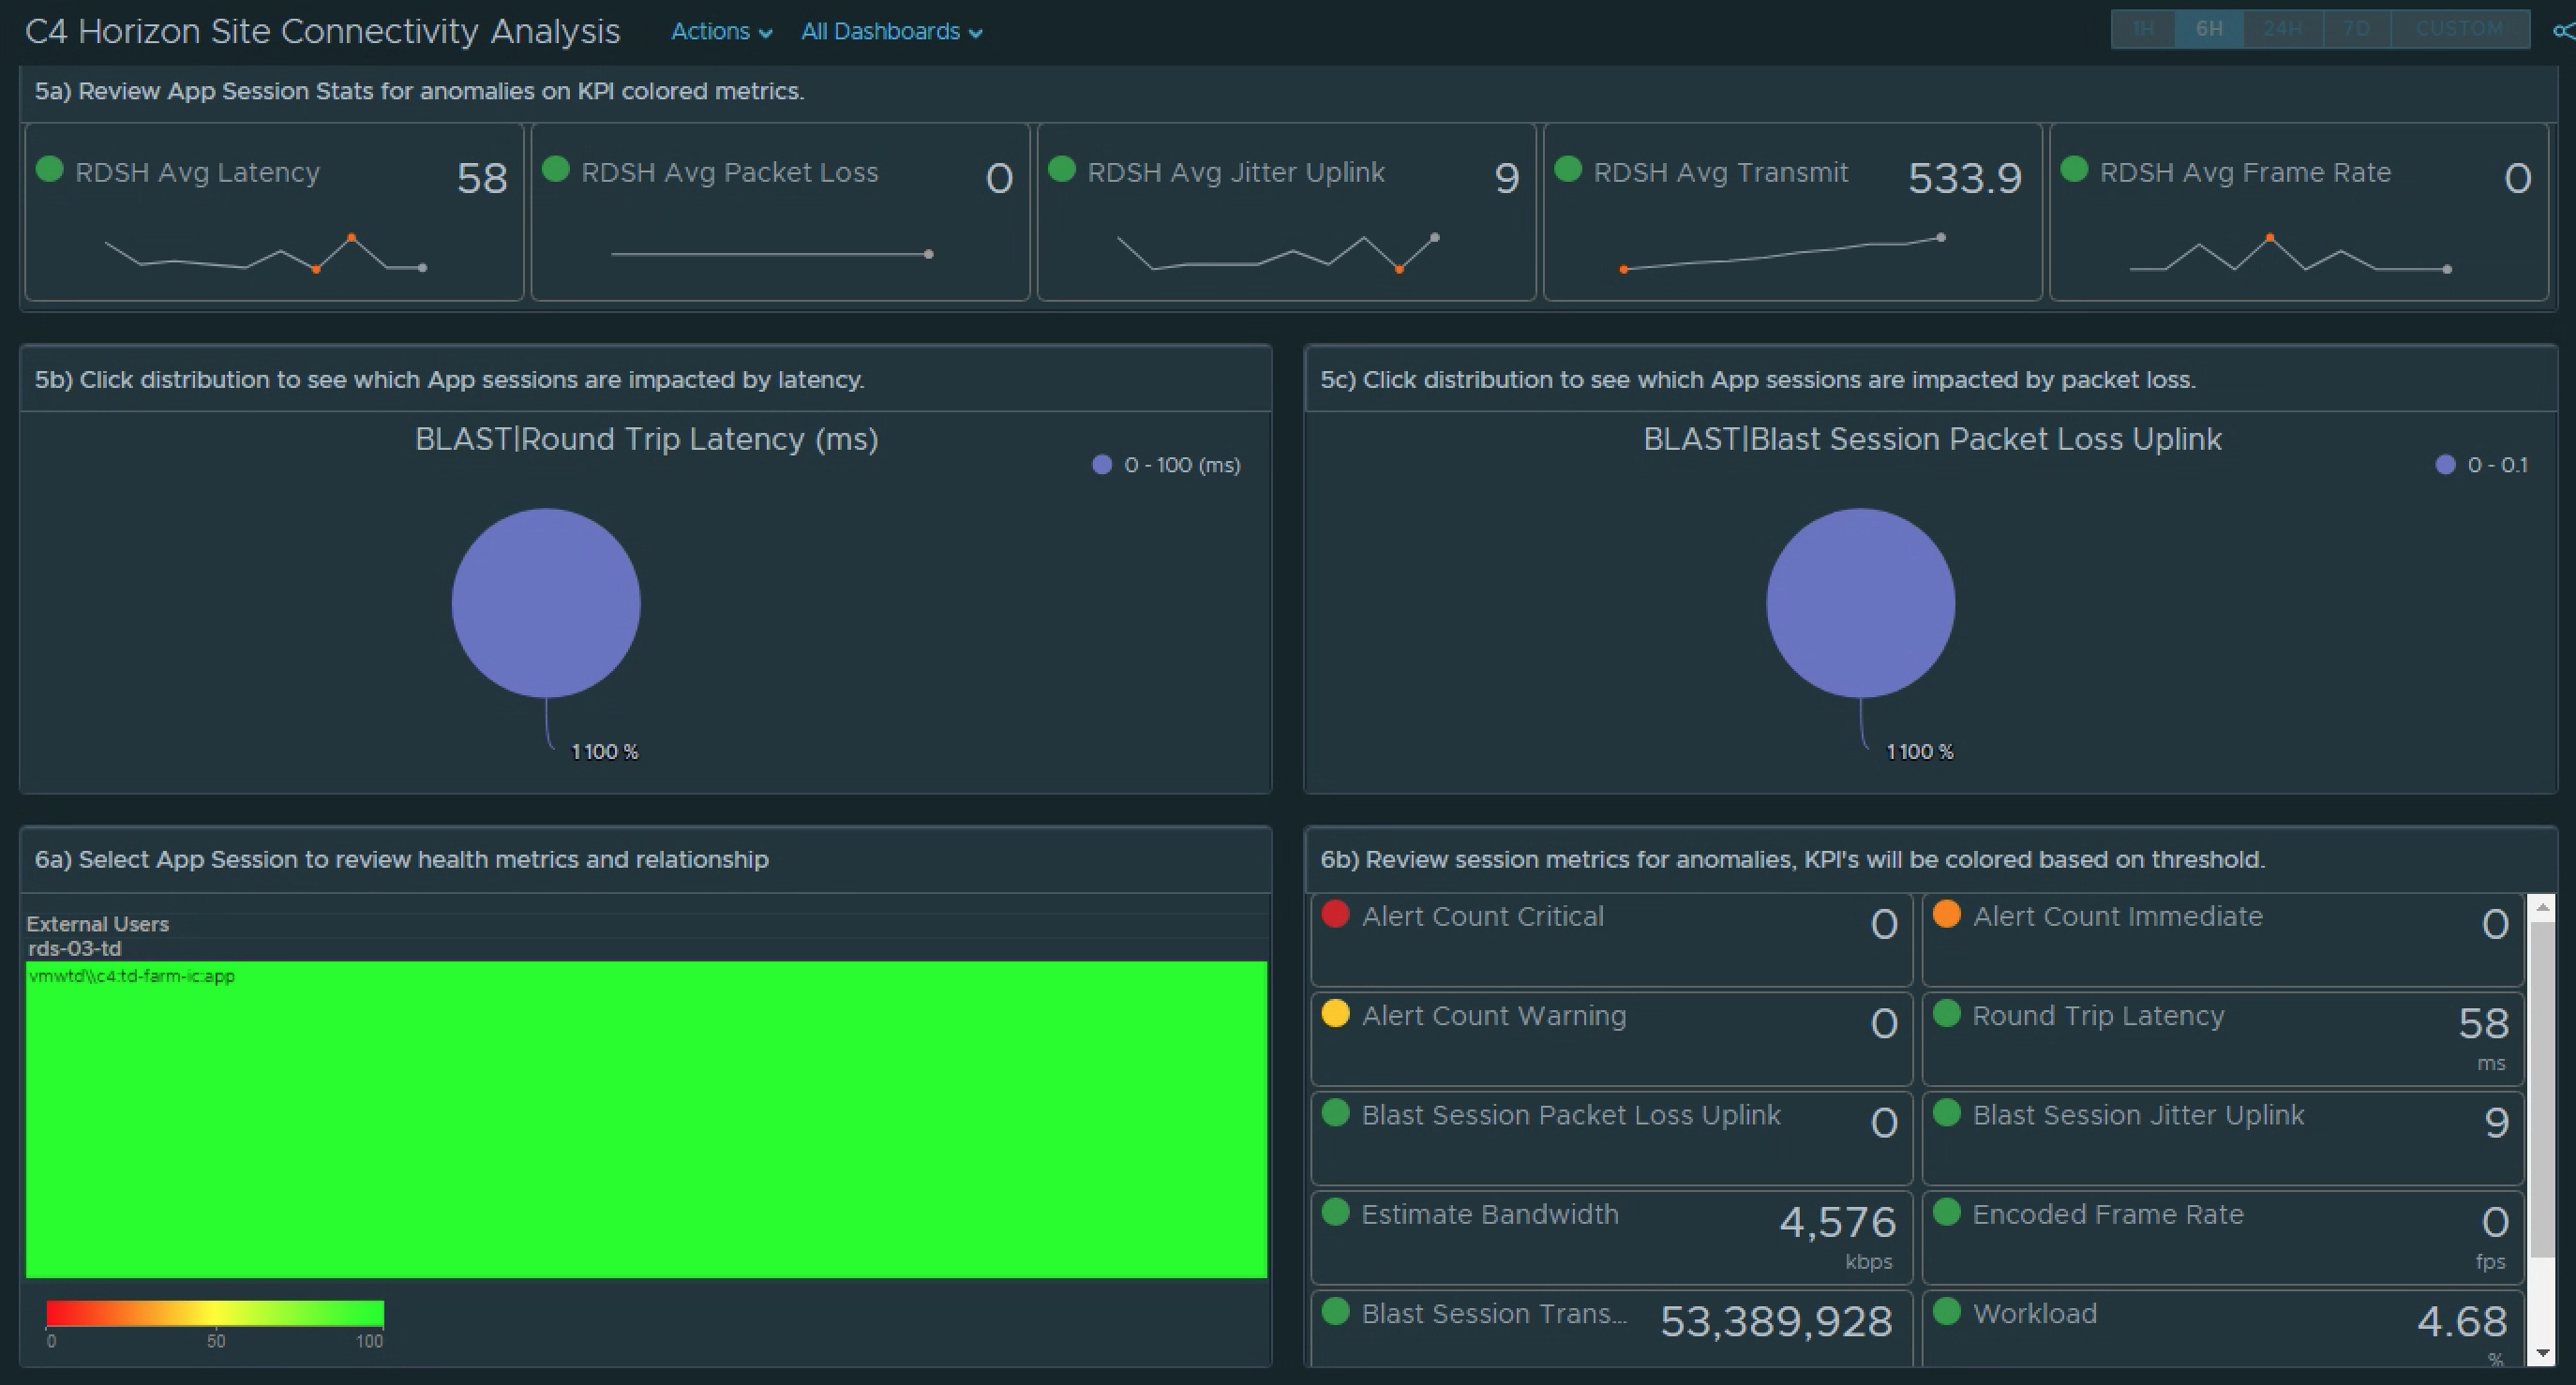
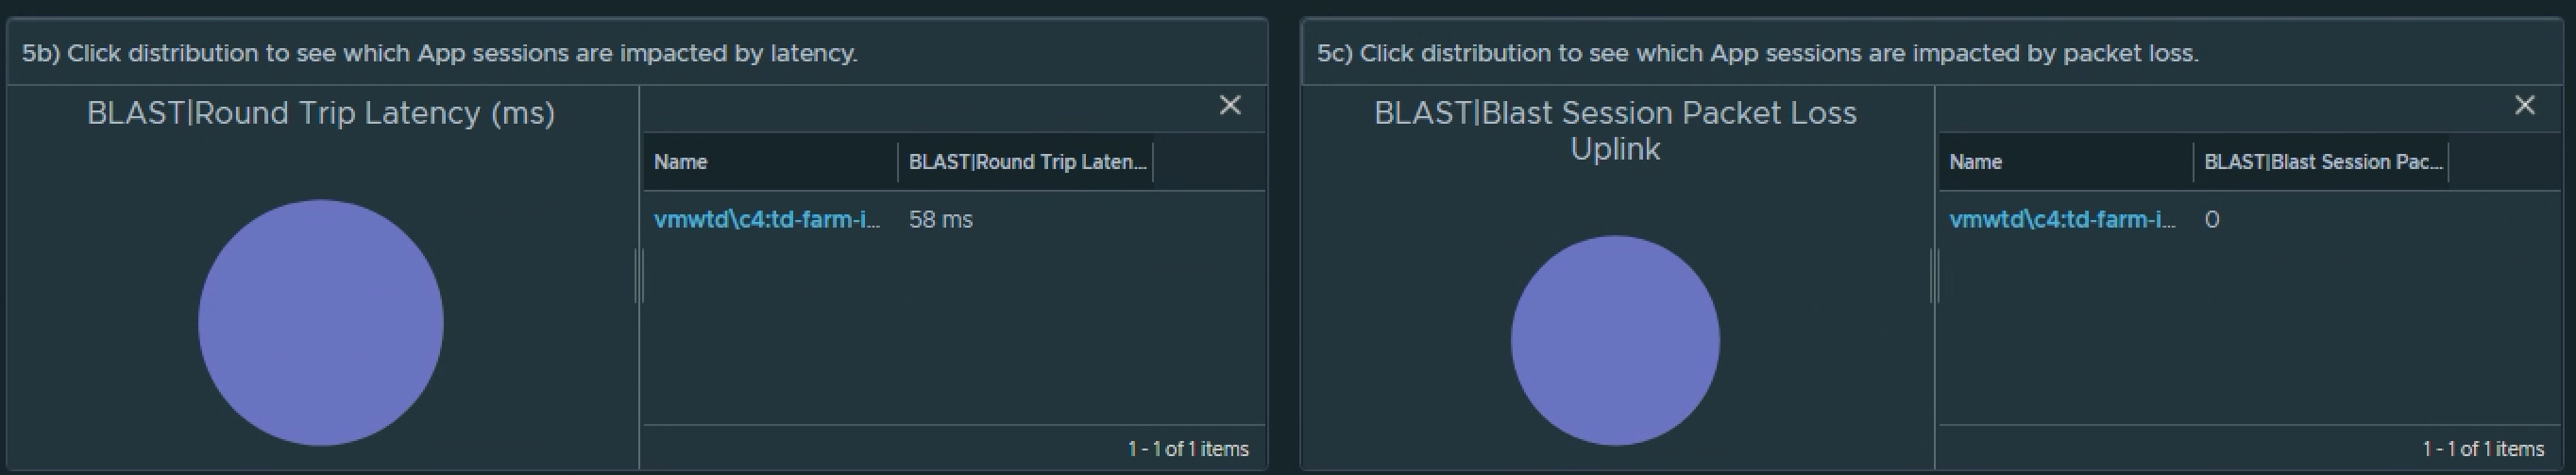
Continue your analysis of the Application Sessions if relevant for your site. The workflow will be the same as the above VDI Session analysis.
Next steps… Download and enjoy! 🏁

Now that we’ve discussed how to create the content and the high-level strategy for performing the site connectivity analysis, it’s time to download and import the content . The zip file provided in this blog contains all of the content that is required to create the custom dashboard, except for the step on creating the custom group locations. That step will still be required for you to define what “Sites” you want to monitor for connectivity performance.
Contents of the zip include a Dashboard_Horizon Site Location Analysis.zip, Views_Horizon Site Location Analysis.zip, and Supermetric_Horizon Site Analysis.json. All of which need to be imported and at least one Location group defined before the Dashboard will function properly.
Enjoy! Please provide thoughts or feedback on how to make the dashboard and content better.
3 Replies to “Location analysis using vROPs for Horizon”