vROPs 8.0 Horizon Adapter 6.7.1 Updated Dashboards

Horizon Overview

Horizon Desktop End-to-End Performance Analysis

Cluster Contention Analysis

Horizon Site Connectivity Analysis

Horizon User History Report

Ready to Download?

** Dashboards can be demoed in the VMware TestDrive environment: https://portal.vmtestdrive.com/

Content Release Notes:
This content release includes a number of Dashboards, Views, and Super Metrics designed to take advantage of the User Interface enhancements in the vROPs 8.x platform, providing richer and more visually impacting insight into the overall health, performance, and consumption of your Horizon View deployment.

Compatibility: All content was created on the latest vROP 8.0 platform, so it has only been tested to work with this specific version. The Super Metrics are most likely to work with older versions such as 7.5, but the Views specifically have configurations options that were not available prior to vROPs 8.0.

With vROPs 8.0, only Horizon Adapter 6.7.x is fully supported, so make sure that your Horizon View environment is compatible with the vROPs for Horizon 6.7.x adapter.

Compatibility Matrix: https://www.vmware.com/resources/compatibility/sim/interop_matrix.php#interop&

Conditions: All content provided is on an as-is basis, and should be validated and tested before use in production environments.

*It is recommended that you import and configure the provided Views and Super Metrics before importing the dashboards. Examples of how to do so are provided in previous posts.

How to add Historic User Session Latency to vROPs for Horizon.

VROPs for Horizon provides end-to-end visibility into key User session statistics that make it easy for Horizon admins to visualize and alert on performance problems impacting the user’s of their environment. One of the key metrics used in determining how well user’s are connected to their virtual app or desktop session is Session Latency (ms), as it most visually impacts the user’s perspective of their session performance.  The lower the session latency, the quicker video, keyboard, and mouse inputs are redirected to and from a user’s endpoint client, giving the user a more native-like PC experience.

As the latency trends higher (>180ms), the experience begins to degrade, and the user can begin to notice “sluggishness“ – slow keyboard, mouse, and video responsiveness.

VROPs for Horizon gives us direct visibility into when these issues are occurring across all of the Active User Sessions of the Horizon View environment.  However, once the session becomes inactive, it will go into a stale object state and be removed from vROPs during a clean-up window.

To be able to view this information historically on Pools and User objects, you can create Super Metrics that simply maps the session latency to the objects you want to report on.

Creating the Super Metric

To create the Super Metric, Navigate to Administration -> Configuration -> Super Metrics.  Click the green + sign to create a new Super Metric.

Provide the Super Metric a unique name, in this case we are using “Avg App Session Latency”.  Search for the  “Application Session” Object Type, and click “Round Trip Latency (ms)” to add it to the Super Metric.  Since, we are looking for the average latency, select “avg” from the available functions list, making sure that the average function applies to the metric by encapsulating it parenthesis as demonstrated in the image below.  Click Save to finish the Super Metric.

Next, you will need to add the Super Metric to the “User” object type.  Click the green + sign under the “Object Types” section.  Search and select the “User” object type.

Before the Super Metric will begin collecting data, you will need to navigate to Administration-> Policies, and edit the active monitoring policy to enable the metric for collection.

Once the metric has started to collect data, you can view the data on a individual “User” object by selecting “All Metrics” -> Super Metric -> select metric.

You can also create custom Views that display the historical latency for all users of the environment, as well as perform simple roll-up statistics.

How to leverage Historic User Reporting in vROPs for Horizon 6.5

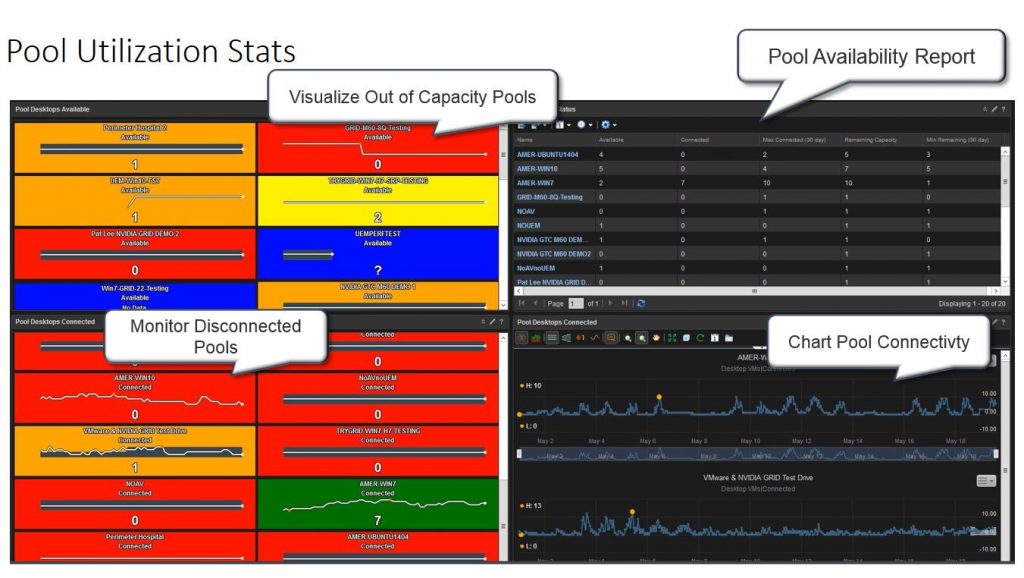
When it comes to monitoring of a Virtual App environment, having easy access to historic User records is key for management level reporting.  Insight into previous pool access, applications launched in a desktop session, and client IP address are just a few key metrics that organizations need the ability to report on user activity.

In the latest vROPs for Horizon 6.5, there were a number of enhancements to User and Desktops Pool related metrics, that make it easier for customers to track historic usage of their Horizon View environment. These enhancements include the ability to track which desktops and application pools a user has accessed, login time, previous machine name, and various other useful metrics.

This post will guide you on how to import a custom Horizon User History Dashboard that leverages these features, as well as how to utilize the widgets to enhance the monitoring and reporting of your Horizon View environment.

Horizon User History Dashboard for Historic User Reporting:

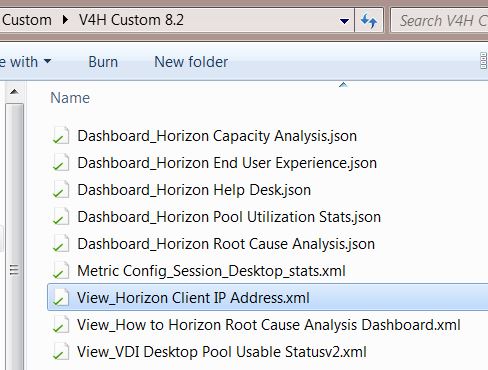
To provide quick access to user historic reporting, I’ve created a new Horizon User History Dashboard that is available for download at the following link:

Download Horizon User History Dashboard

Download Metric Config

Download Horizon User History View

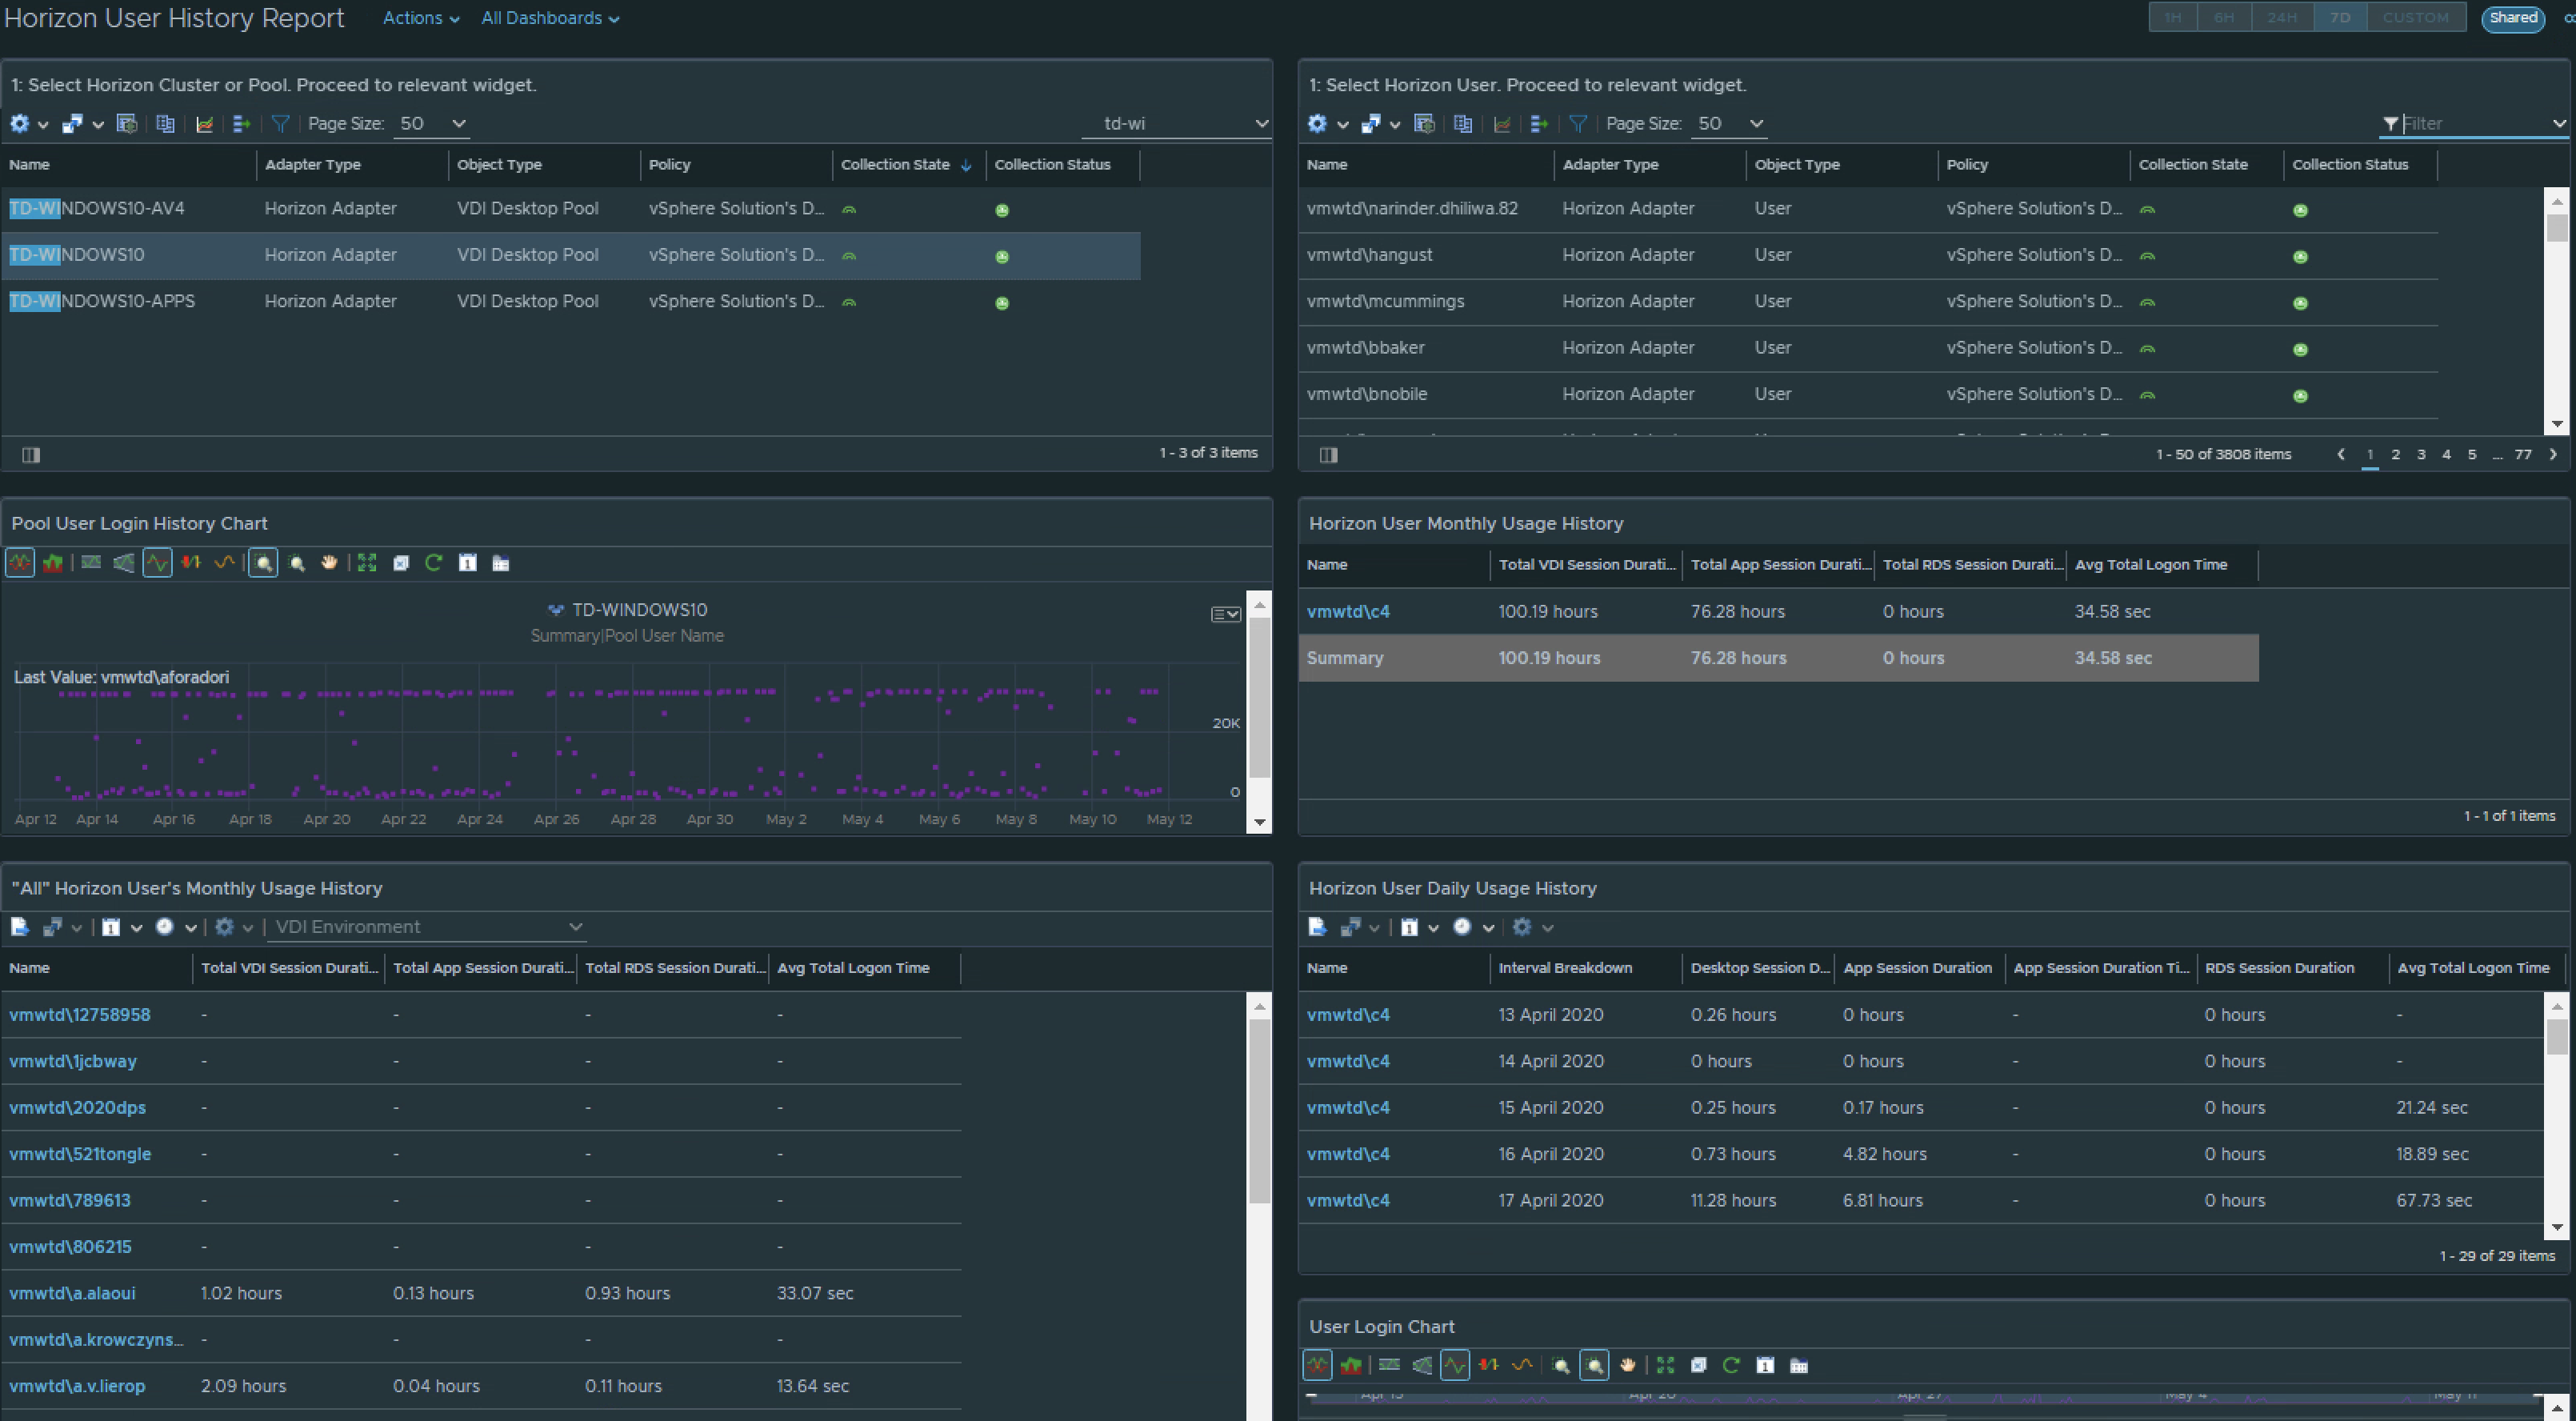
This dashboard is designed to allow a customer to quickly search for a user’s Active Directory user name, and display all of the relevant historic metrics available.

To use this Dashboard, it will first need to be imported along with the custom Metric Config and View provided in the zip files above. To do this, you will need to be logged into the vROPs console with sufficient rights to import content.

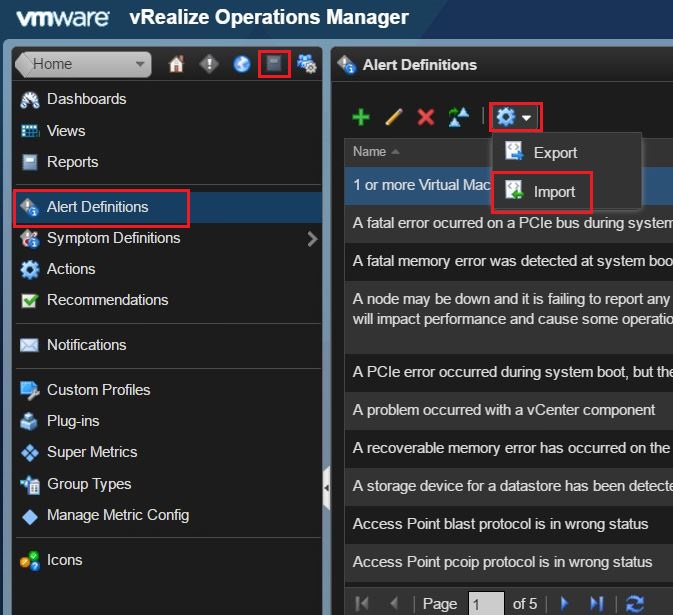
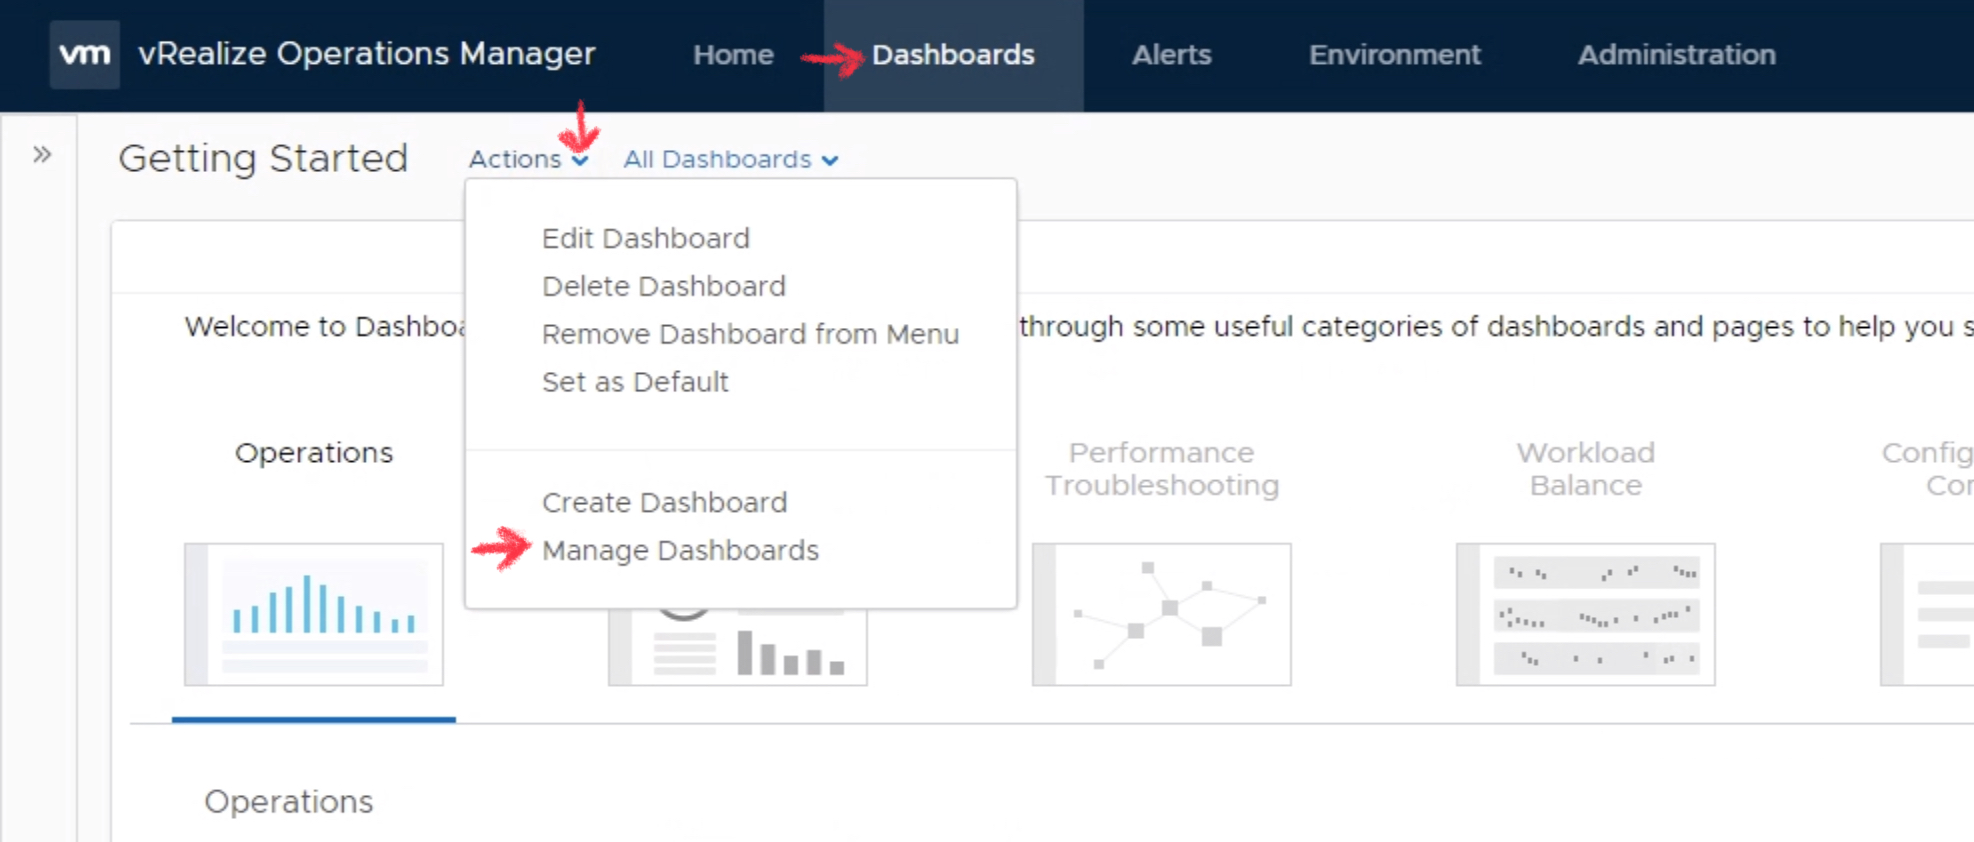
  1. Navigate to Dashboards -> Actions -> Manage Dashboards.

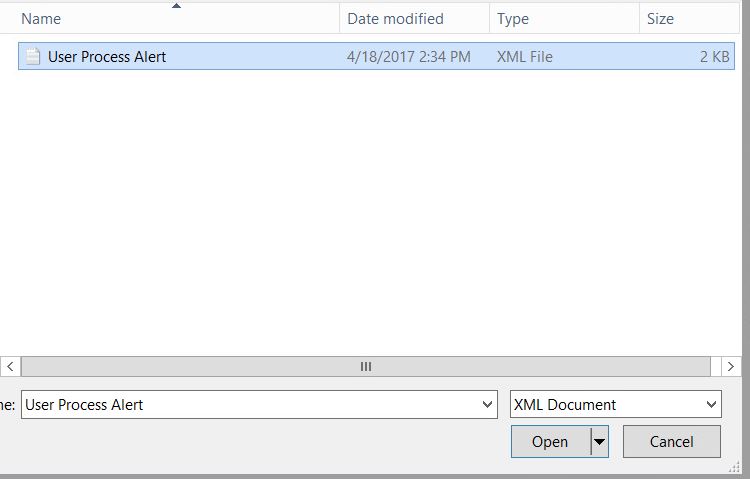
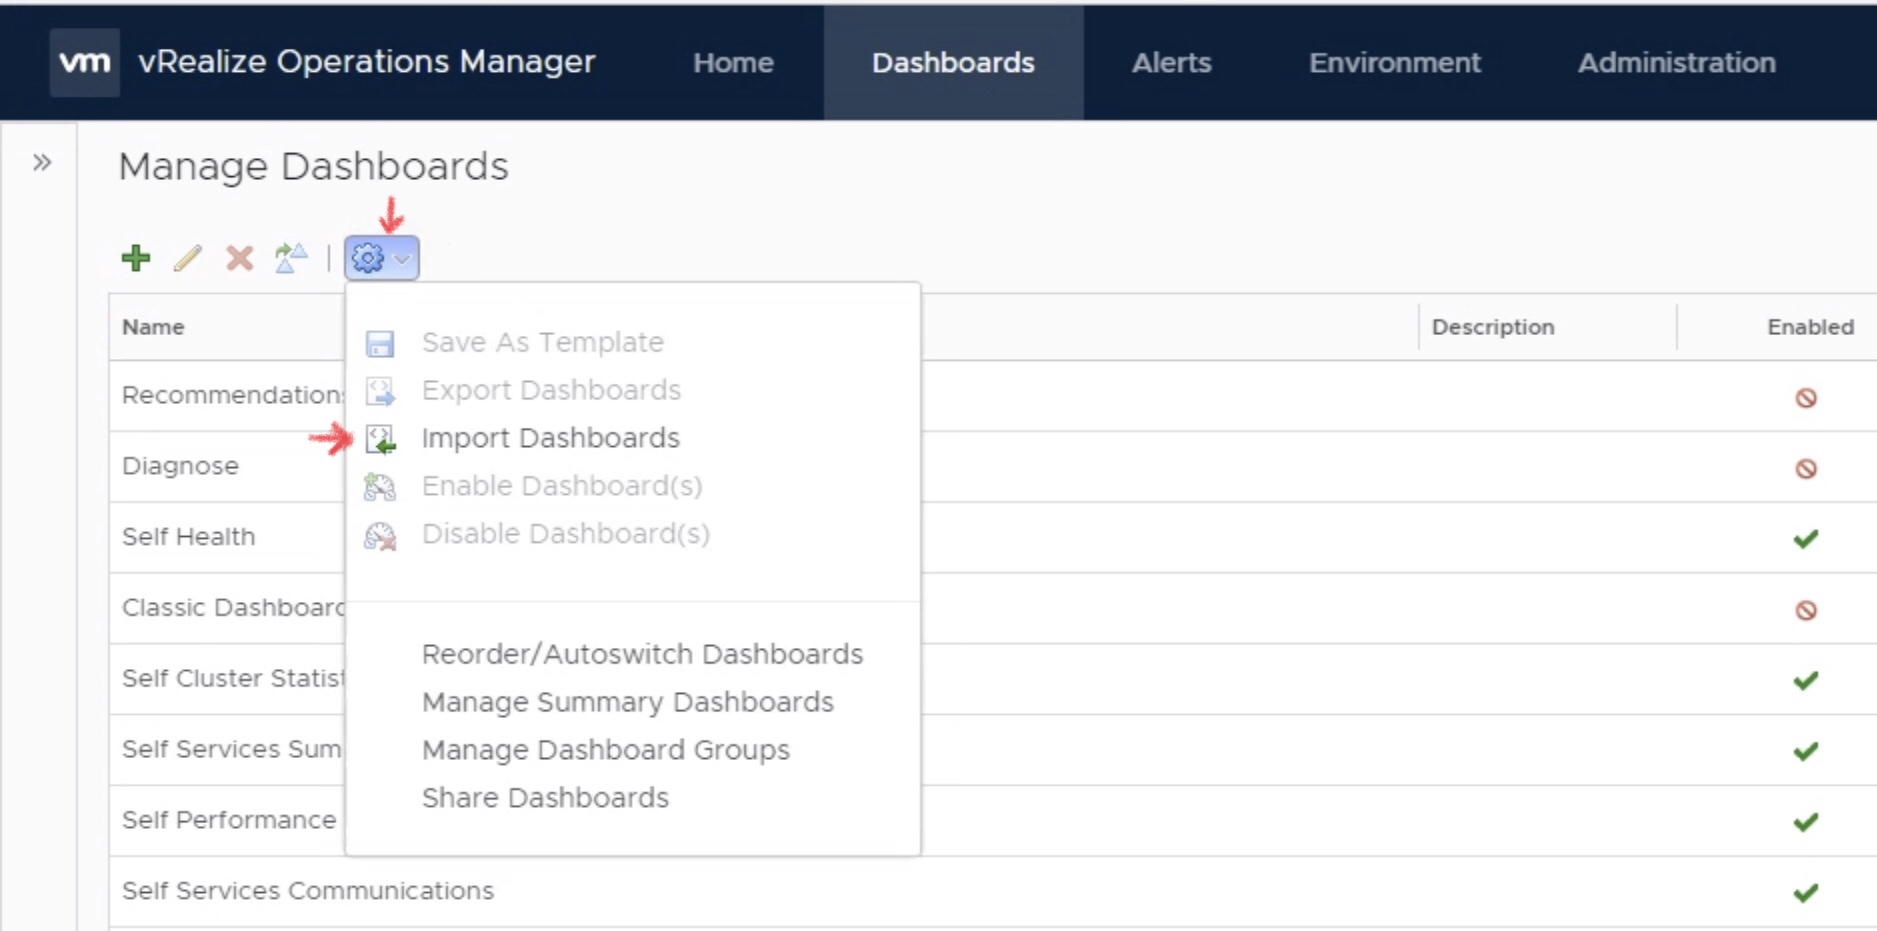
  2. Click the blue gear icon, navigate to the stored Dashboard file, and select Open to import.

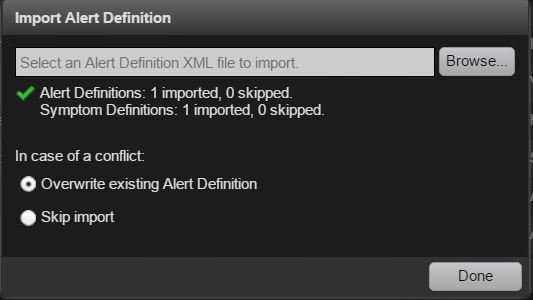
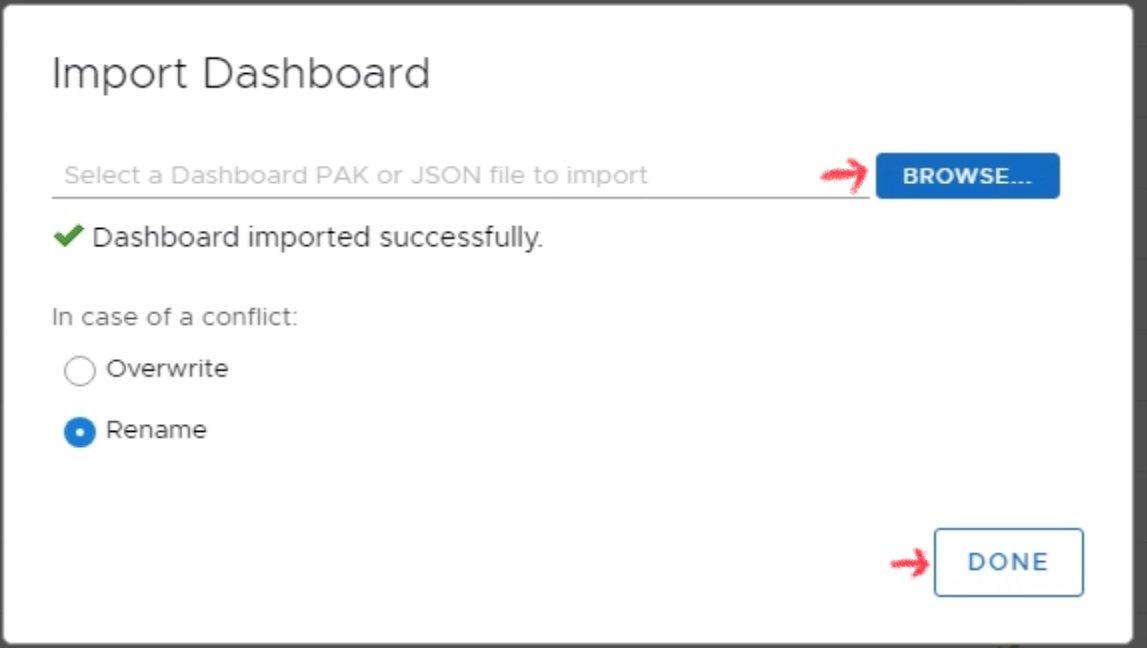
  3. Click Browse, select the provided XML file, and click Done.

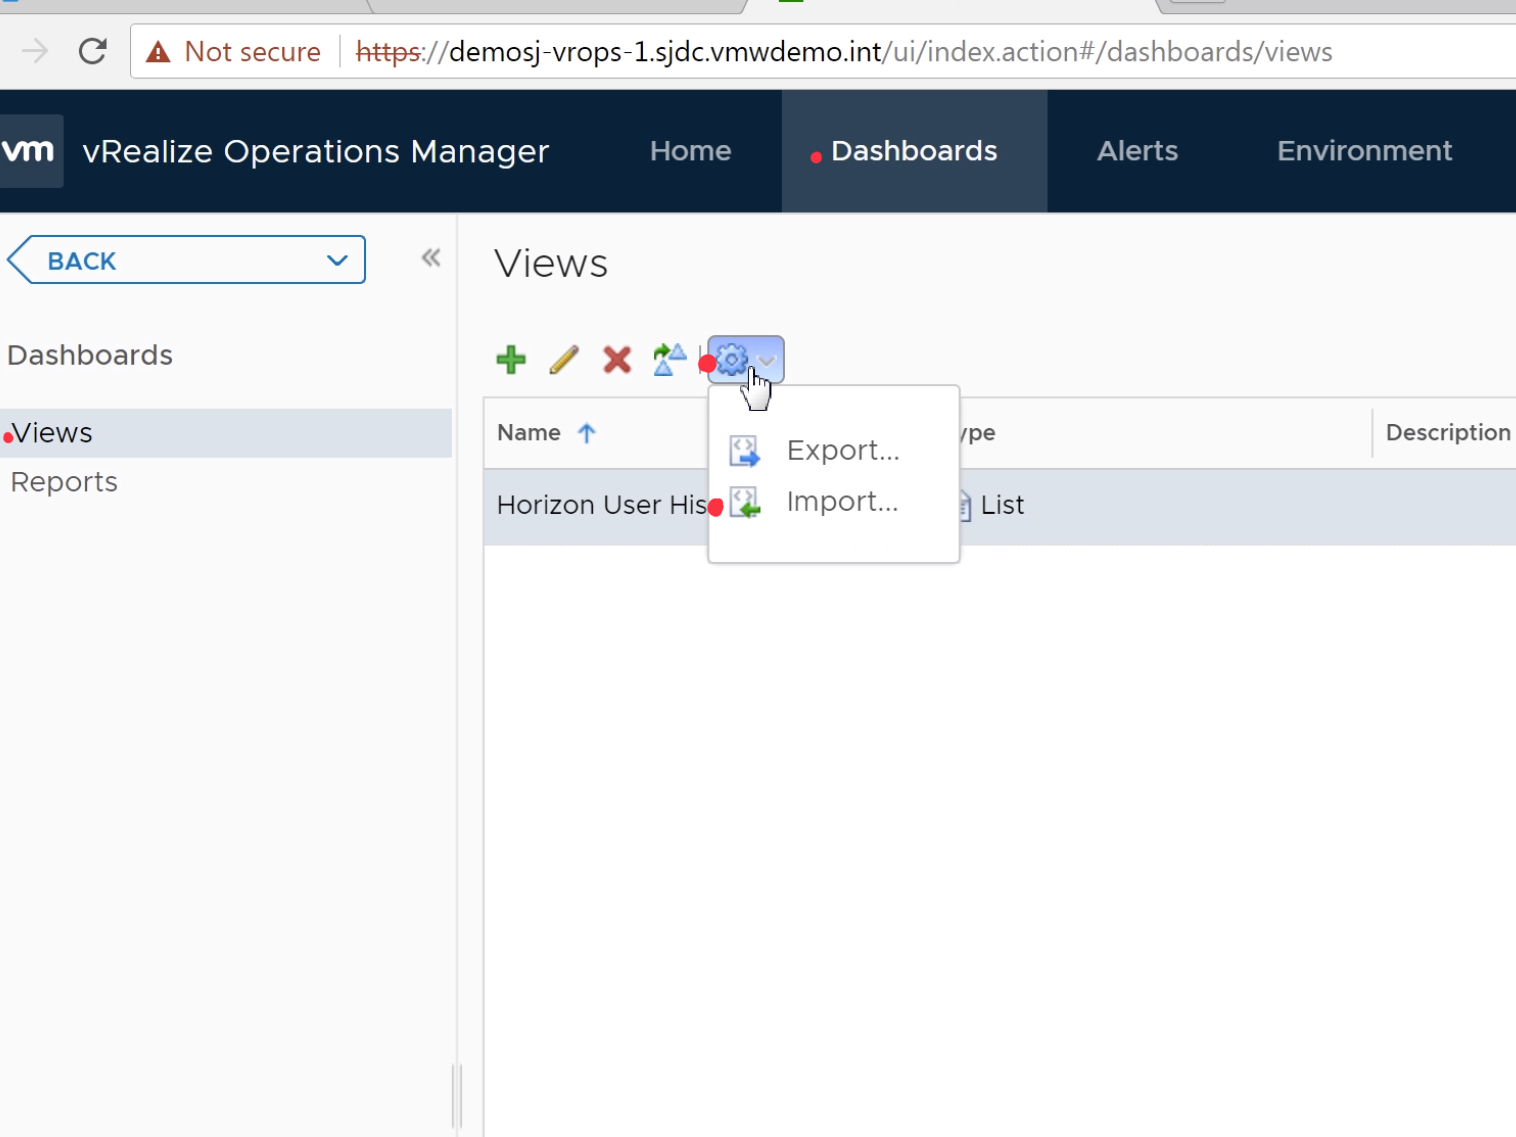
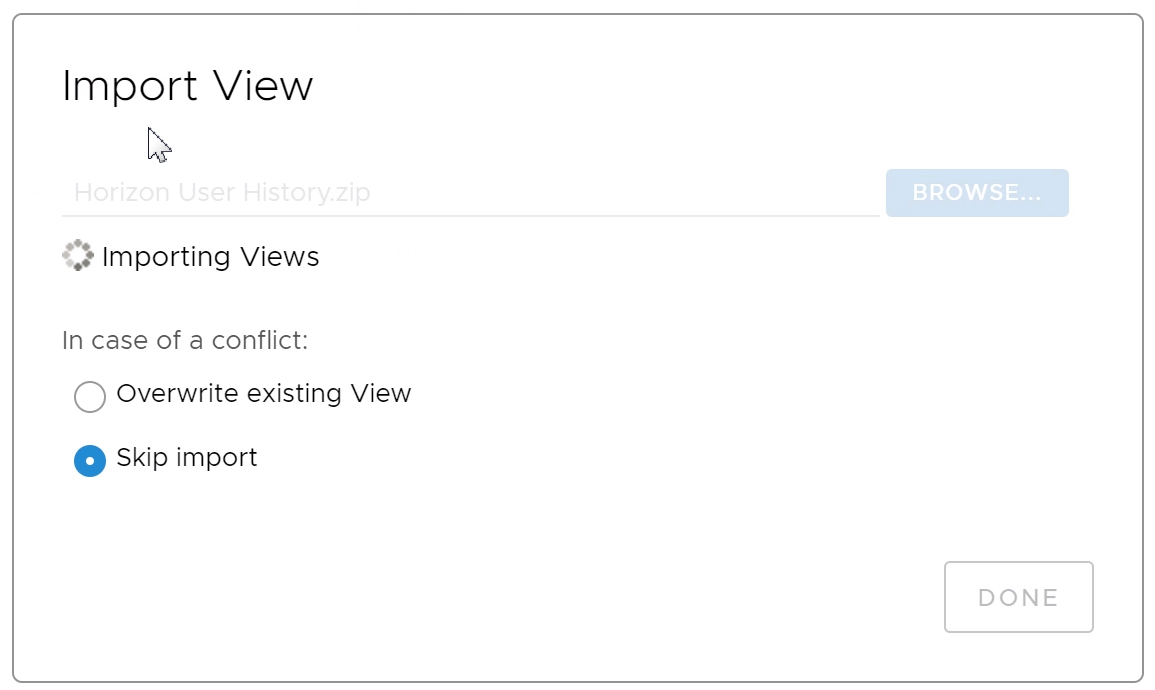
  4. To import the View, navigate to Dashboards, open the navigation tree, and select Views.
  5. Click the gear icon to import the Horizon User History.zip file provided above.

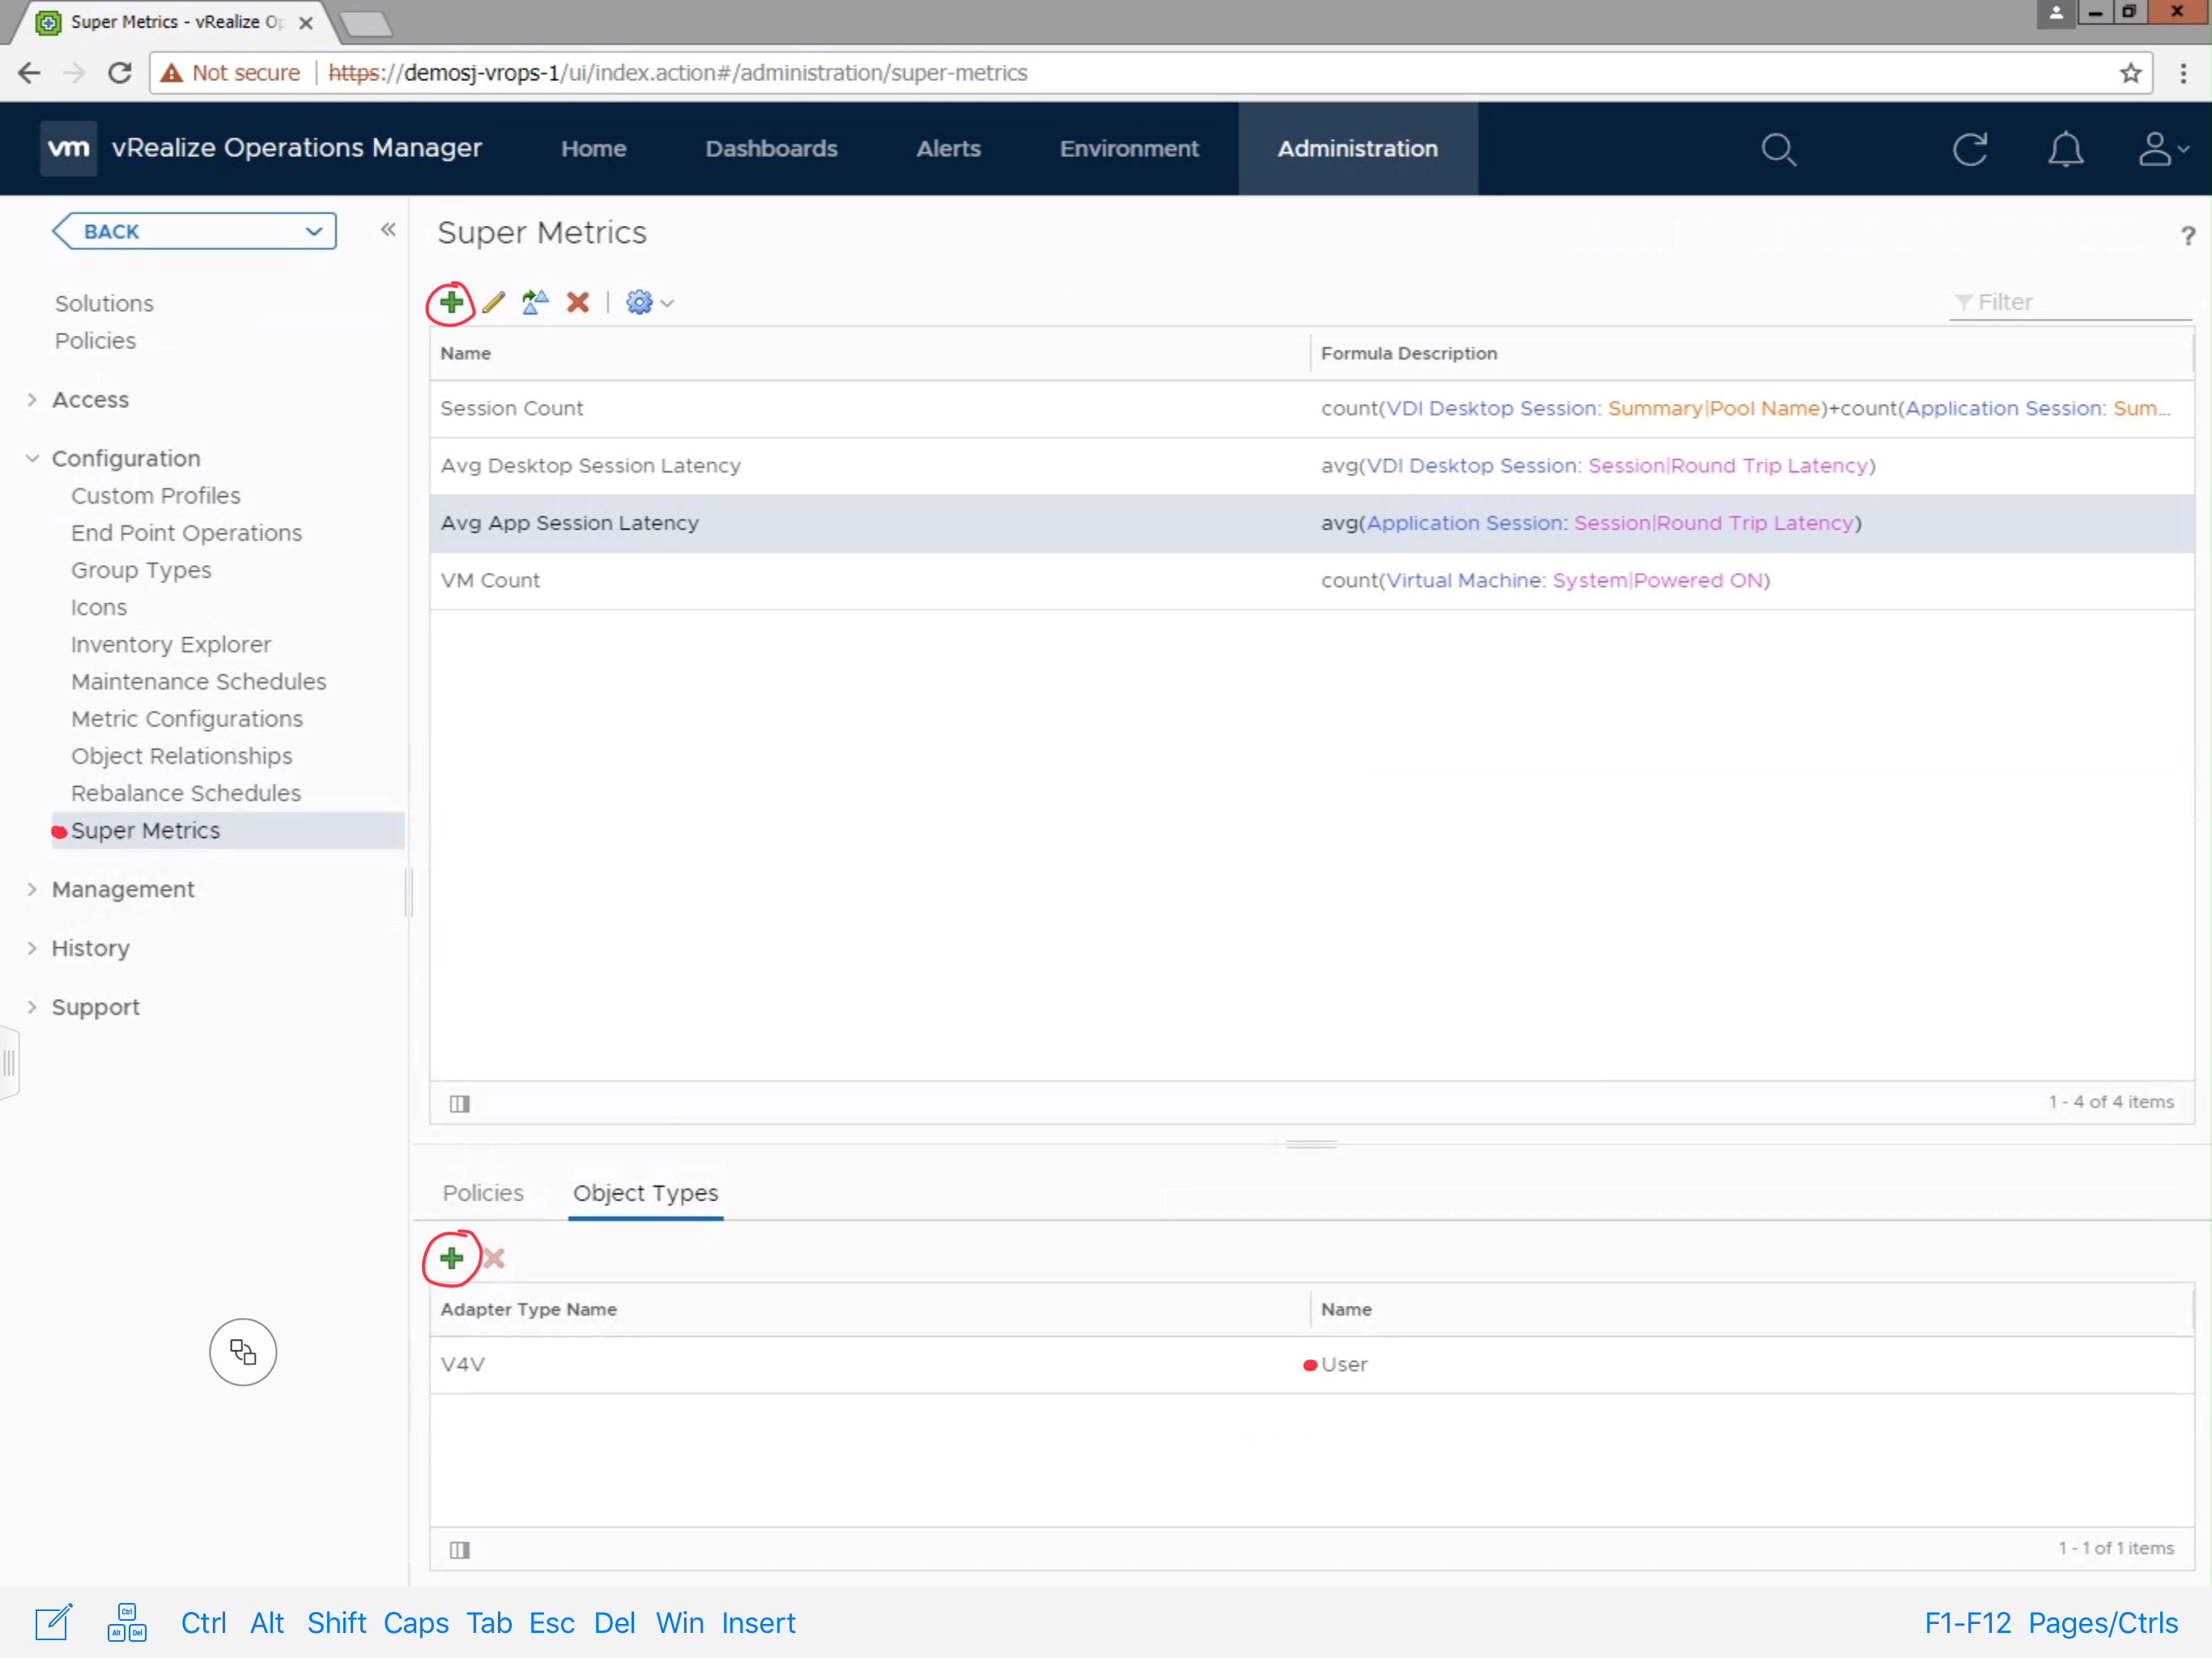
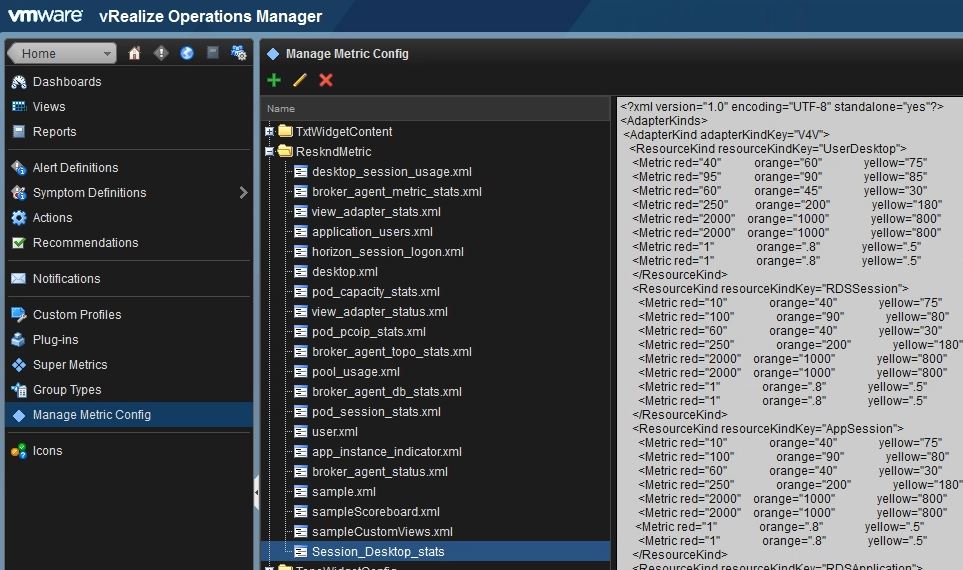
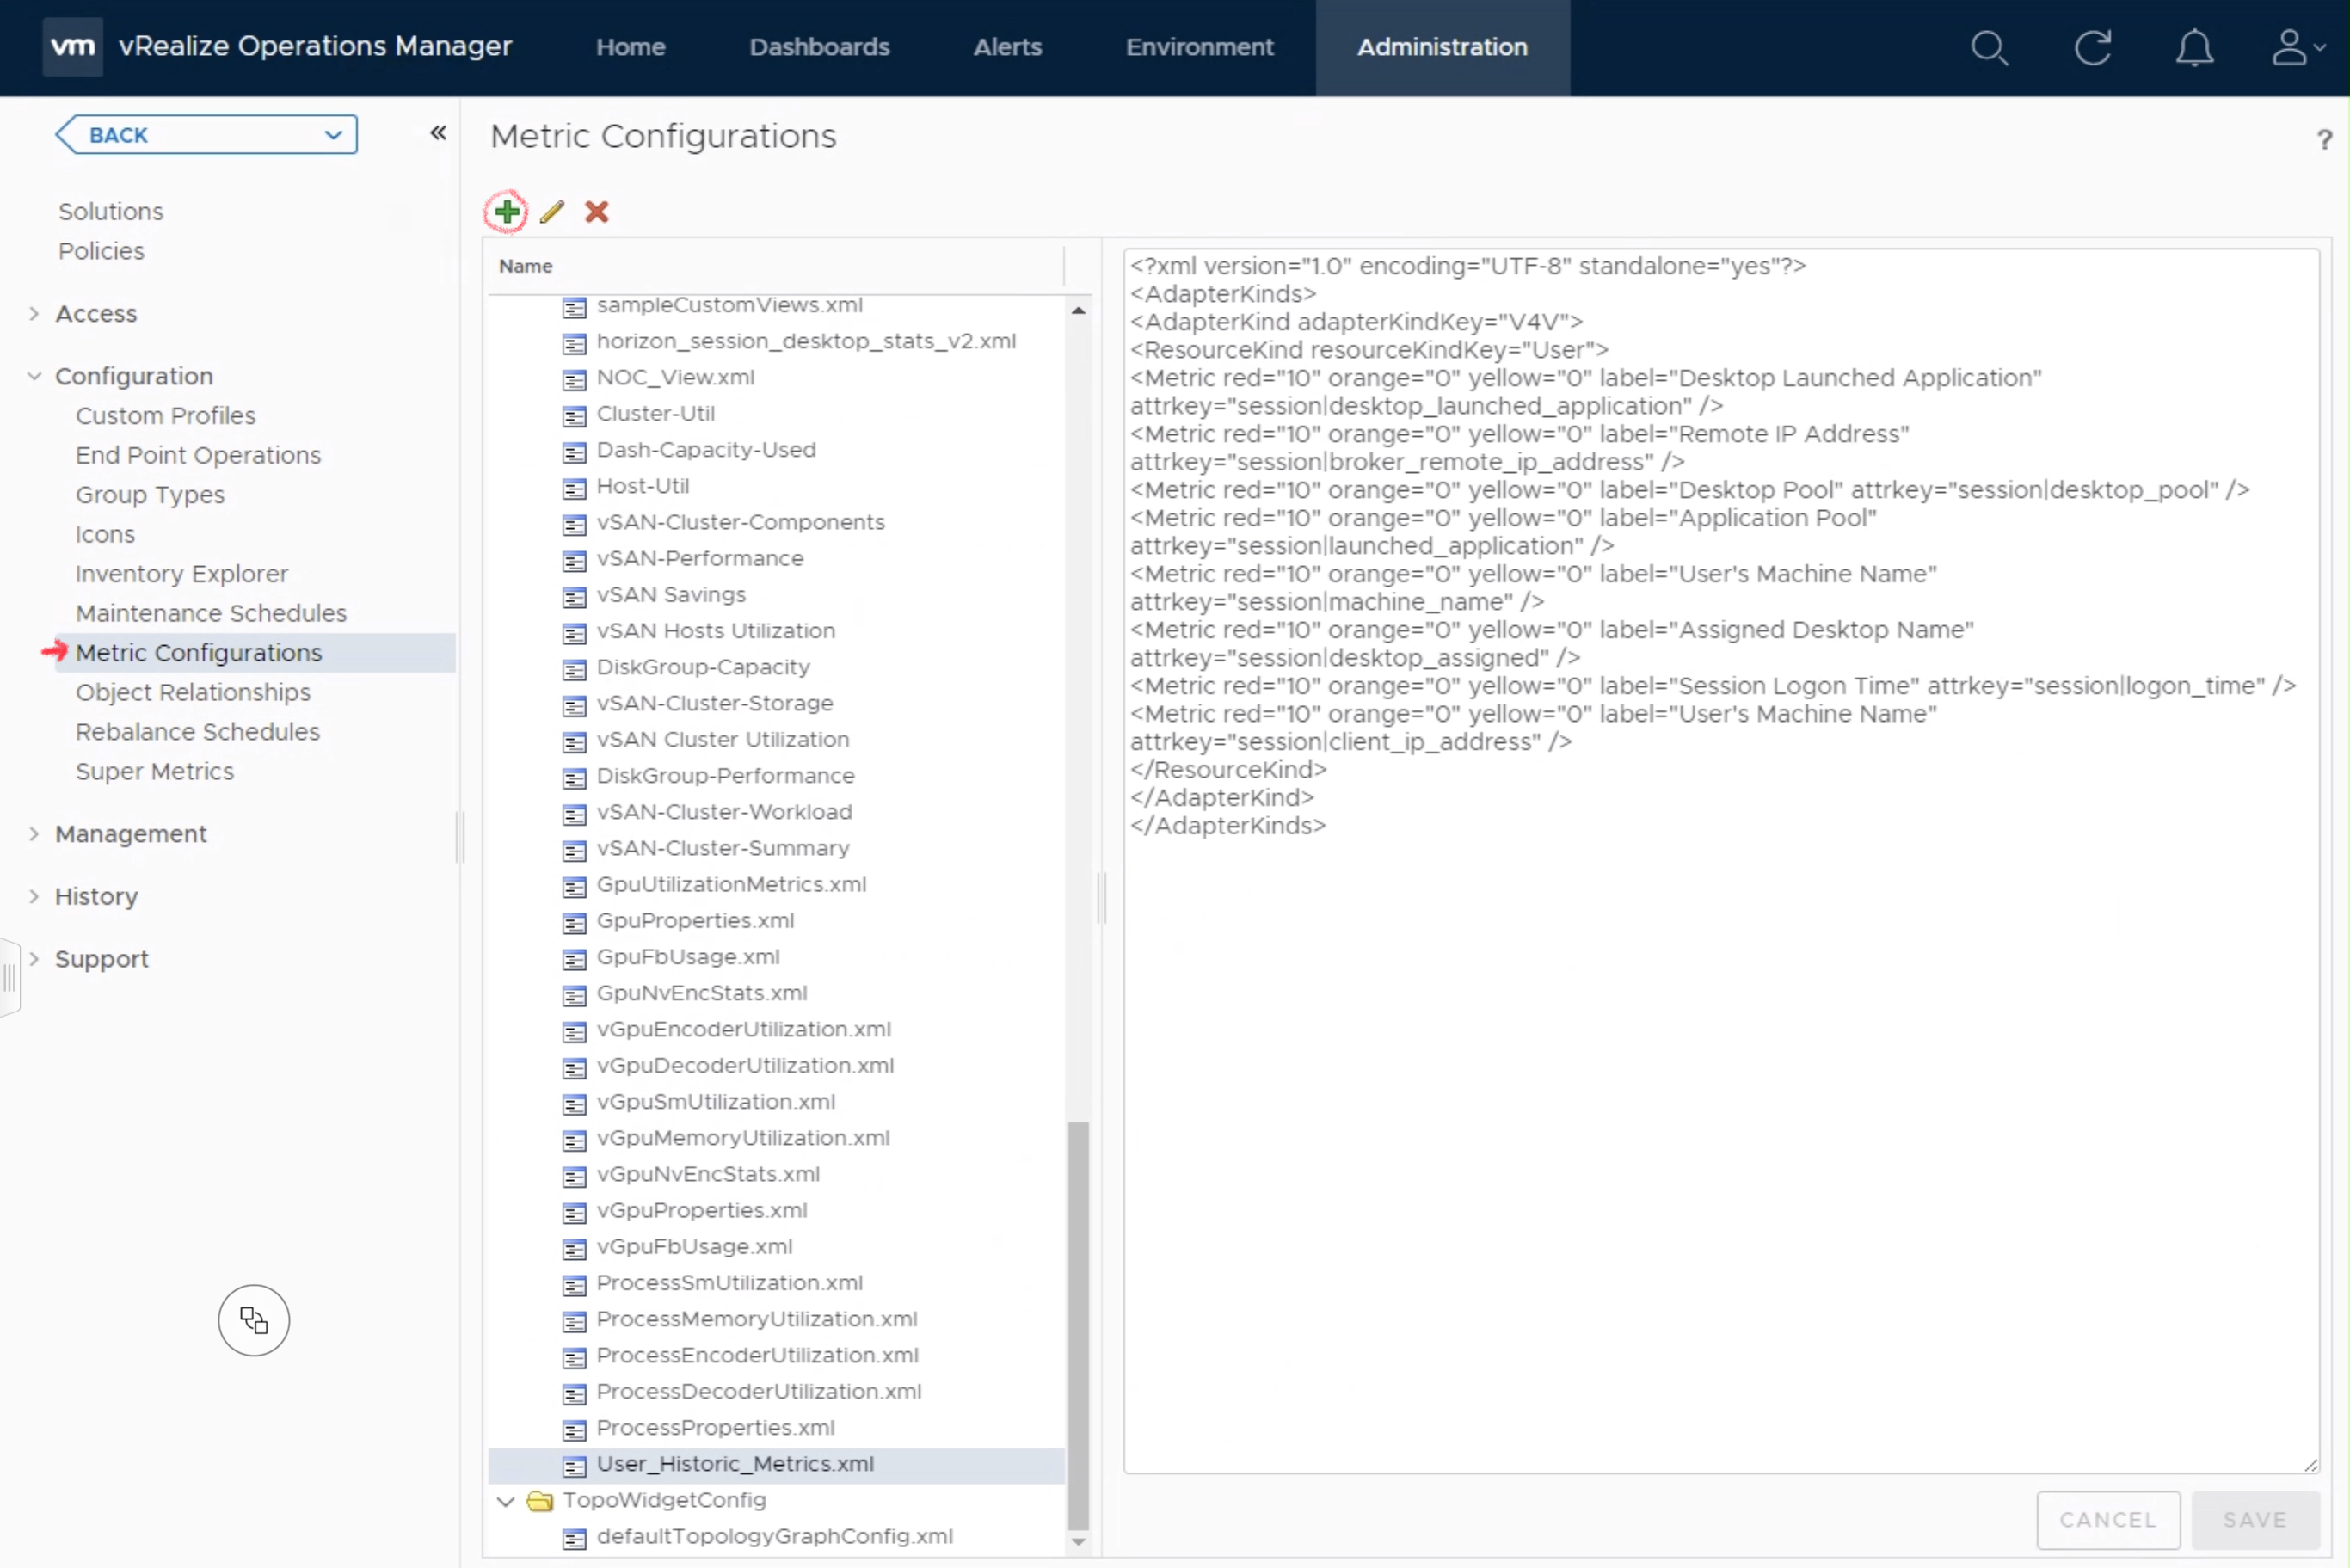
  6. To import the Metric Config, navigate and select Administration from the main menu.
  7. Expand the Configuration section, then select Metric Configurations, and select the ReskndMetrics section. 
  8. Next, you will click the + sign to create a new Metric Config file and name the new configuration “User_Historic_Metrics.xml”.  **Make sure this name matches exactly, or you will have to manually edit the widget in the dashboard and select the file name you created.
  9. Copy and paste the content from the provided XML file and click save.

Using the Horizon User History Dashboard:

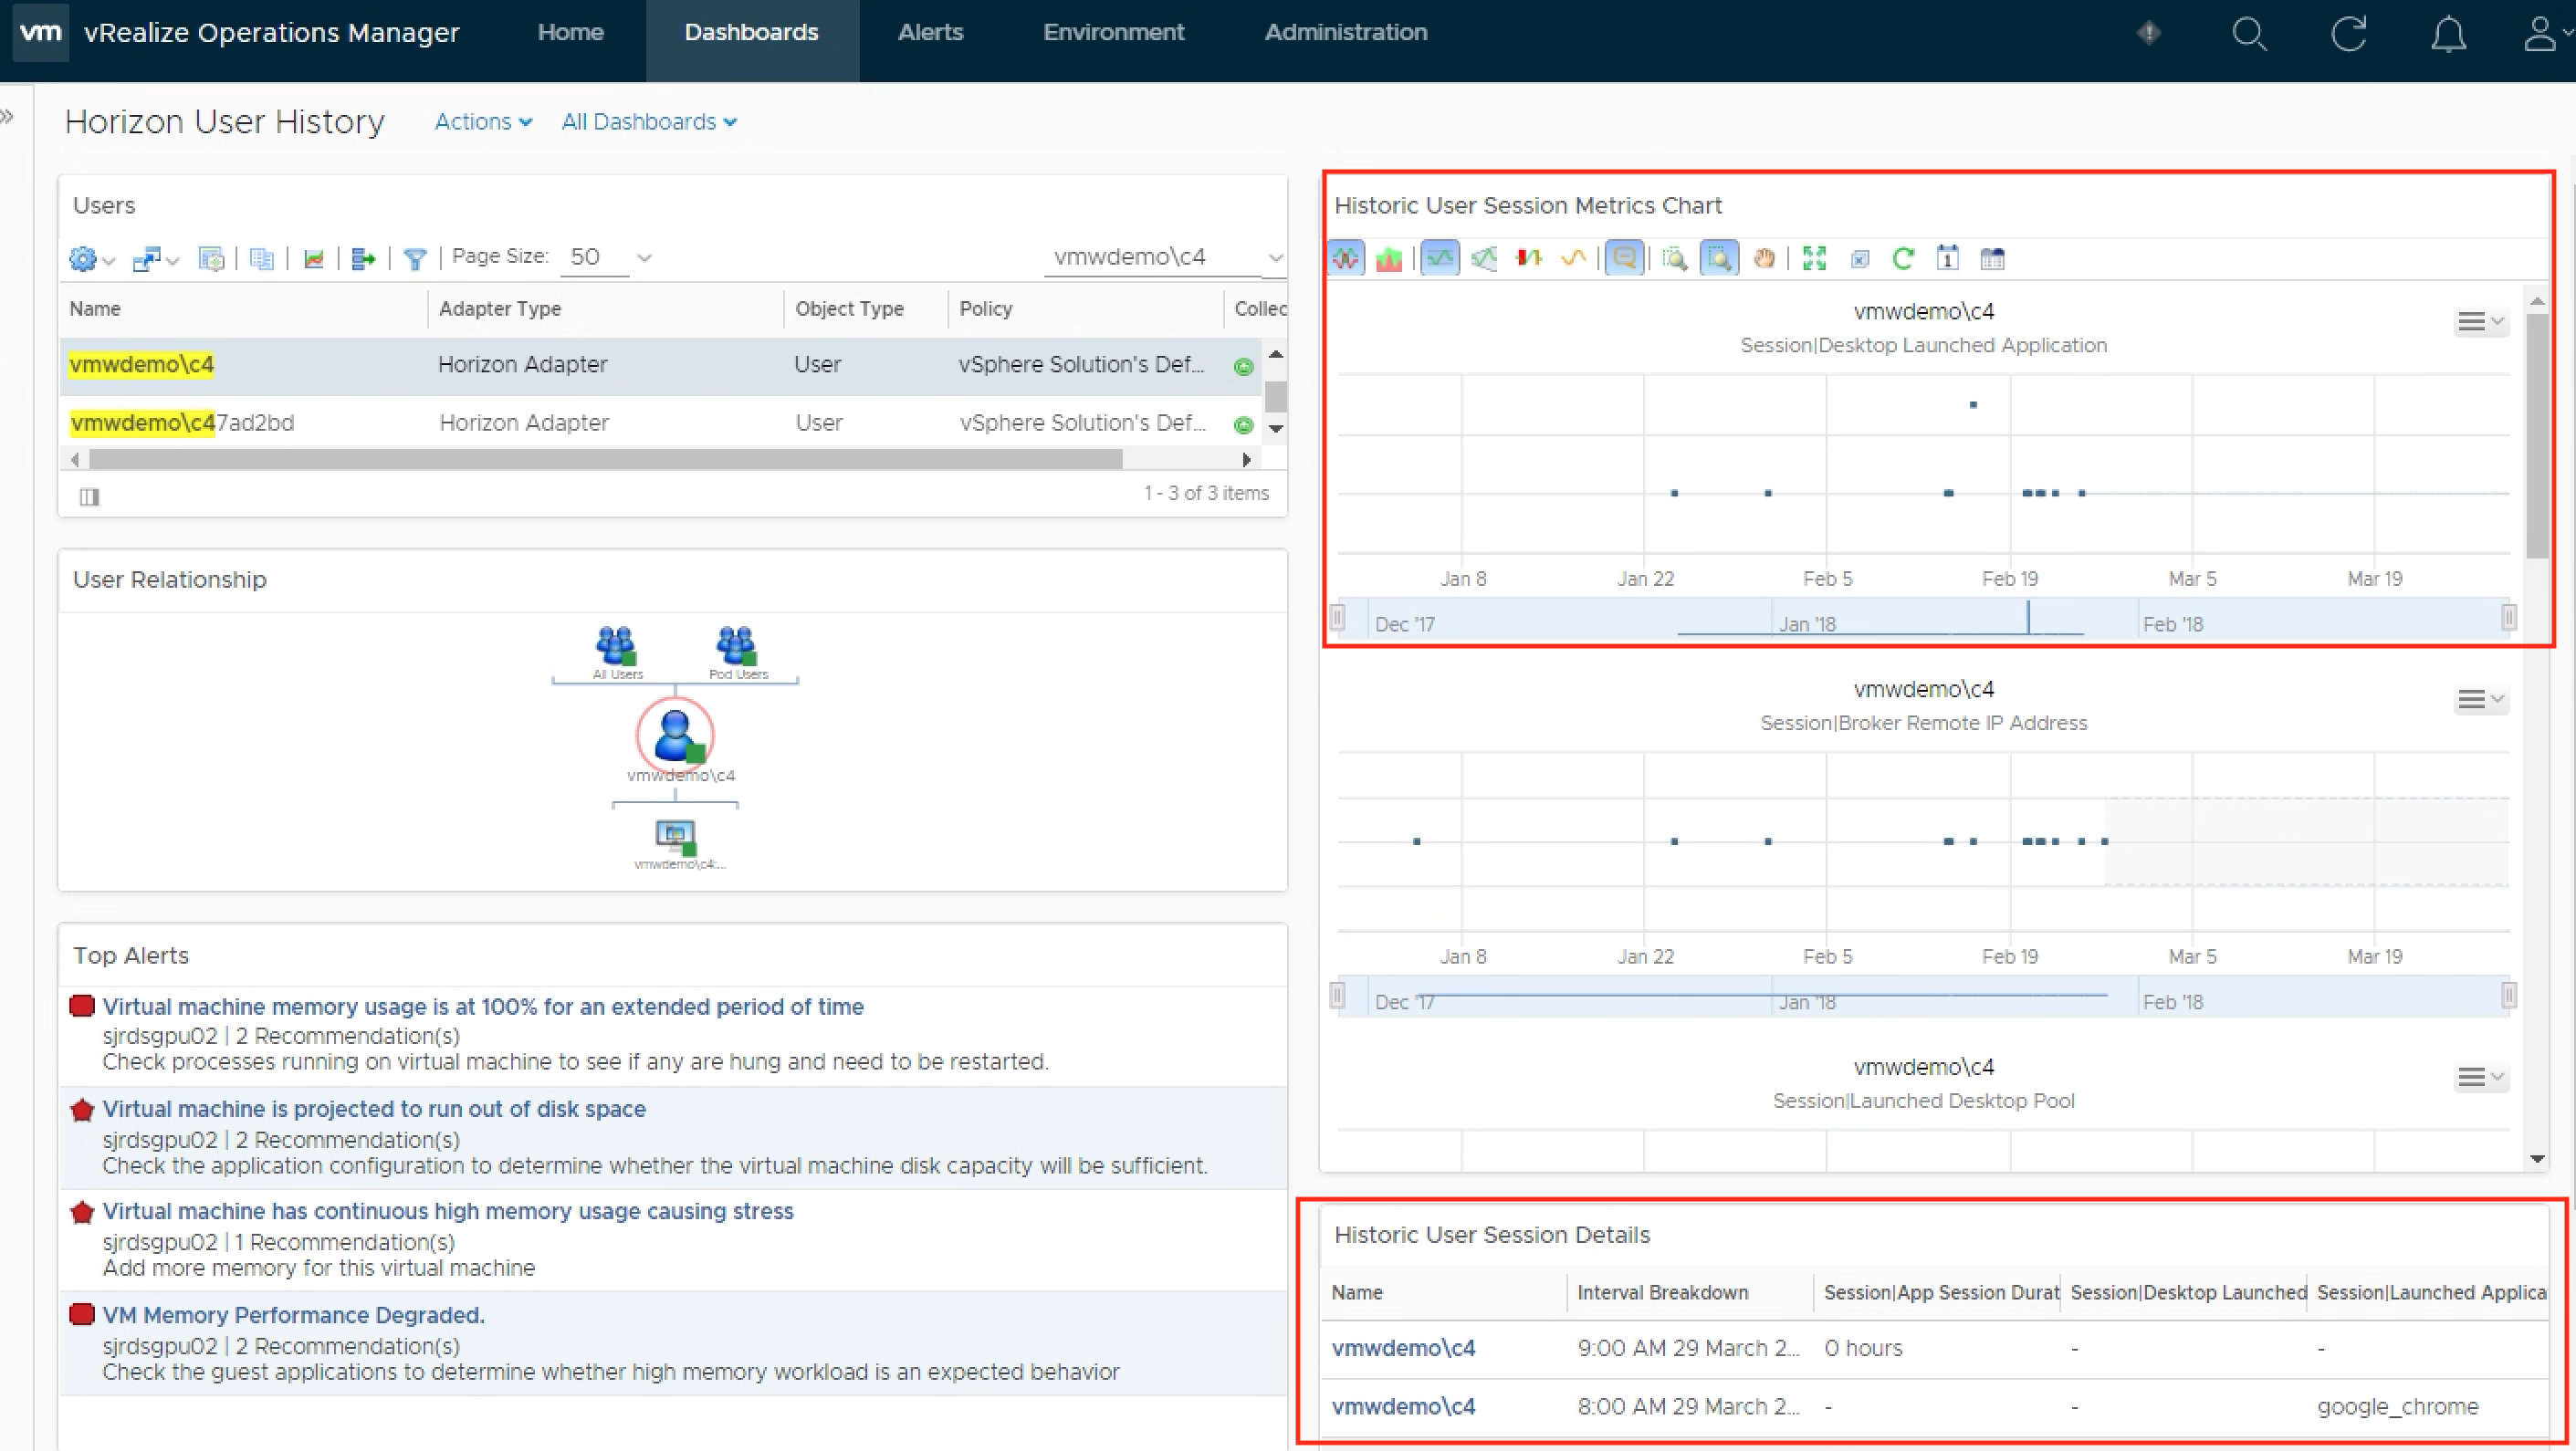
First navigate to the Dashboard from the main menu:

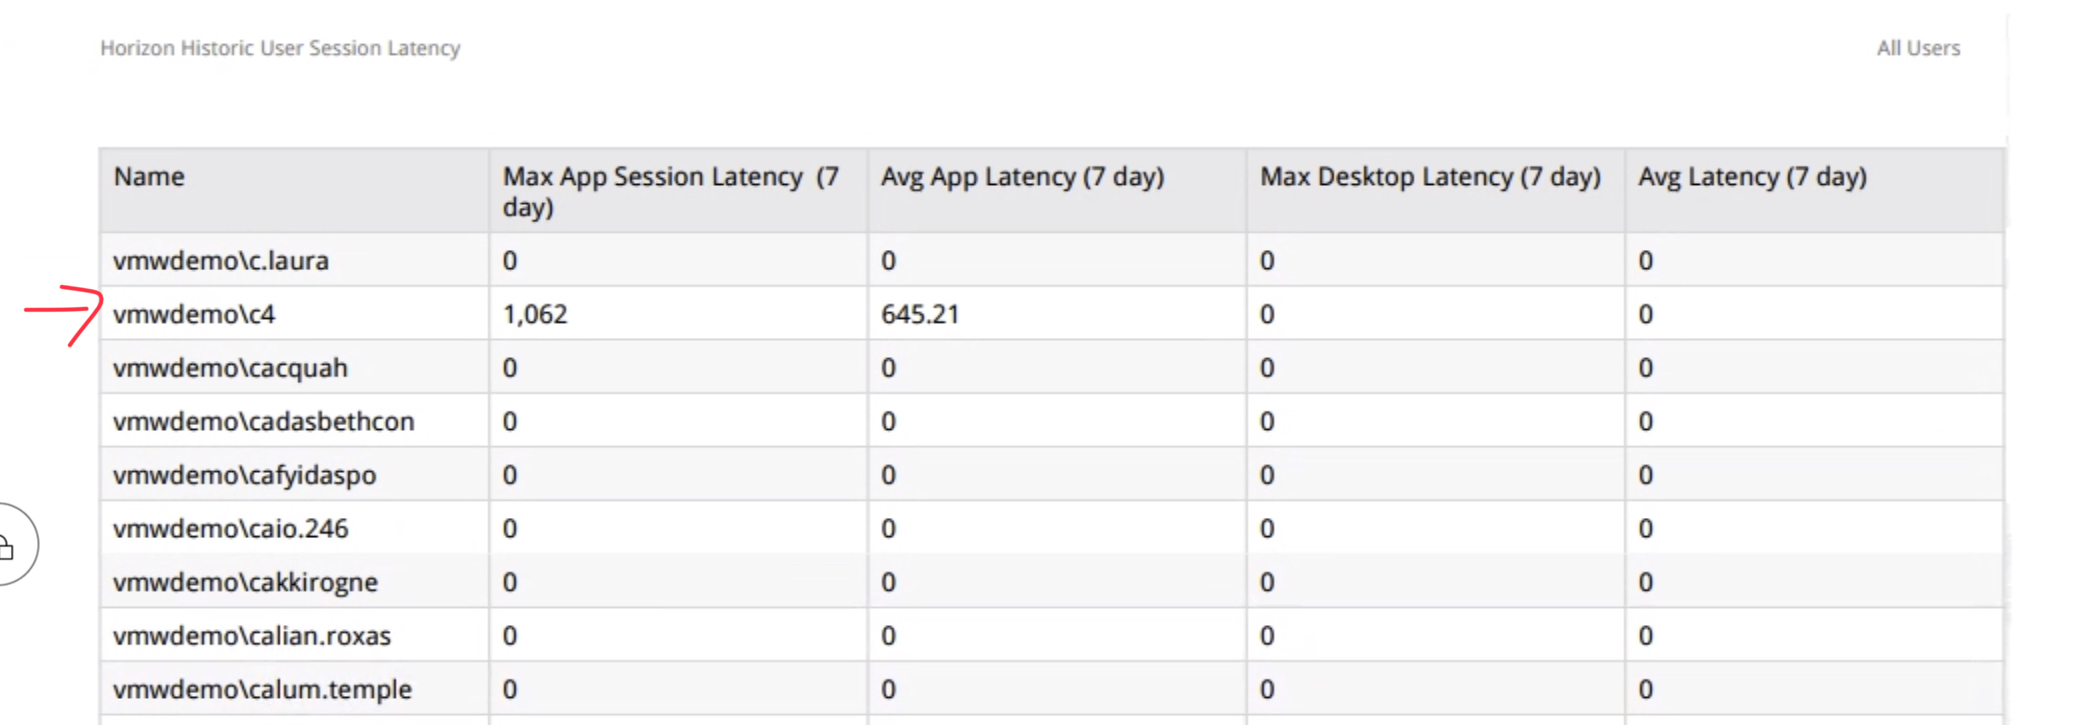
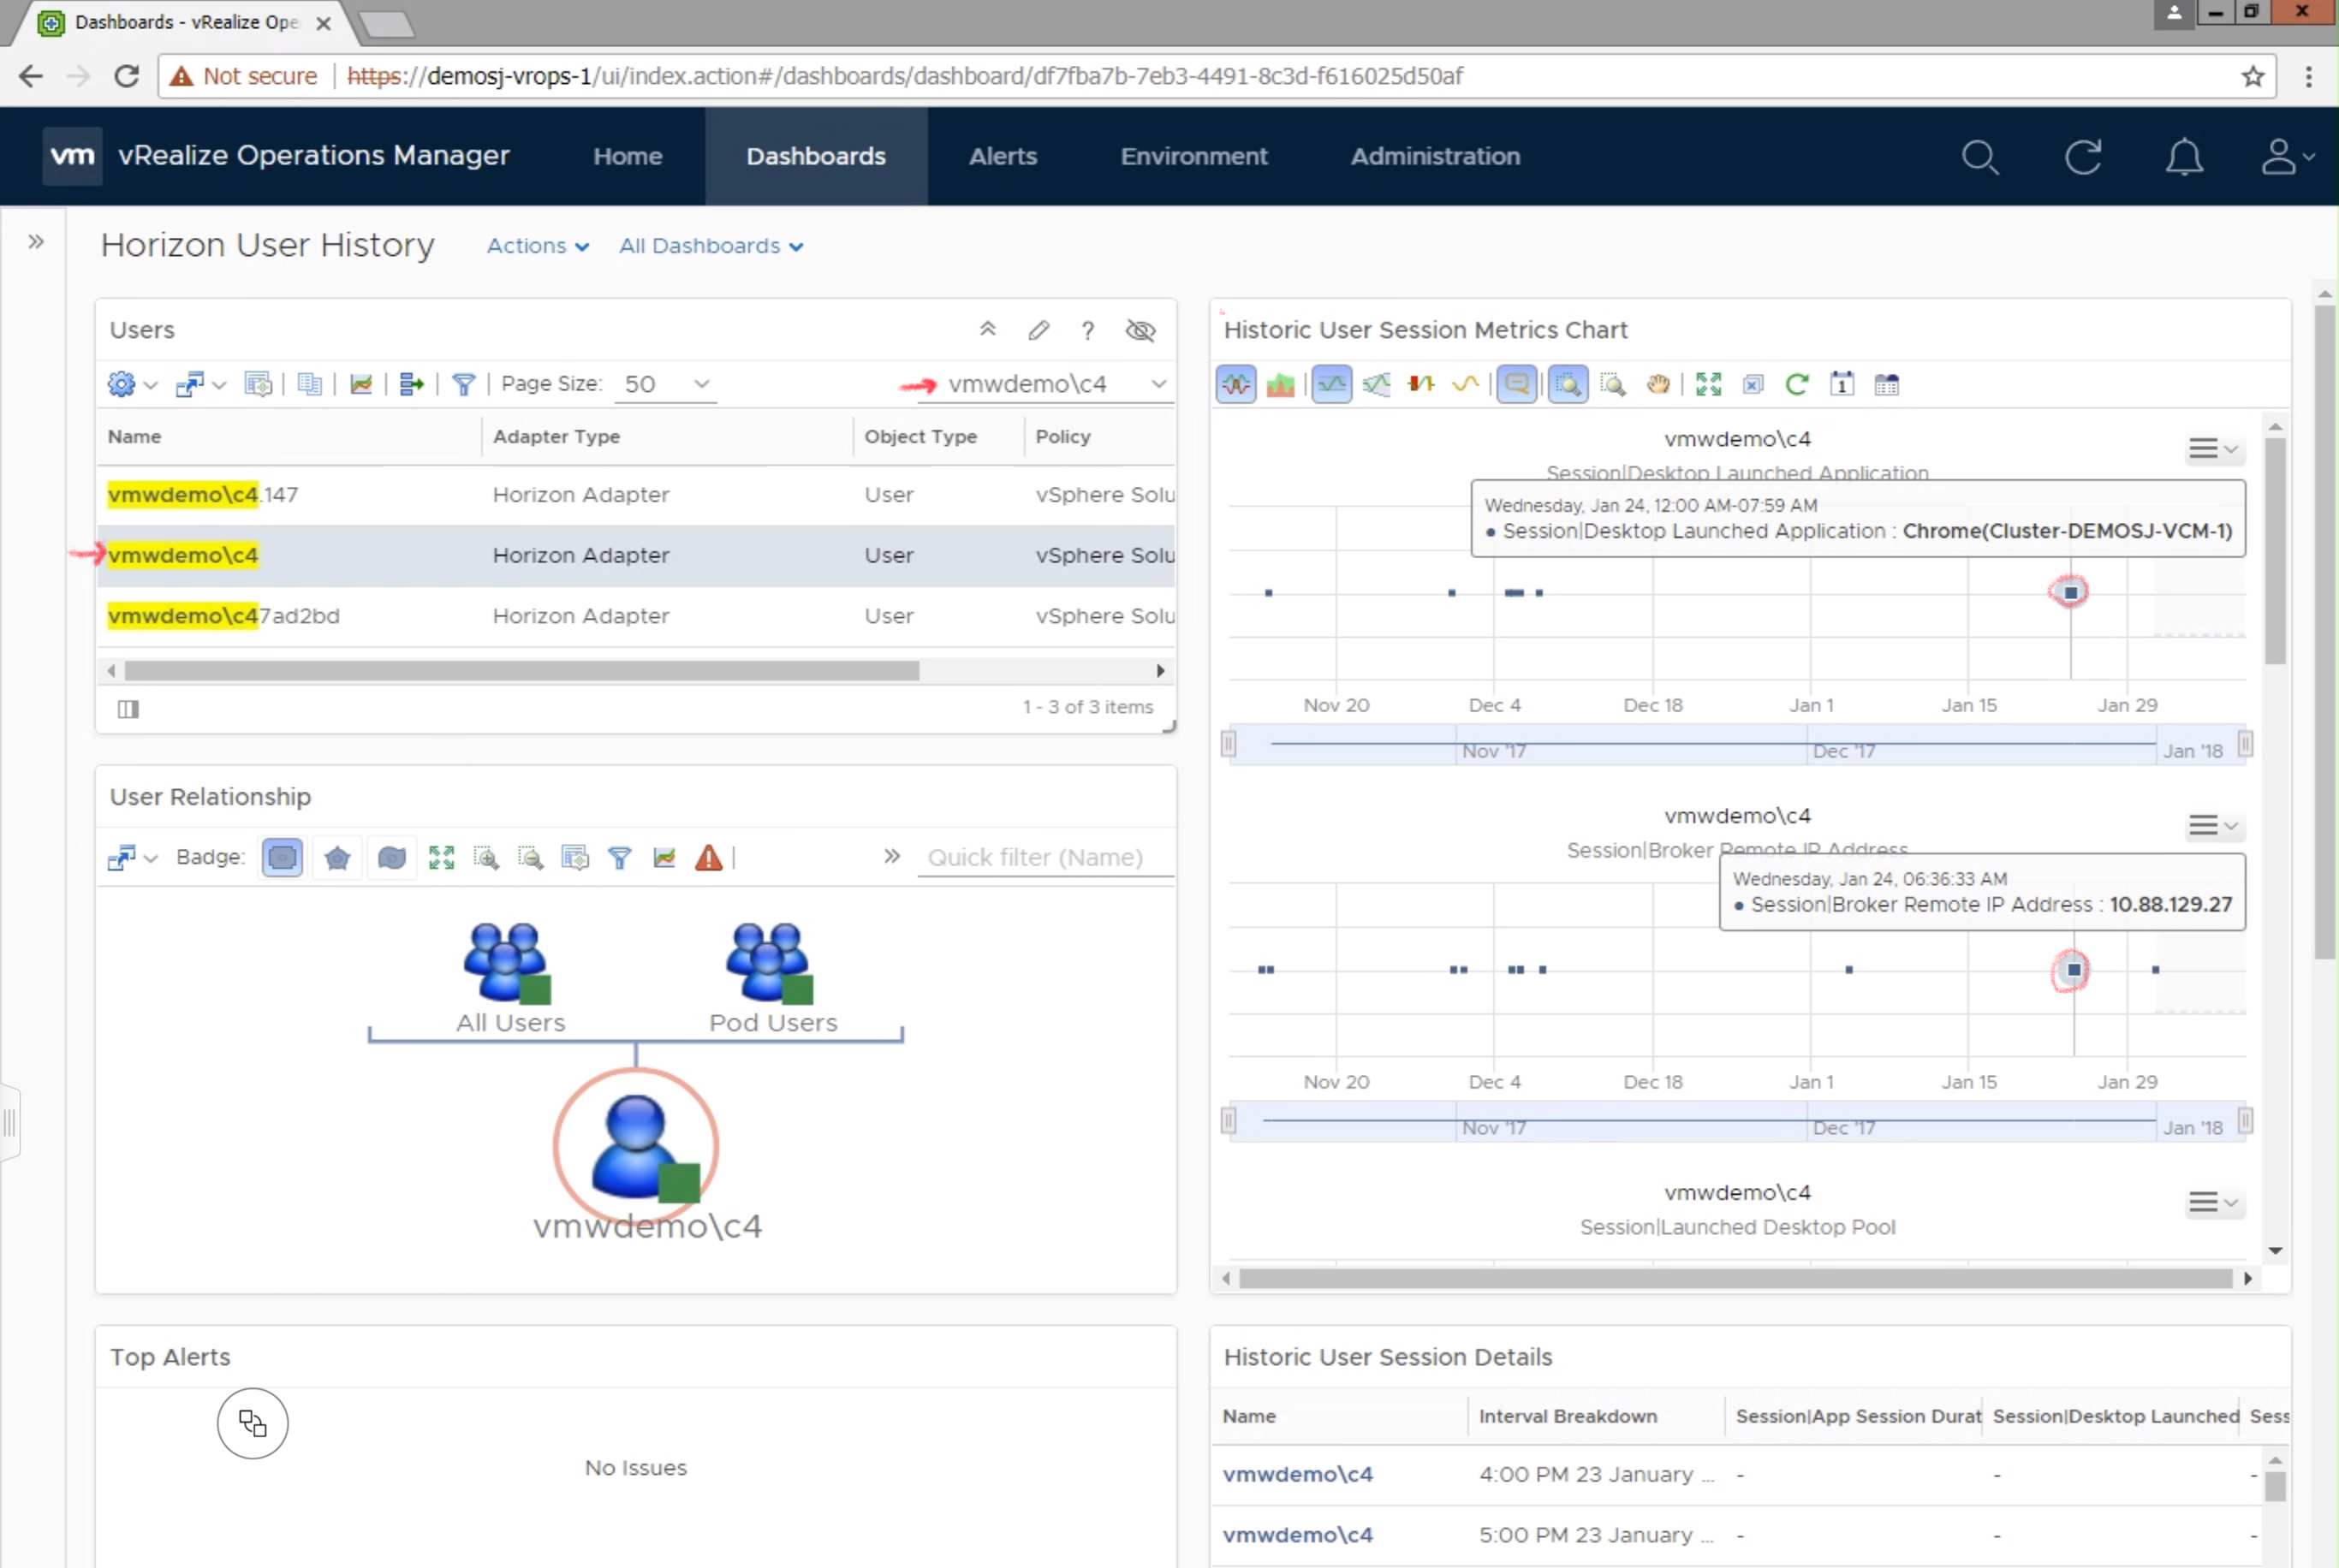
Click in the user search box to enter the Active Directory user name, and click Enter to lookup the individual user. Click the user’s name from the list, and the Dashboard will update to display the user’s historic metrics.

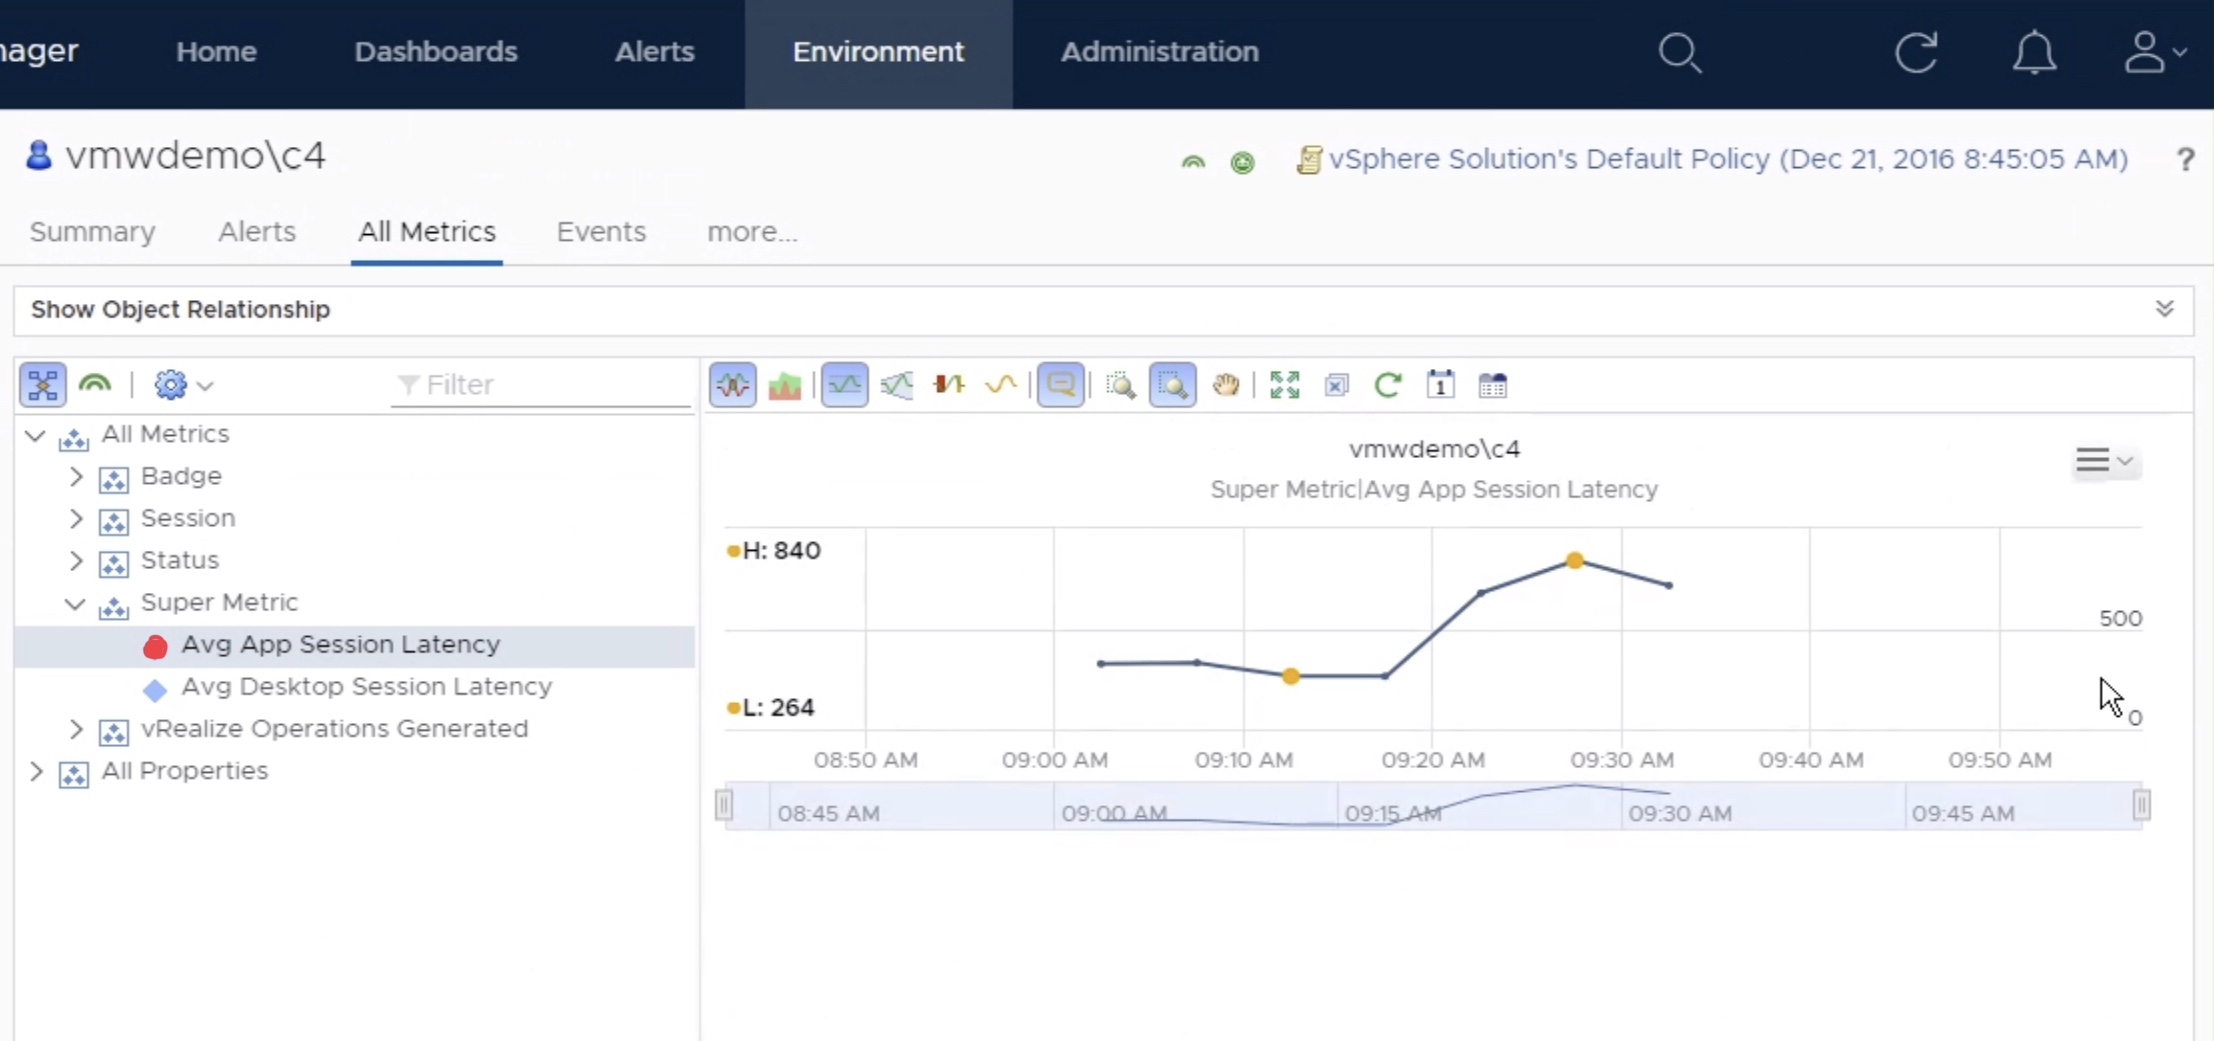
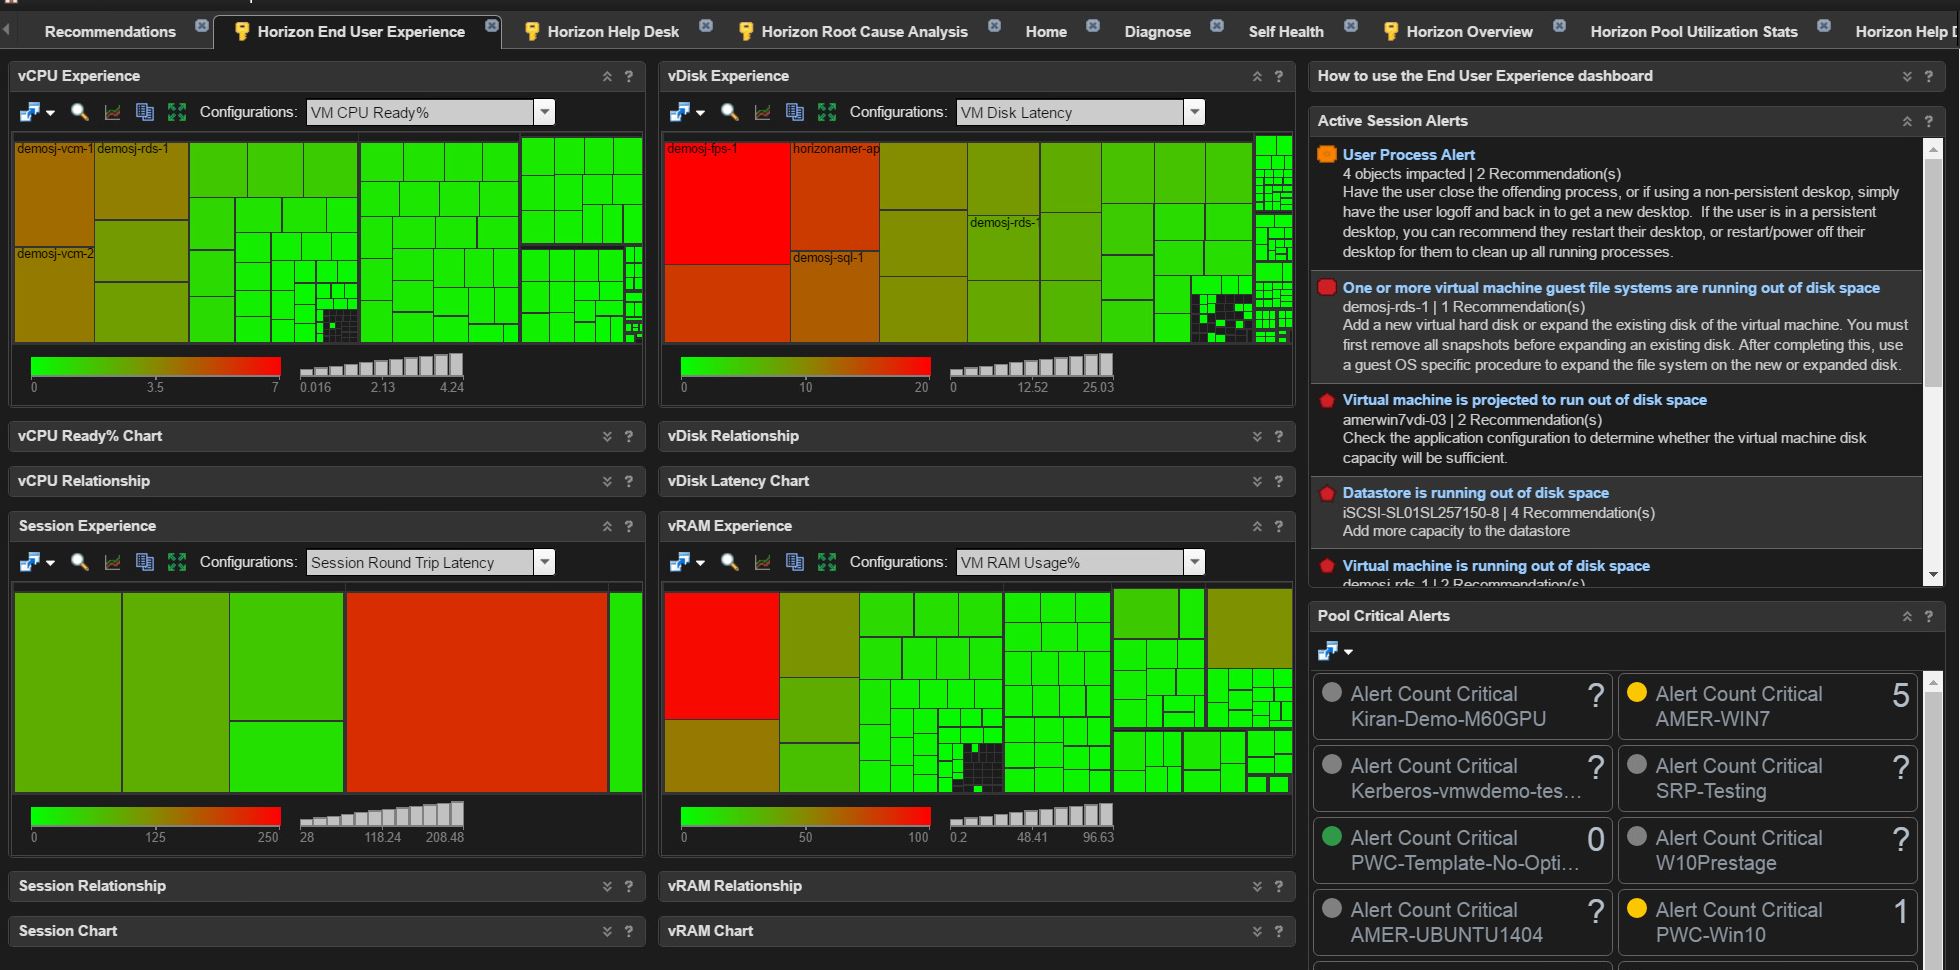
Scroll to search through the available metrics on the user’s session. By mousing over a data point in the provided charts, you will see the detailed information captured.

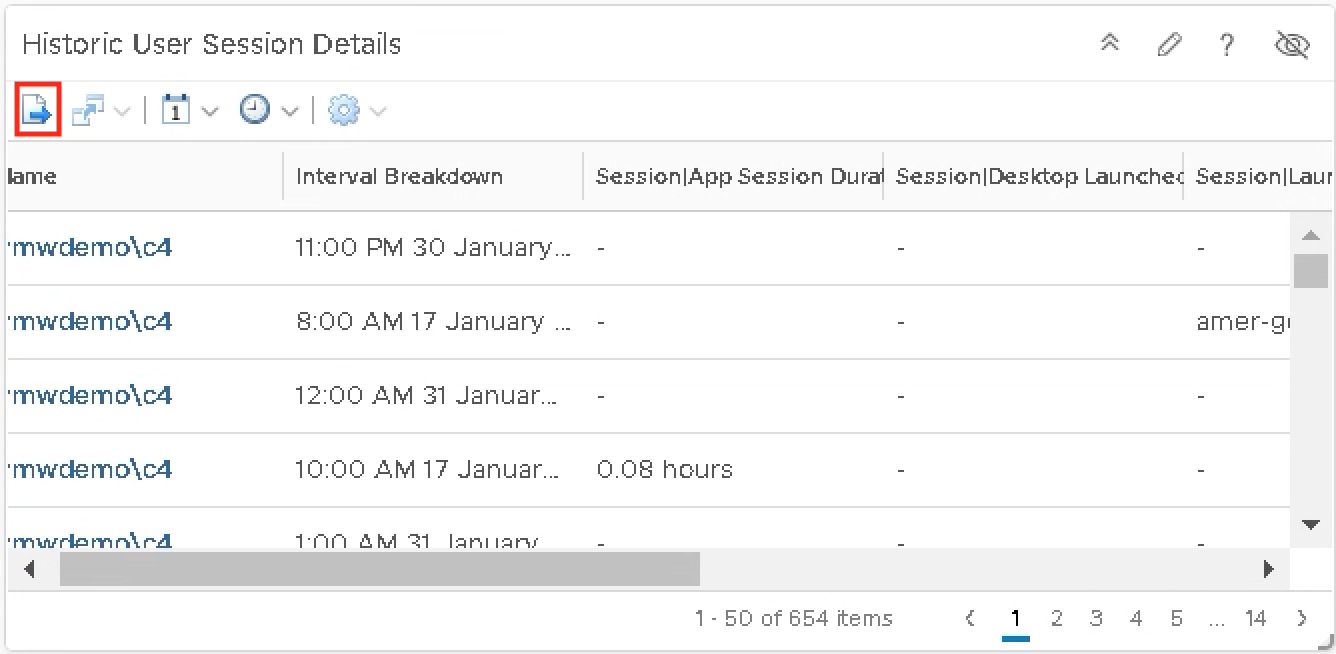
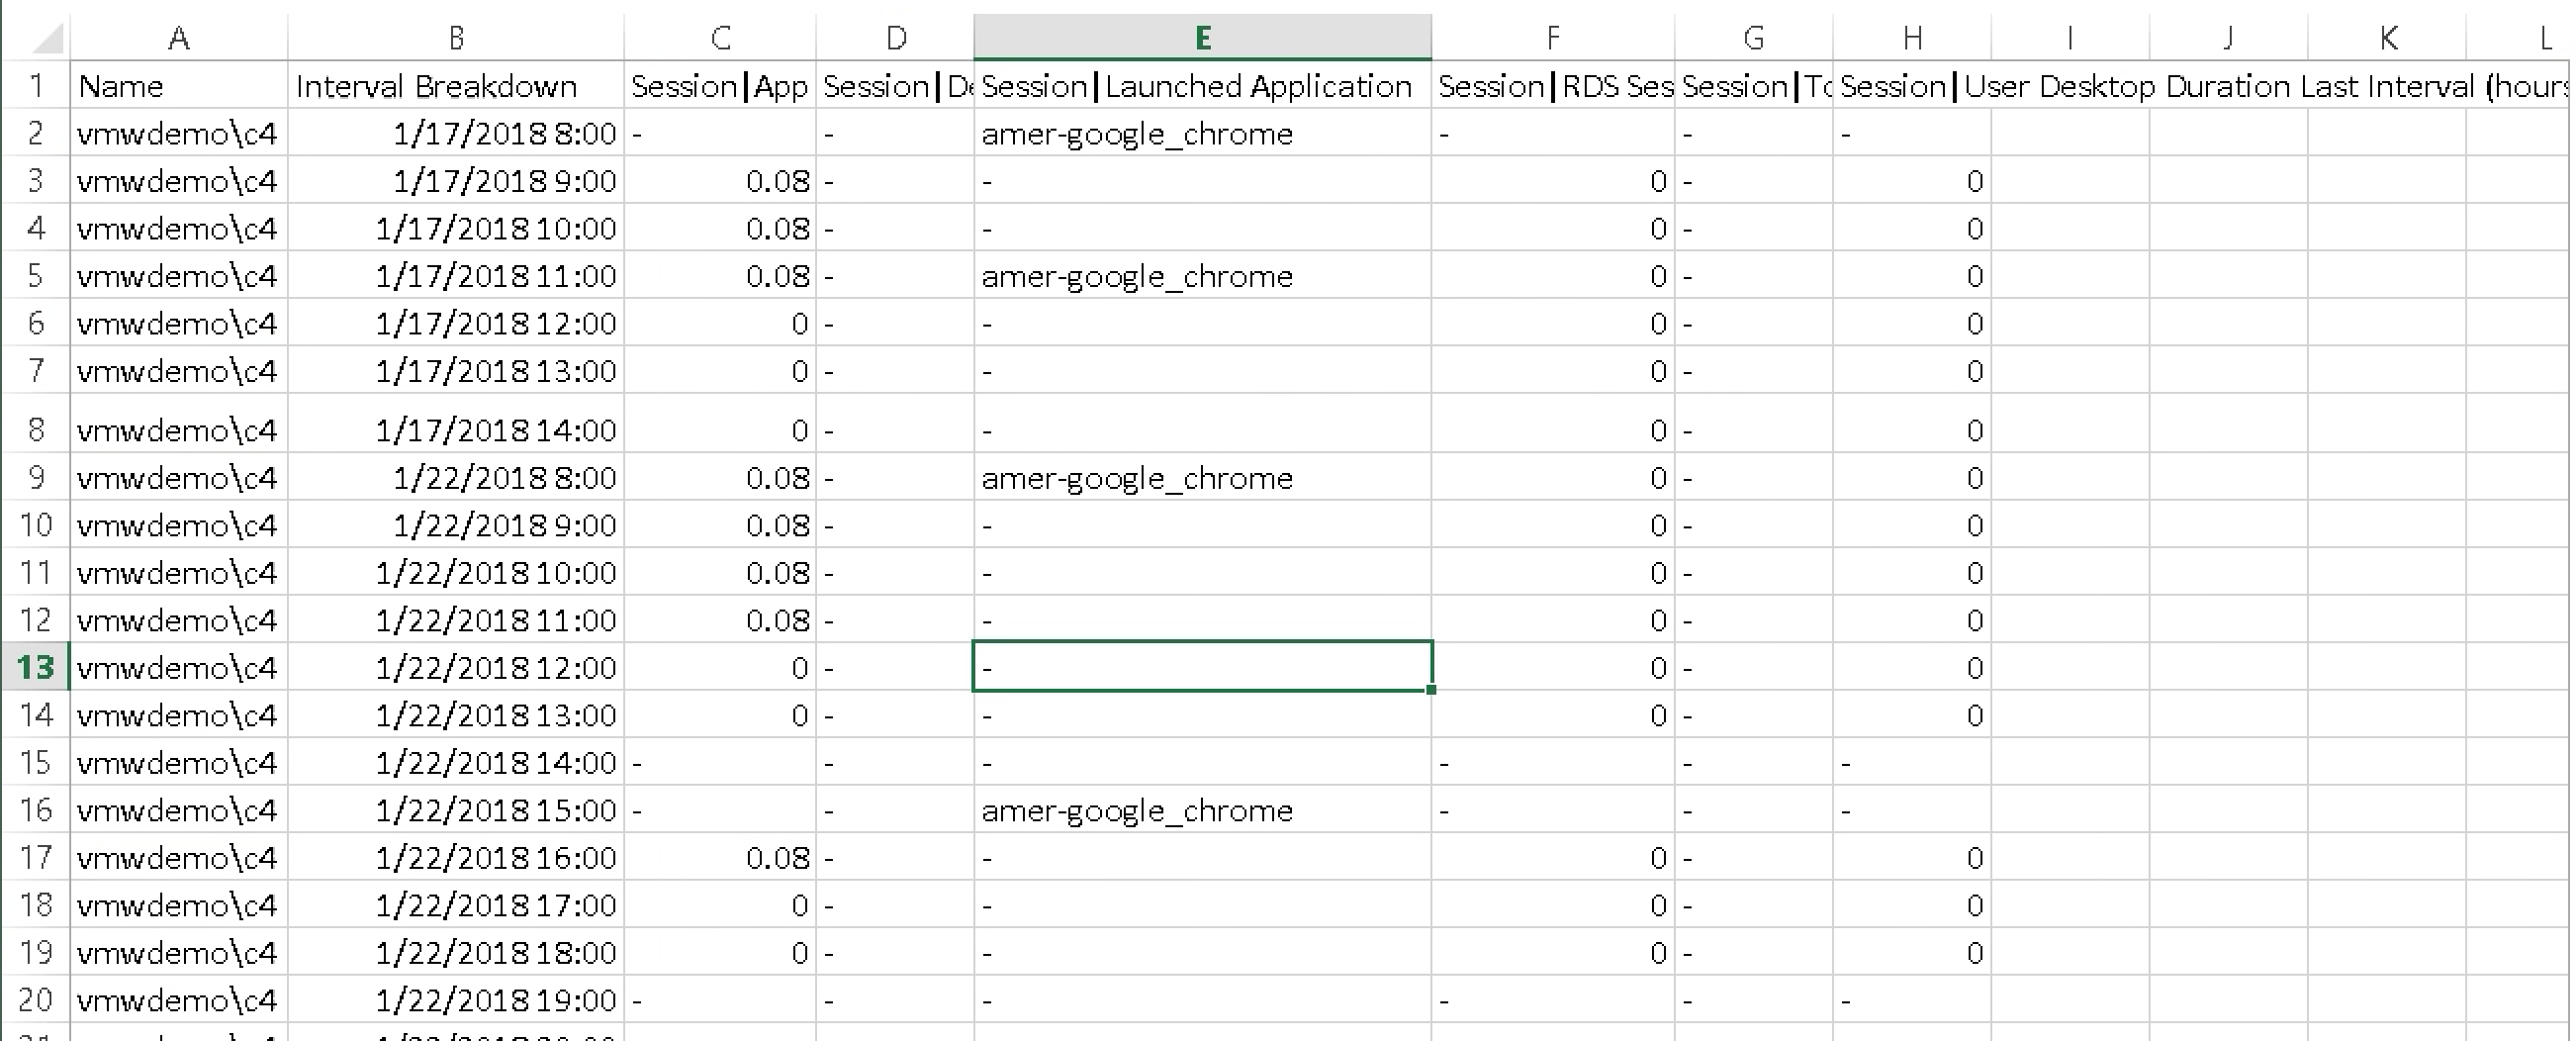
The Historic User Session Details widget provides a summary timeline table view of the data that can be exported into a CSV file:

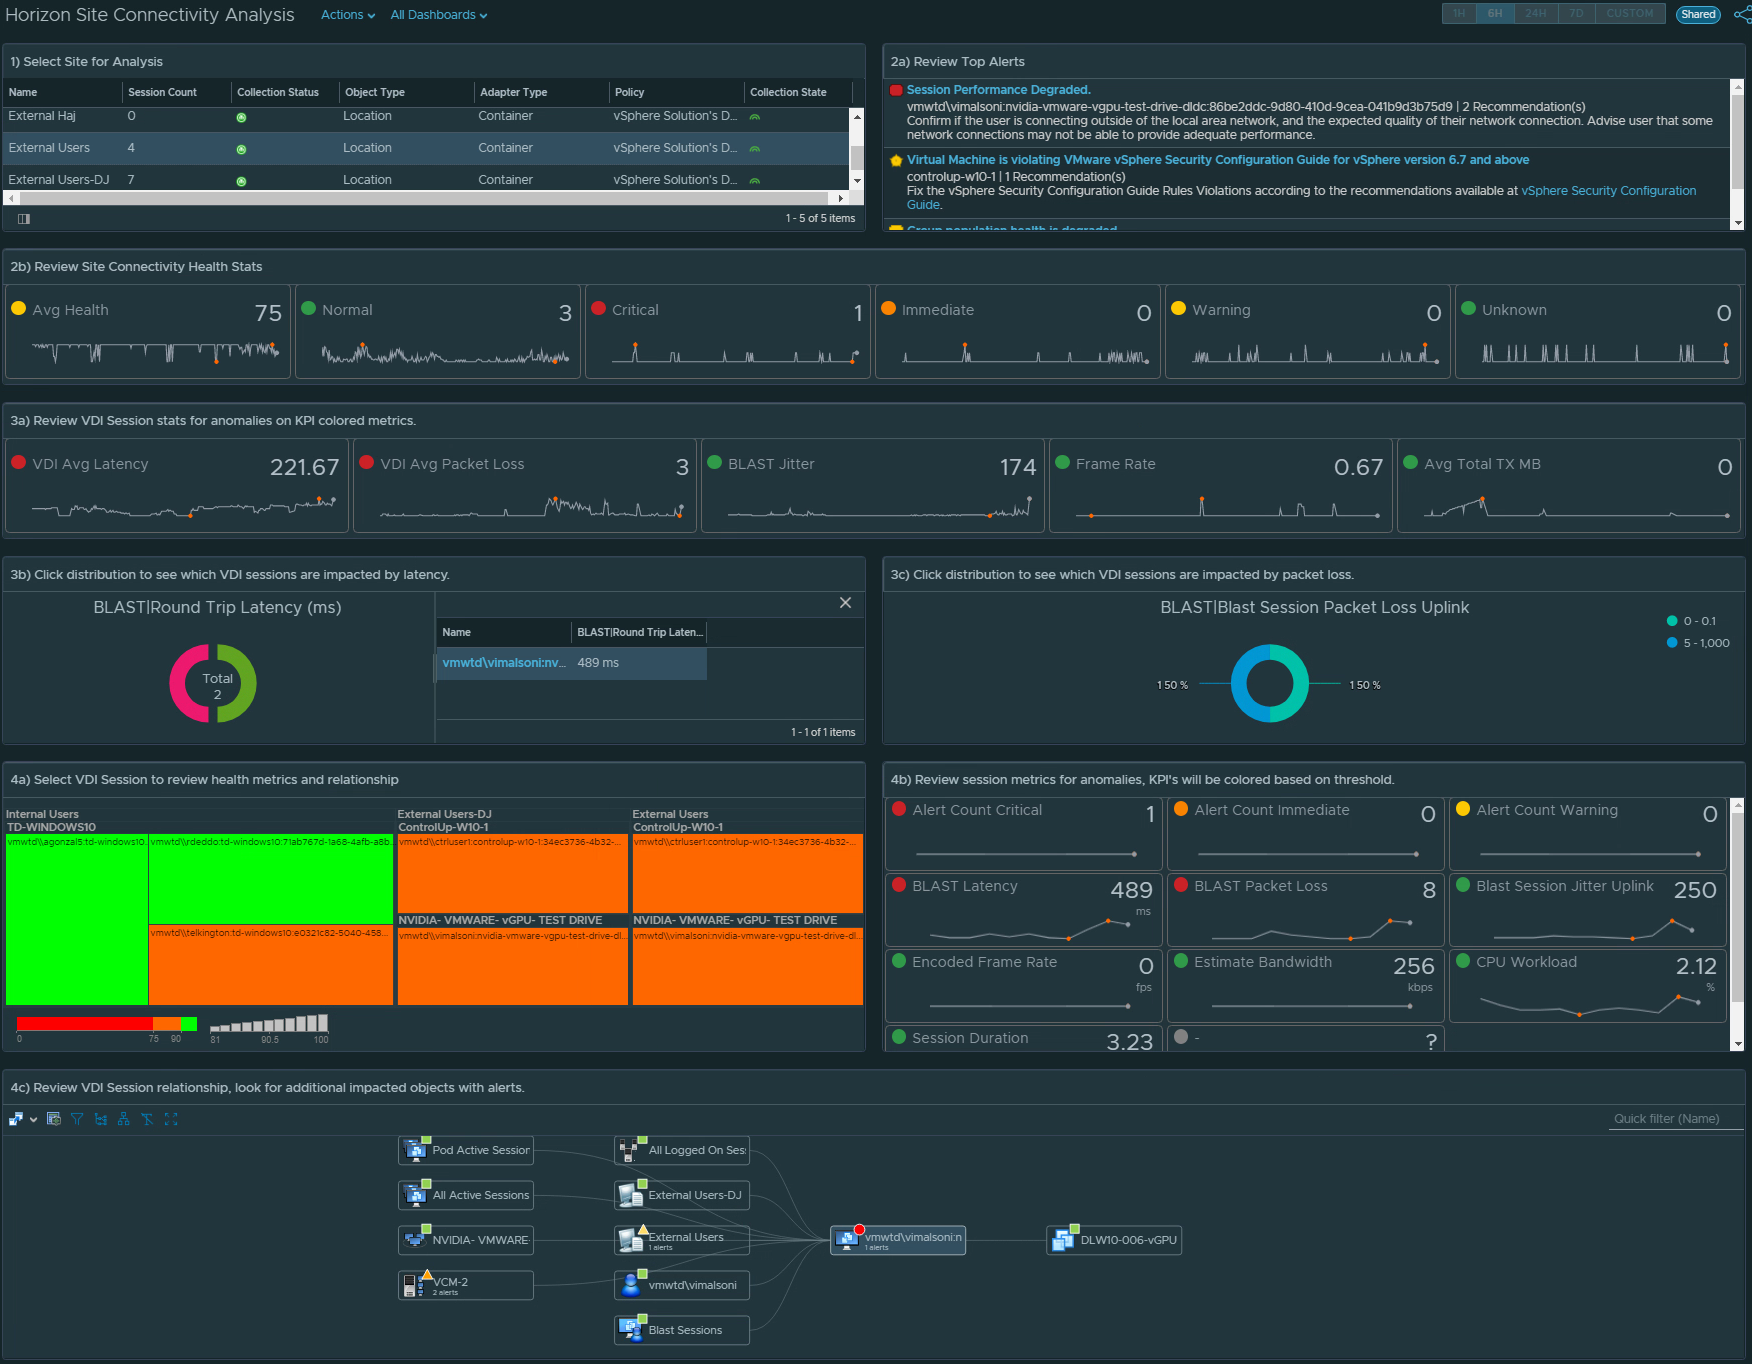
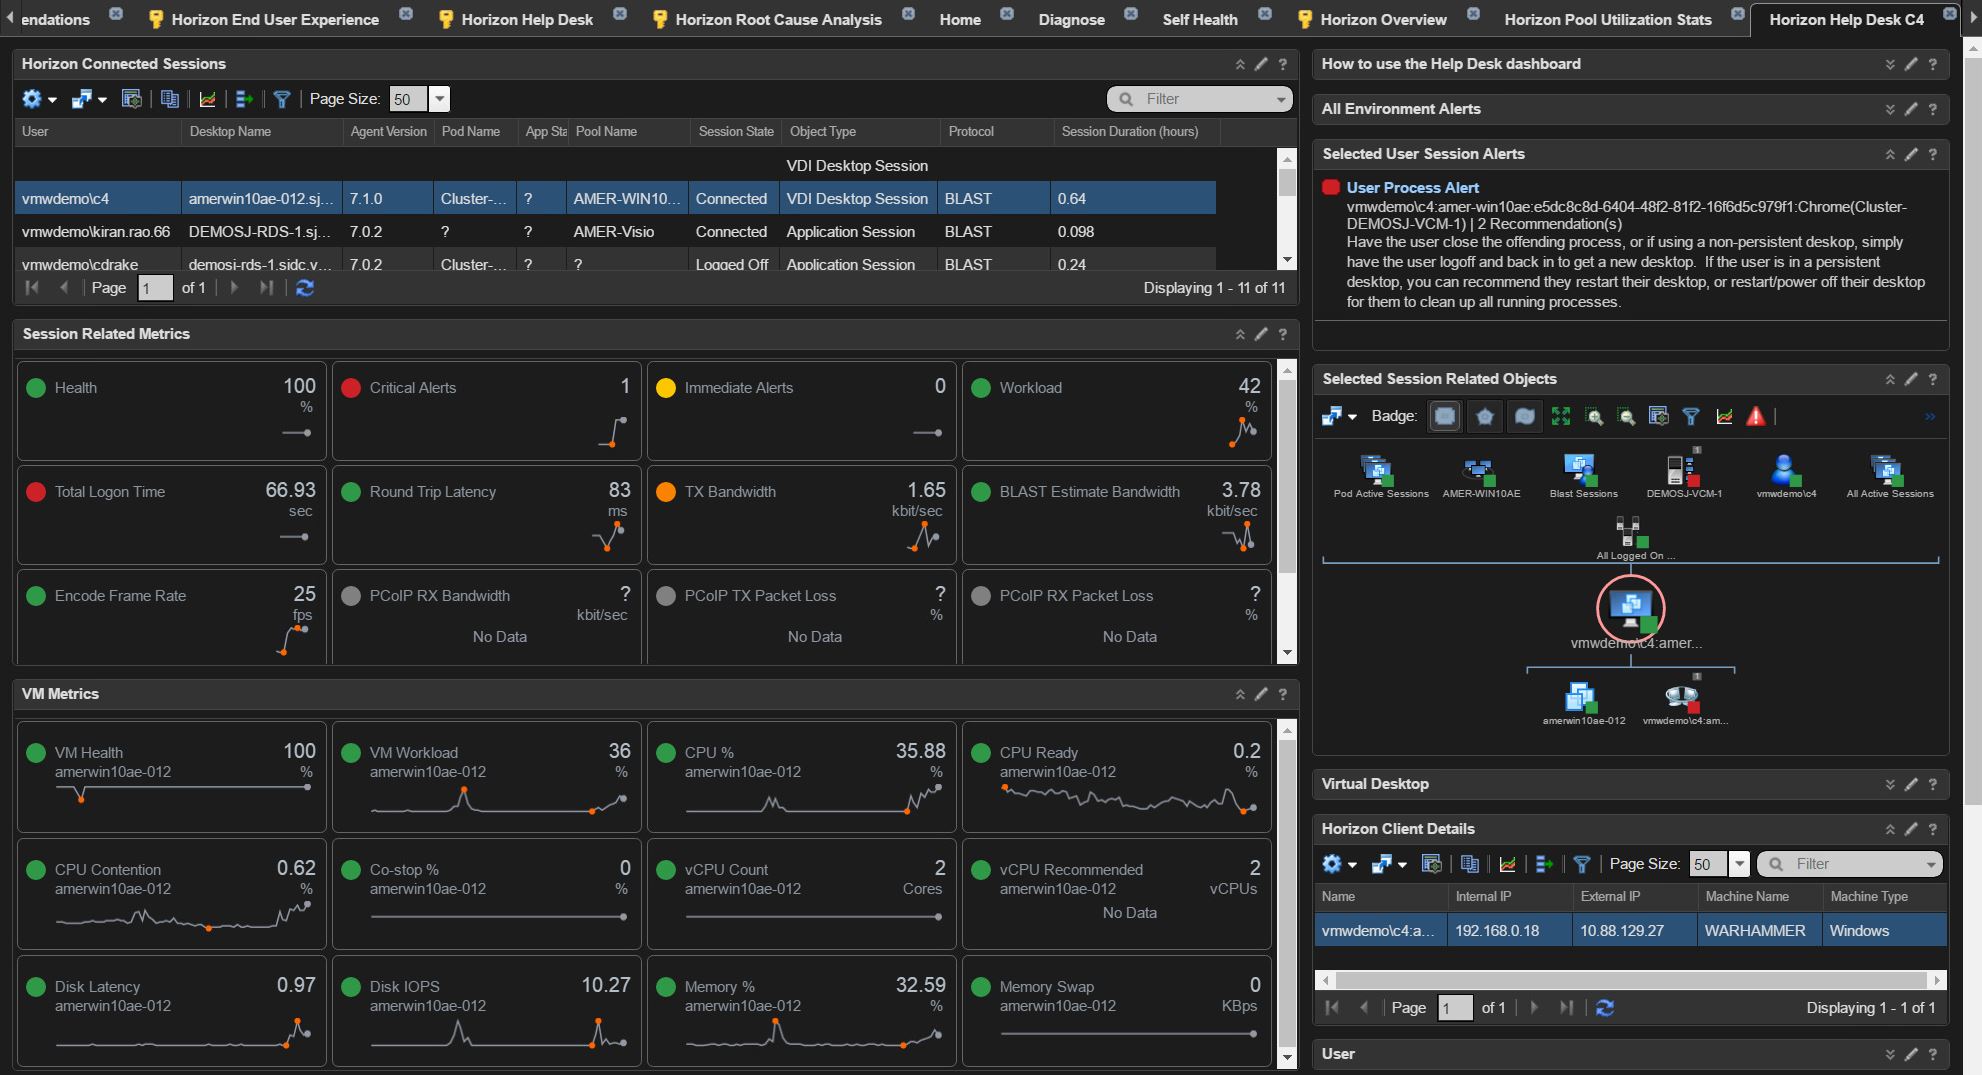
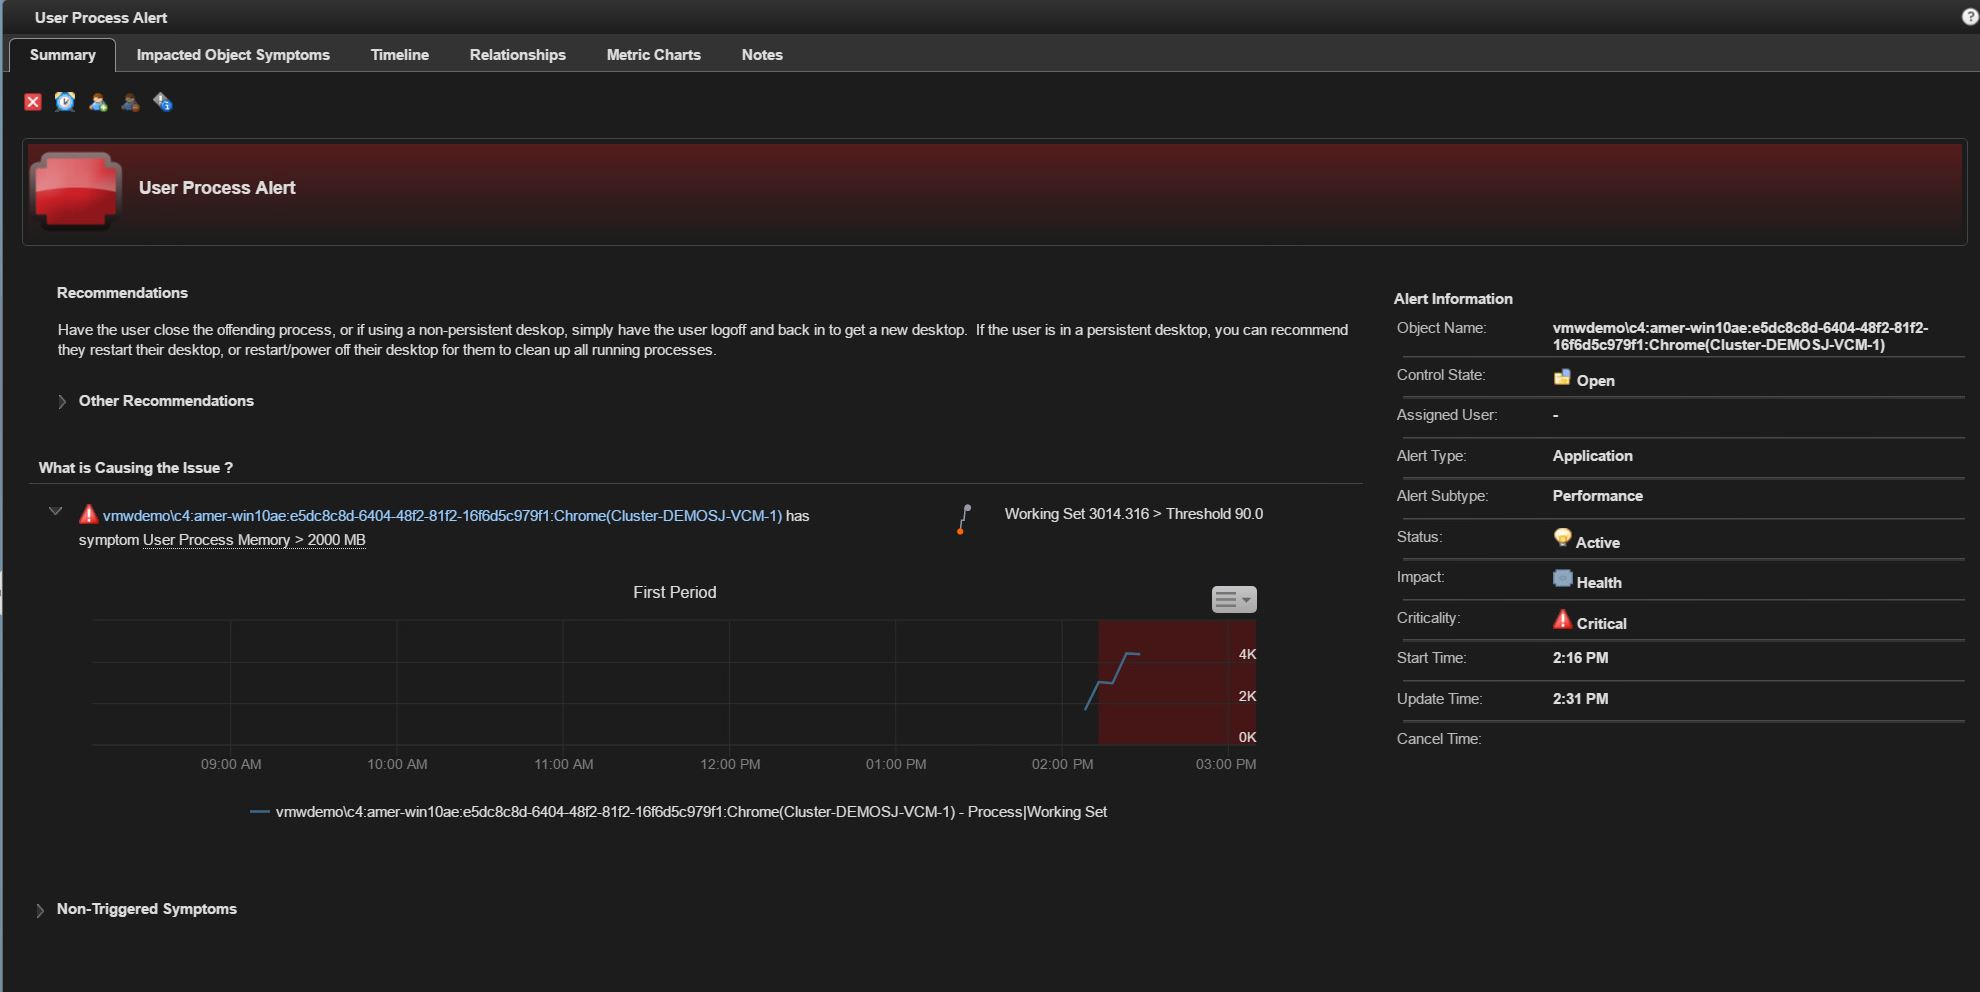
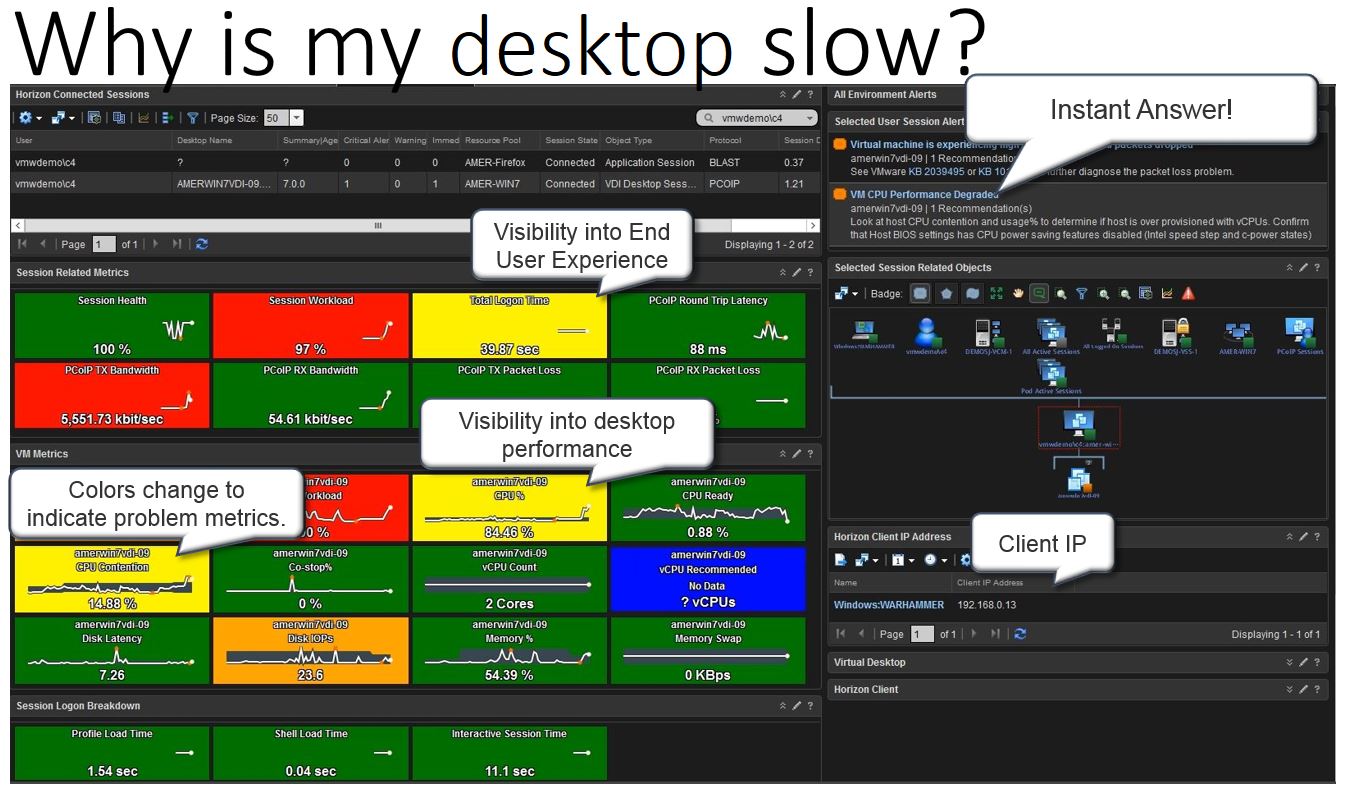
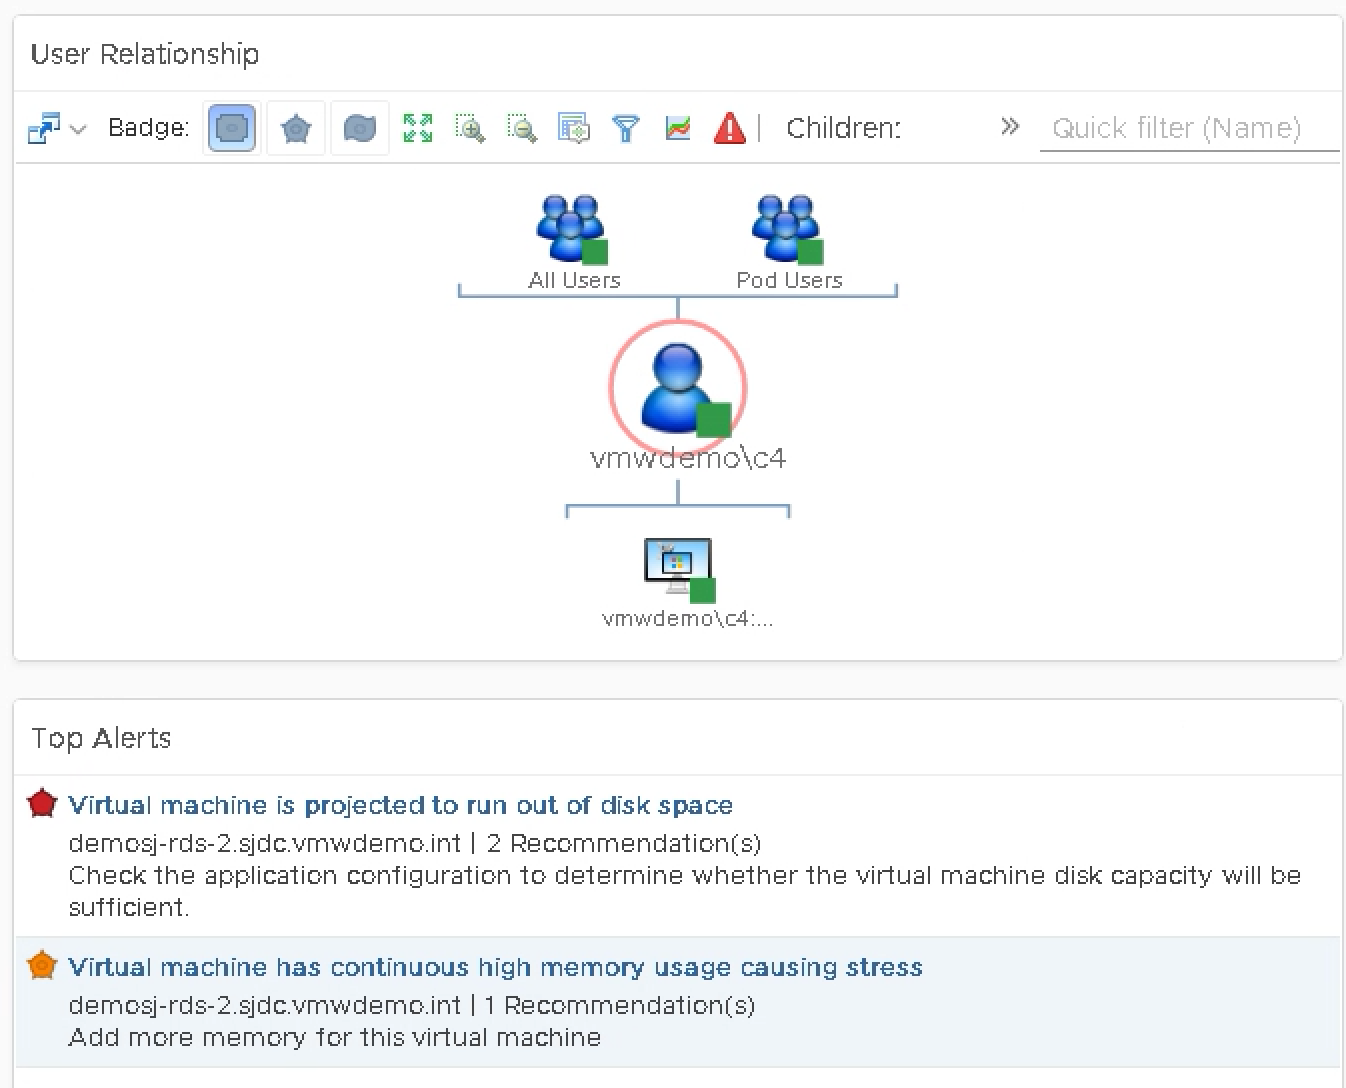
The Related Objects widget shows the health of the current/Active session of the user.  The Alerts Widget shows any active alerts for the user as well.

This content is provided “as is”; however, please feel free to provide feedback on the content and how it could be improved for future updates.

vROPs for Horizon – User Application Threshold Alerts

In the latest vROPs for Horizon 6.4, the ability to track user launched desktop applications was added.  (See 6.4 release notes)  This new addition gives customers the capability of providing reports of which users have launched specific windows applications over time.

A lesser known capability, is that this new feature also gives customers the ability to alert on these same processes when they have reached a certain CPU and Memory threshold.  To take advantage of this feature, the vROPs administrator needs to perform the following steps:

  1. Add the specific processes  that  you want to monitor to your vROPs for Horizon configuration. (Process Outline Click Here).


  2. Create a new alert, and the define the appropriate CPU and Memory symptom thresholds that you want to track.

A sample alert can be downloaded using the following link:  User Process Alert.xml

To import my sample Alert and customize it for your environment, follow these steps:

  1. Navigate to Content-> Alert Definitions, and click Import.

  2. Click Browse and select the User Process Alert.xml file previously downloaded, and click Open to import.

  3. Confirm that the Alert Definition was imported successfully.  If the alert was skipped for some reason, you can re-attempt the process and select the “Overwrite existing Alert Definition” option before clicking Browse and opening the file.

  4. Click Done to finish the import process.

Congratulations!  You now have visibility into in-guest processes, and how they are impacting the users of your Horizon View environment.


Getting More out of VMware vRealize Operations for Horizon – training video

Getting More out of VMware vRealize Operations for Horizon training video:

In this training video you will learn how to quickly operationalize the vROPs for Horizon solution, and how it provides end-to-end visibility into issues plaguing your Horizon View users.  Learn how to use the latest Help Desk dashboard to get instant insight into “Why their desktop is slow”.

V4H Custom Content 8.2 now available for download!

The latest V4H Custom Content 8.2 is now available for download at http://cameronfore.com/v4hcustom.

This includes an updated End User Experience Dashboard, a new Horizon Help Desk dashboard, and a new Root Cause Analysis dashboard.  Other dashboards include Horizon Pool Utilization Stats and Horizon Capacity Analysis.

Horizon Help Desk:

HelpDesk_captioned

Horizon Root Cause Analysis:

Root Cause Analysis_captioned

End User Experience v2:

eucexperiencev2_captioned

Horizon Pool Utilization:

PoolUtilizationstats_captioned

Horizon Capacity Analysis:

CapacityAnalysis_captioned

How to import:

To successfully import the content, a new Metric Config must be created under ReskndMetric,and named  “Config_Session_Desktop_stats”.

MetricConfig

Three additional Views must also be imported for the dashboards to work correctly.  In some cases a View may need to be associated with specific Horizon View Pod, such as the View_VDI Desktop Pool Usable Statusv2 view, which is used on the Horizon Pool Utilization dashboard.

Views2import