When it comes to managing critical Horizon management servers such as Connection Servers, Unified Access Gateways, AV Managers, etc… It is imperative that you properly monitor their services for availability and that none of them are in a failed state, as well as make sure there are no connectivity issues on internal networks that the Horizon Client traffic traverses. By leveraging the Telegraf agent HTTP Health Check and PING Check functionality with Aria Operations, we can provide additional insight into the Health, performance, and availability of these services.
This video is meant to provide high-level overview of:
Why you should leverage Telegraf with the Management Pack for Horizon
How to install and configure the Telegraf agents.
How to validate your settings after deployment.
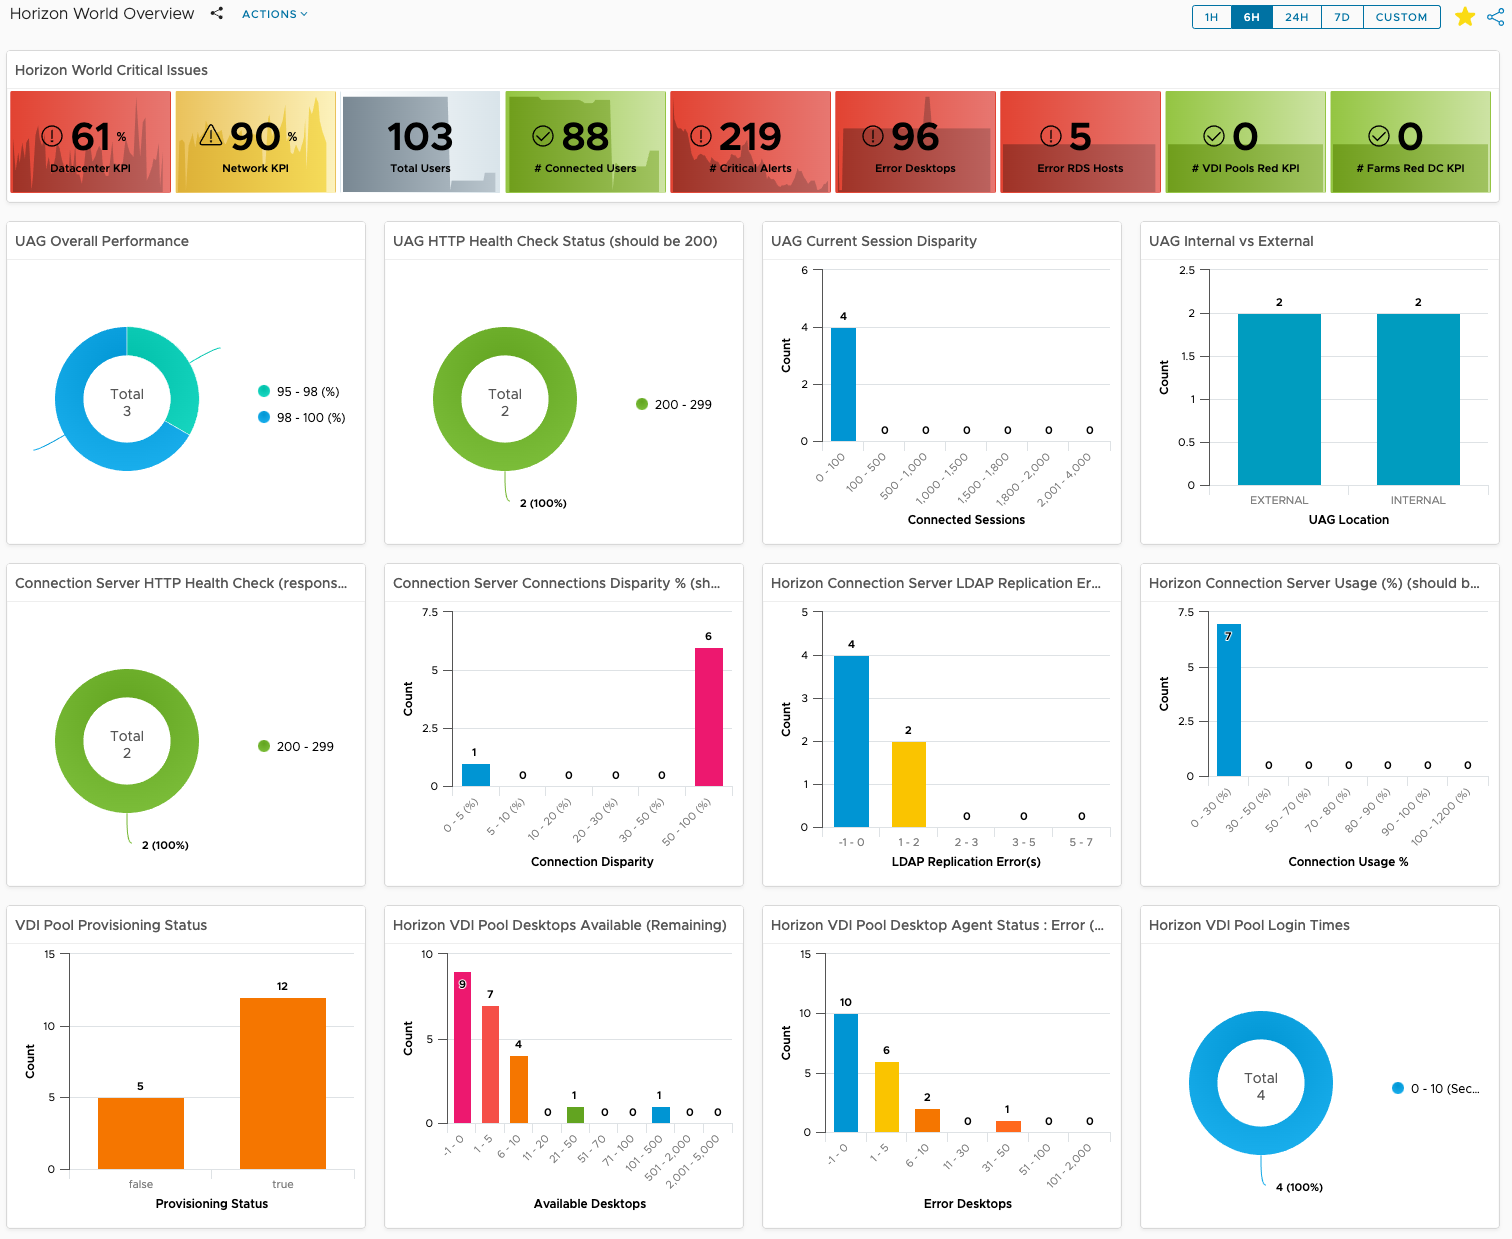
Review of the dashboards that leverage Telegraf metrics.
The latest release of the Management Pack for Horizon 2.7 is now available for download on the VMware Marketplace, as well for SaaS hosted customers in the Aria Operations Integration Repository. This post will cover the latest feature enhancements to the Management Pack and how best to leverage them.
Top Feature Enhancements
Added support for Horizon 2309
Updated Horizon Session Data Collection model
New Cost and Pricing Dashboards
Improved Deployment and Scale considerations documentation
As new editions of Horizon are released with updates to the APIs, there is usually a slight lag for supporting the new version until we are able to test and certify compatibility. That is why I highly recommend checking the interop guide to ensure that your specific version of Horizon matches the version(s) of the MP that has been tested and validated.
For Horizon 2309,only MP4H version 2.7 is supported due to the API changes mentioned above. As we move forward and continue our migration from the VLSI APIs to the REST APIs, our hope is that supporting future versions of Horizon will be much simpler and allow for near zero day support.
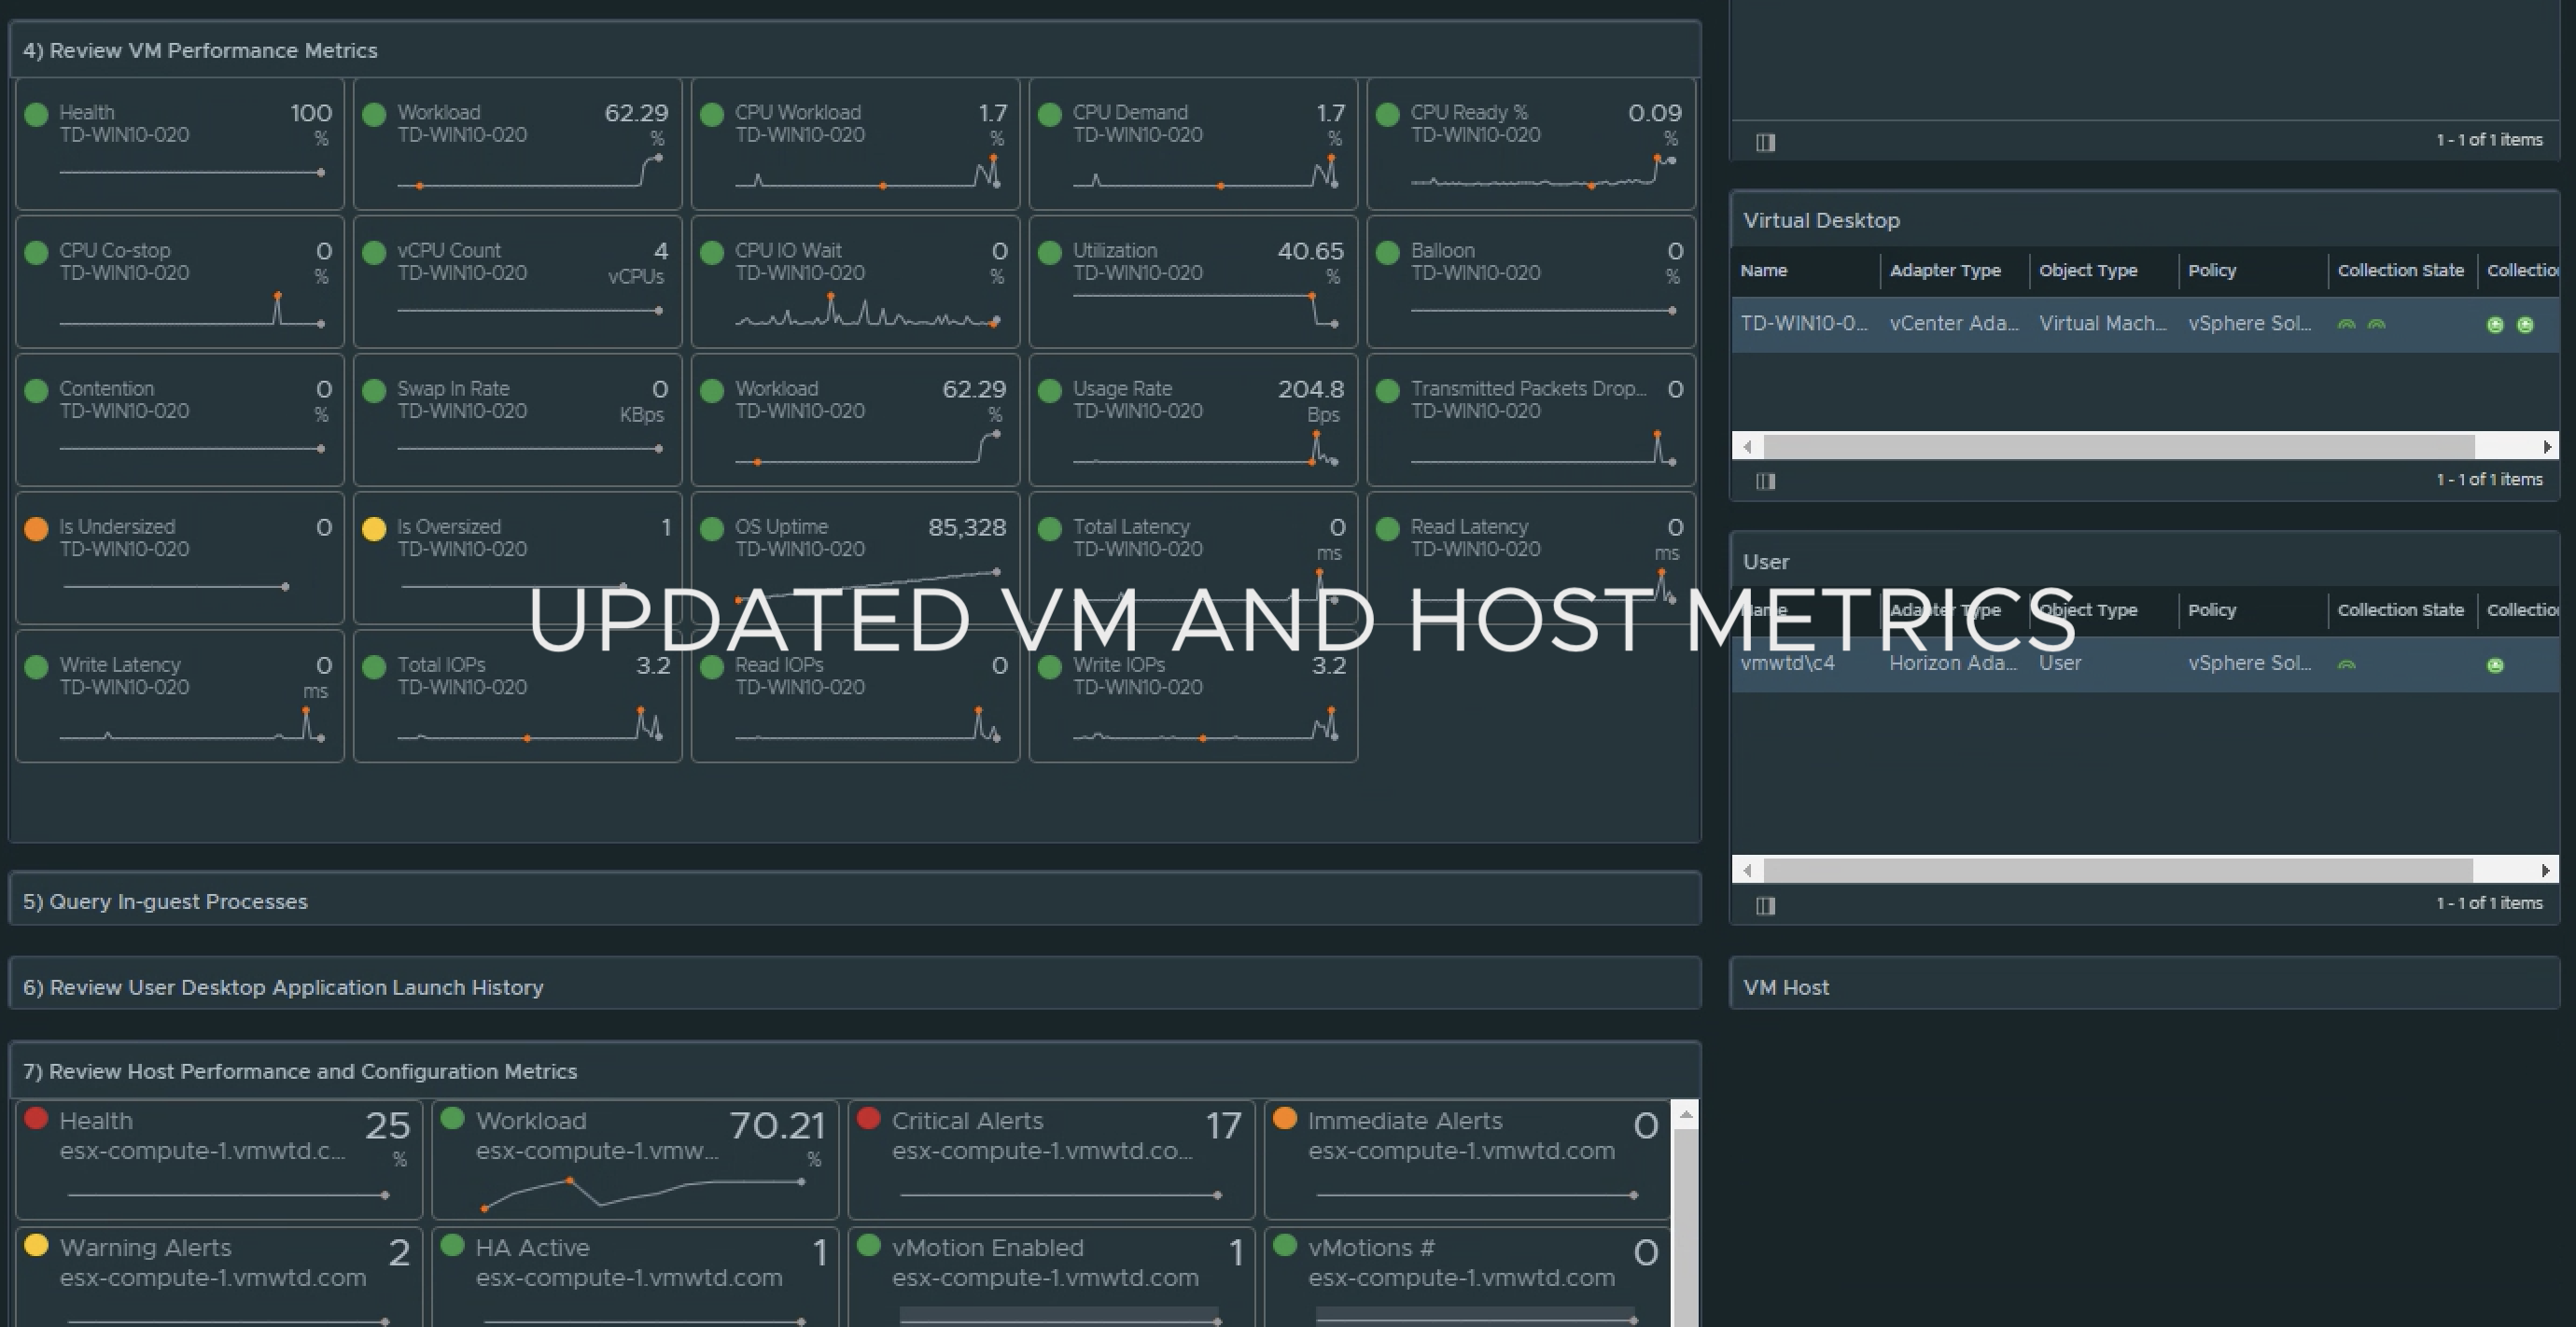
Updated Horizon Session Data Collection Model
When the MP4H was originally created there were certain Horizon Metrics that were inadvertently created as Properties. Because their values are numerical in nature and were prone to updating frequently, this triggered platform level alarms in terms of performance and scalability, as Aria Operations does not expect Property values to change frequently.
As of MP4H 2.7, Last Session Duration, Session Start Time, and Session Status will now appear as Metrics instead of Properties.
Additionally, we have added the ability to support Kiosk or multiple sessions from the same User ID in the same VDI Pool. Previously, if the same User ID logged into the same pool, only one User Session object was visible and it was not feasible to troubleshoot a single instance of that User ID in the pool. Moving forward, a new session “instance” will be created for each additional session with an incremental appended numerical value at the end. This new model will allow each session to have its own unique performance metrics and session properties, so that each session can be evaluated for performance issues.
New Horizon Costing and PricingDashboards
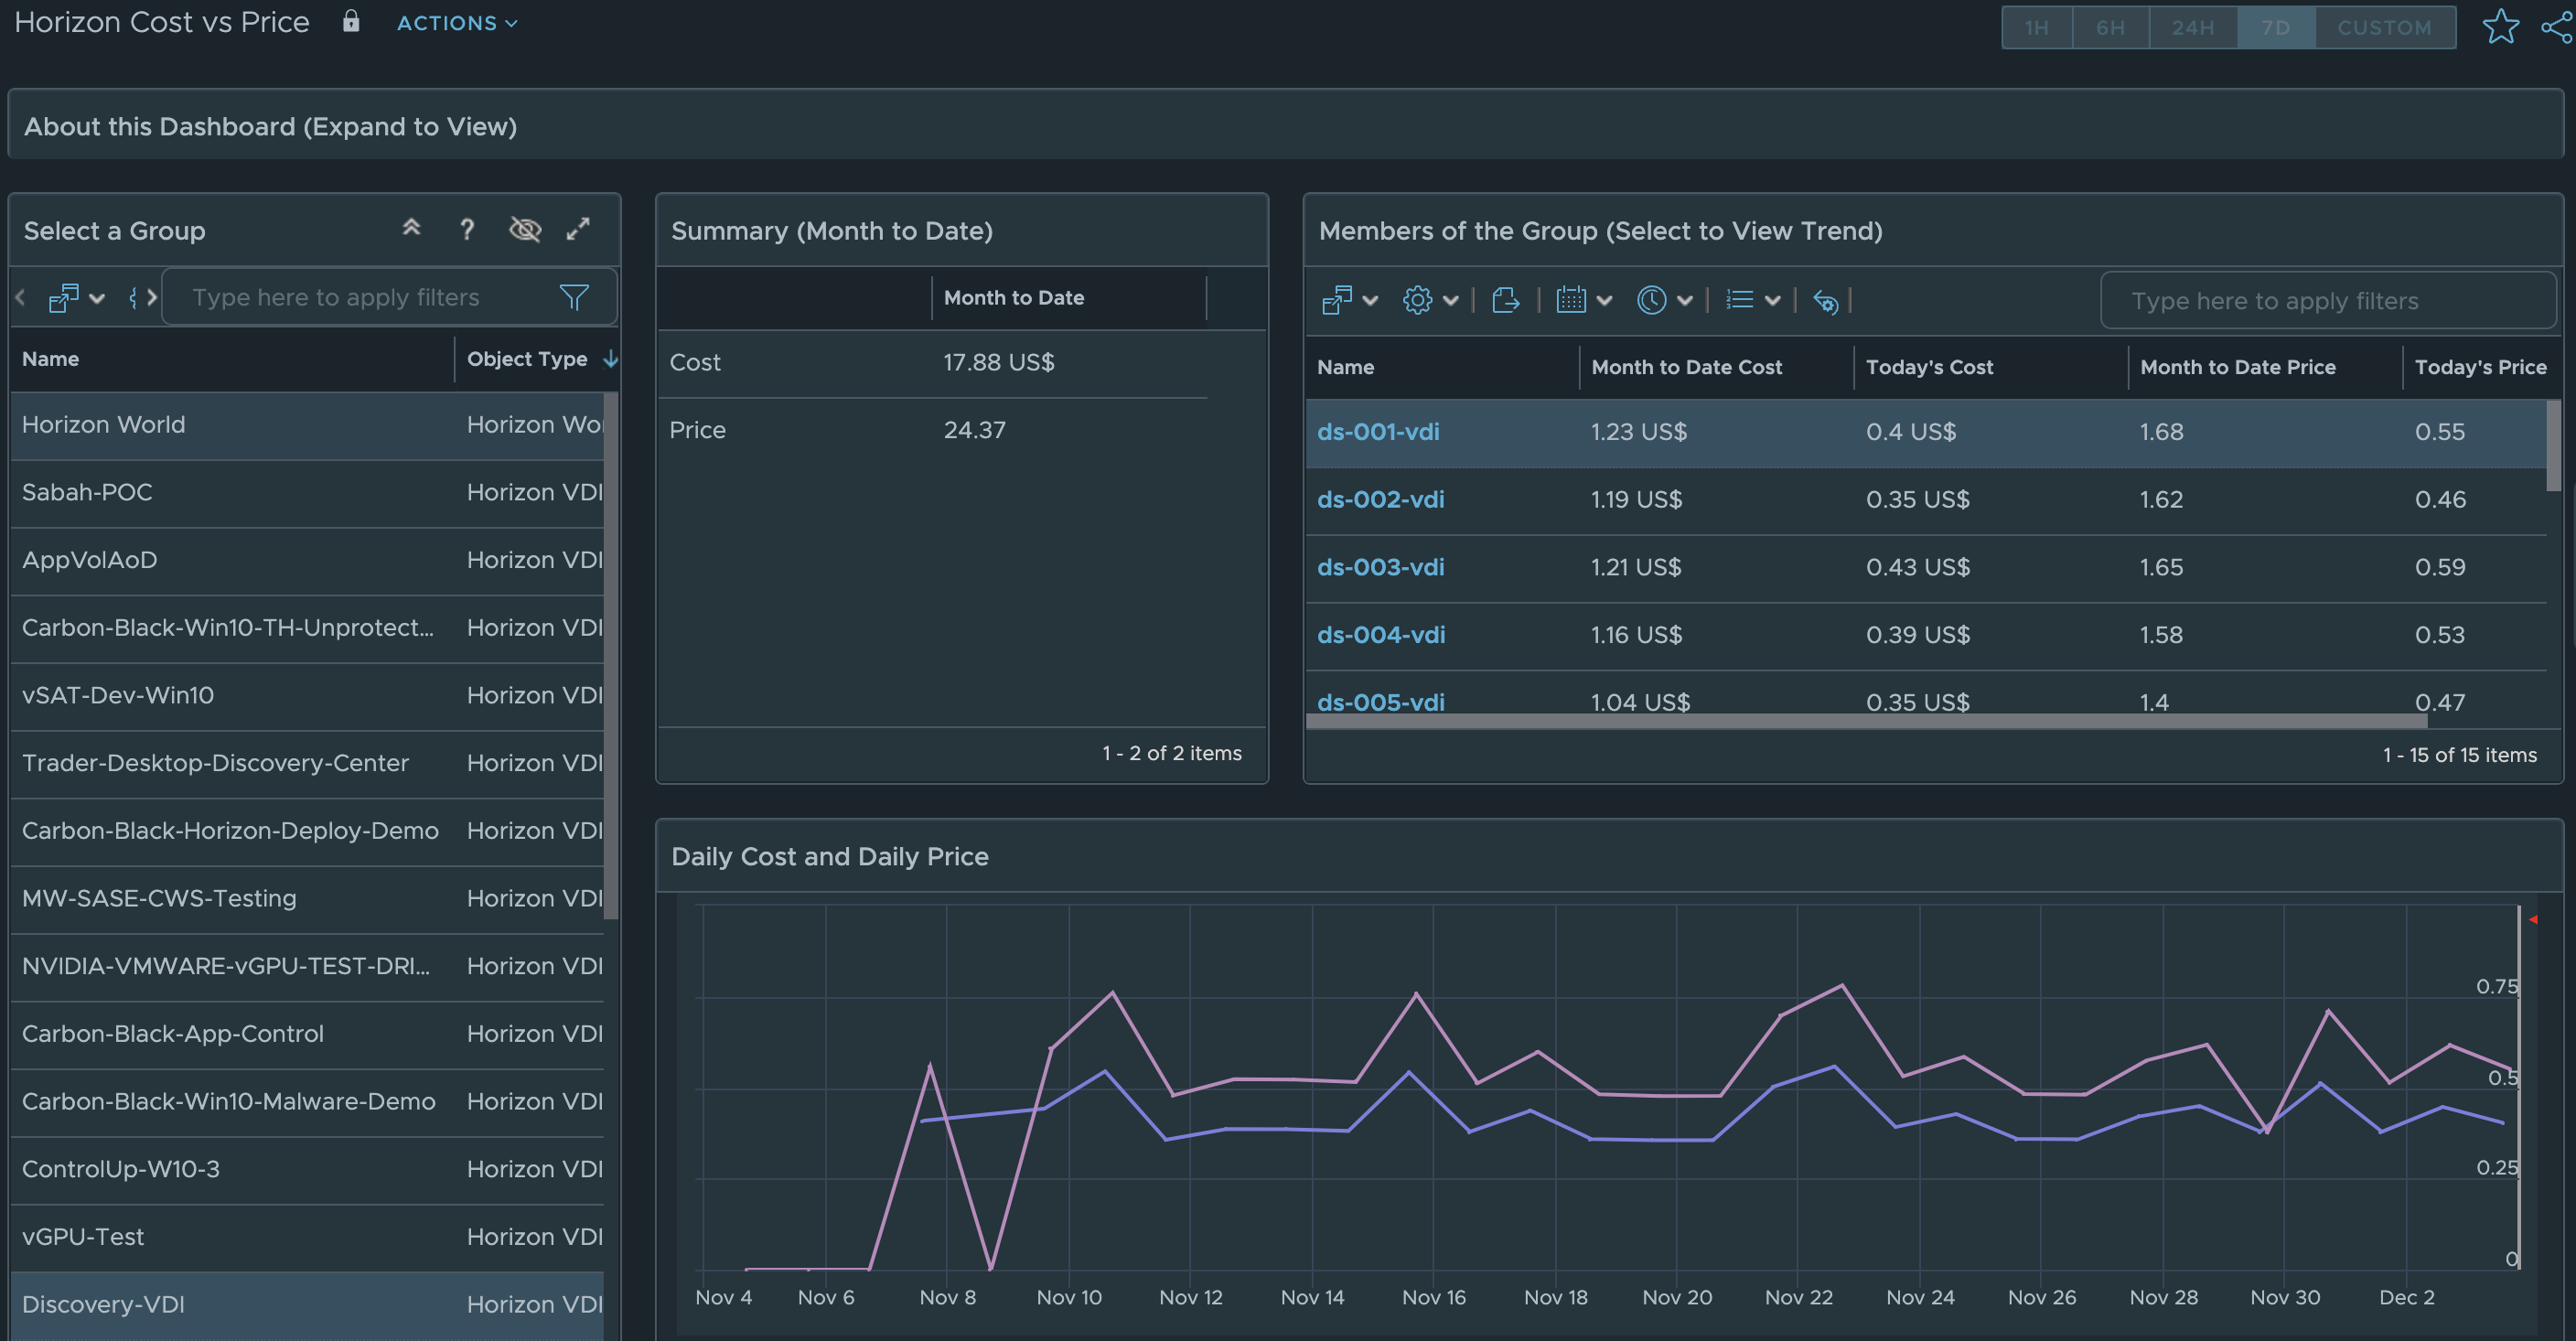
In MP4H 2.6, we added the ability to calculate Cost and Pricing metrics for Horizon Users, VDI Pools, and RDS Farms. With the new Cost and Pricing Dashboards we are able to provide additional Insight into Cost vs Pricing analysis for the entire Horizon Service.
From the Horizon Cost vs Price dashboard, simply select the Horizon World object for the entire service, or select an individual VDI Pool or RDS Farm, to see the Cost vs Price analysis.
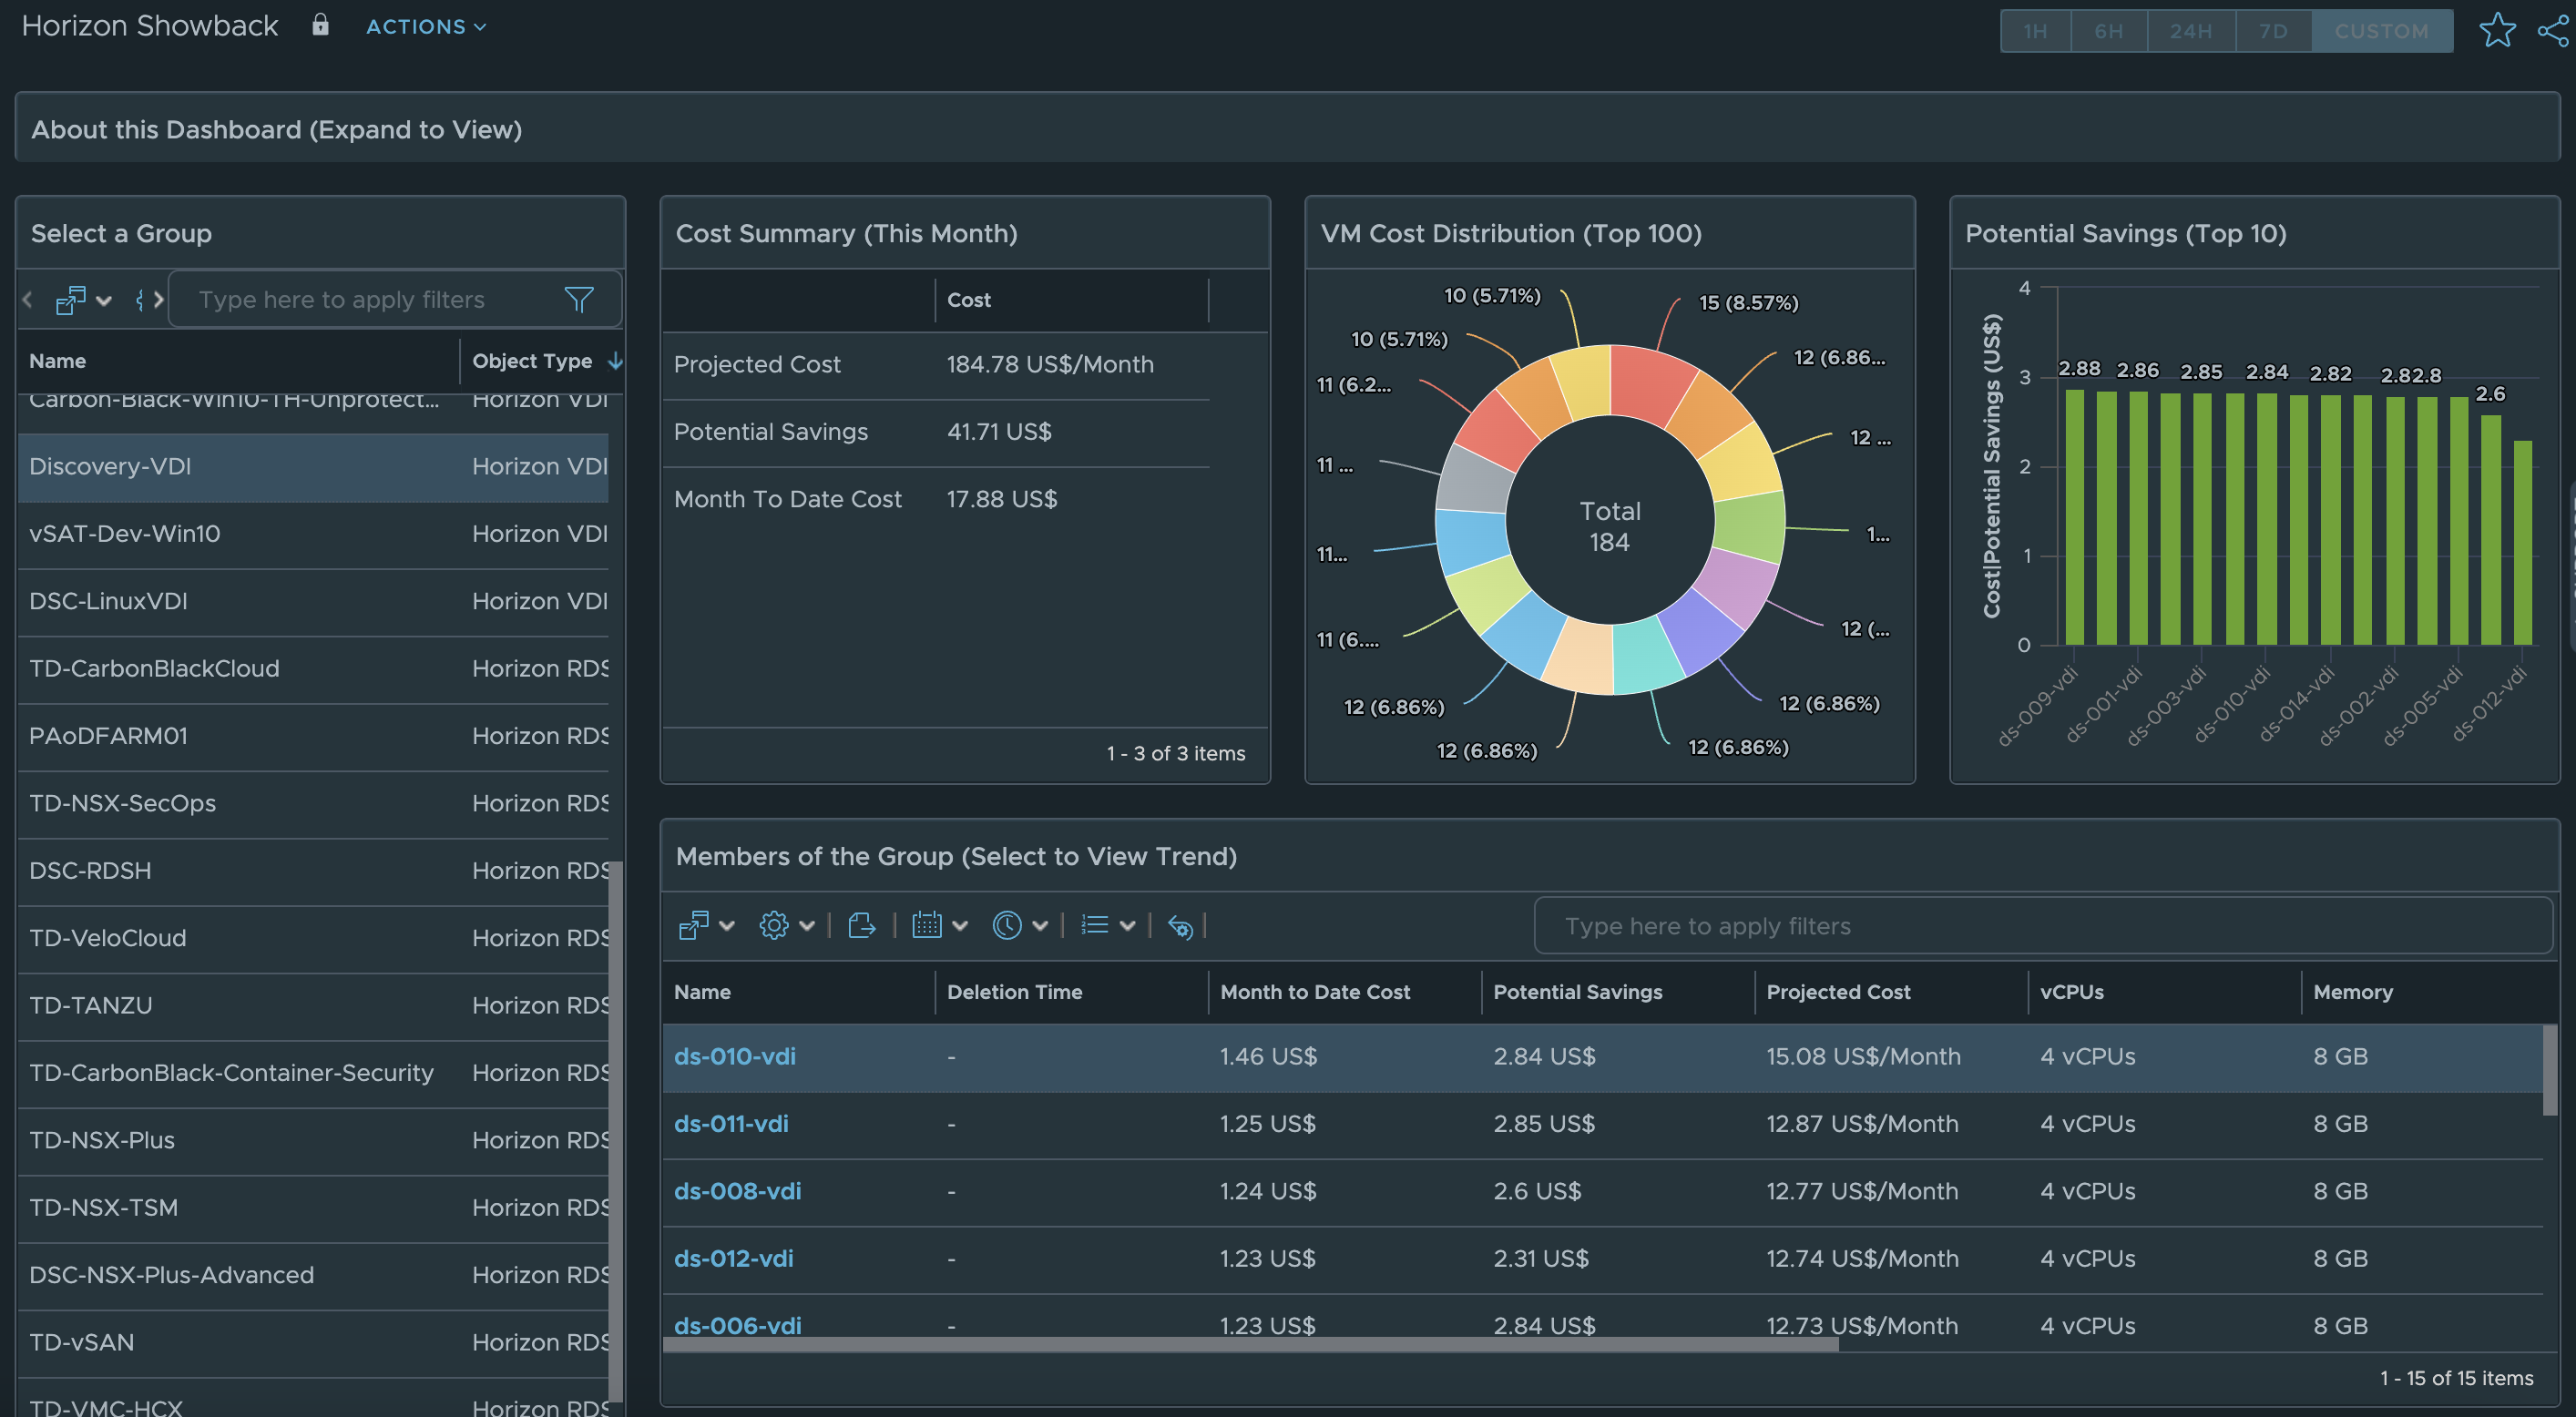
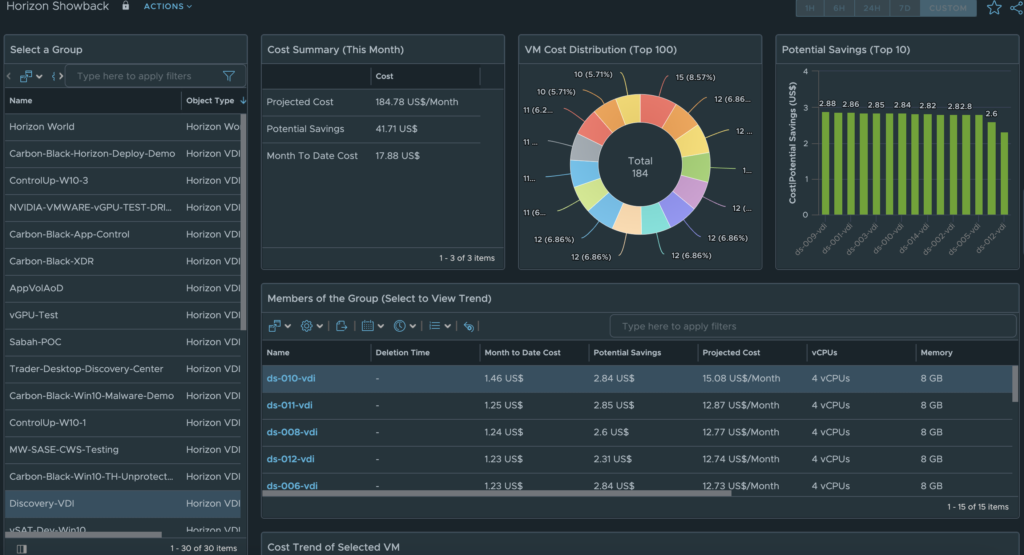
The Horizon Showback dashboard shows the actual Cost for the Horizon Service. As before, simply select the Horizon World, VDI Pool, or RDS Farm to see cost analysis for the selected object.
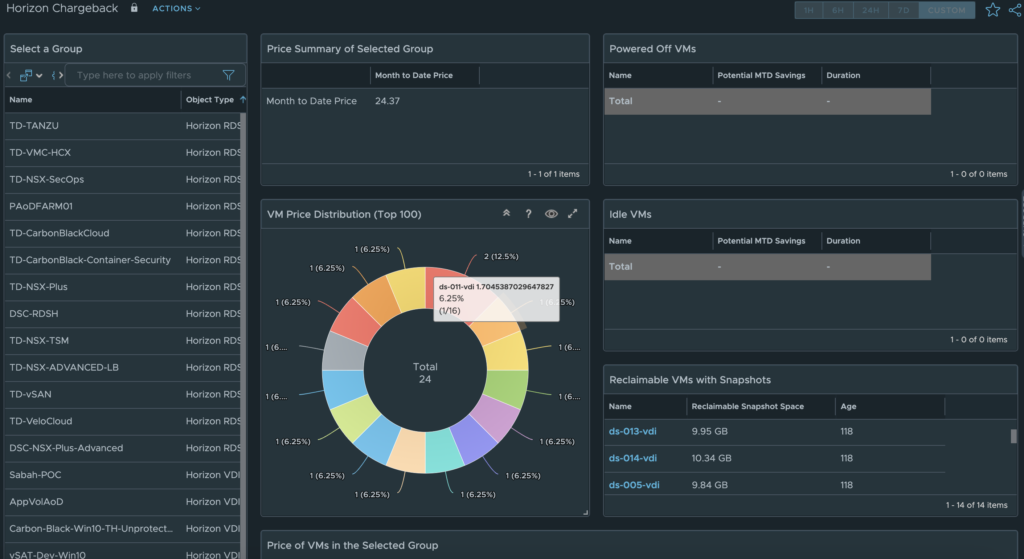
Finally, the Horizon Chargeback dashboard shows the Price (cost + service charges) for the entire Horizon Service (Horizon World object), or the selected VDI Pool/RDS Farm.
Improved Deployment and Scale considerations documentation
While the topics of deployment and scale considerations have discussed in previous blog posts, it was imperative that we included these topics in the product documentation, so that all customers can easily access them. The documentation can now be accessed in the link below.
With the latest release of the Management Pack for Horizon the priorities were to maintain compatibility with the latest release of Horizon, improve the Horizon VDI session data model to support kiosk use cases and ensure better platform performance, provide better insight into Horizon Cost and Pricing use cases, and provide easier access for all customers into critical documentation topics.
Stay tuned for more feature and content updates on the next release…
As of 1.27.2022, the Management Pack for Horizon 2.0 is now released and available for on-prem or cloud customer deployments! This is an exciting release as it brings a number of groundbreaking features to further enhance our customer’s ability to successfully monitor, maintain, and optimize their Horizon deployments.
This list of enhancements include:
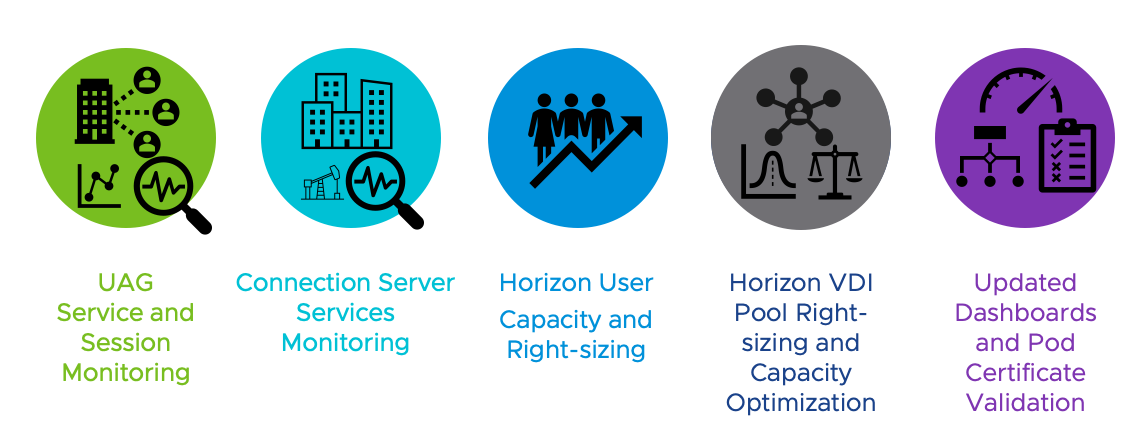
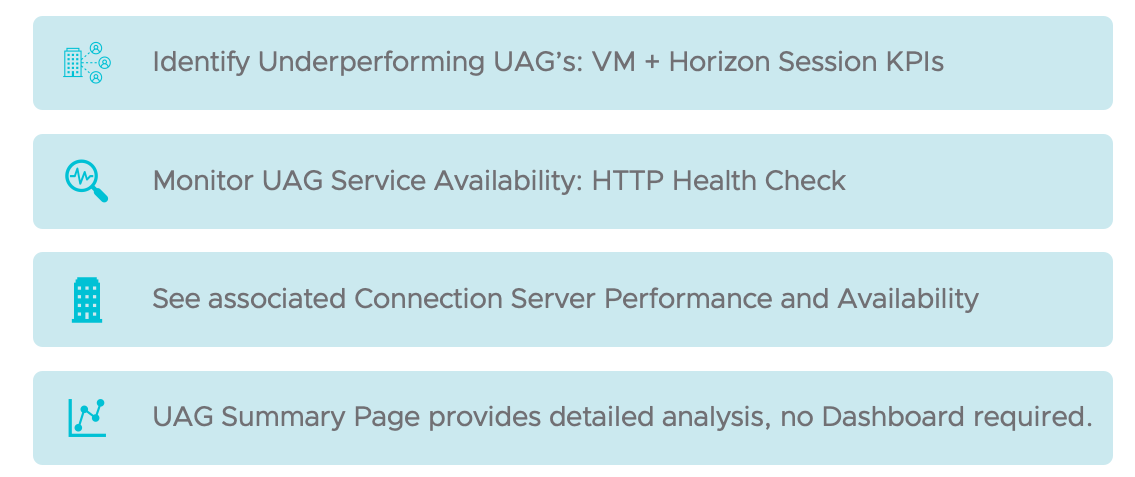
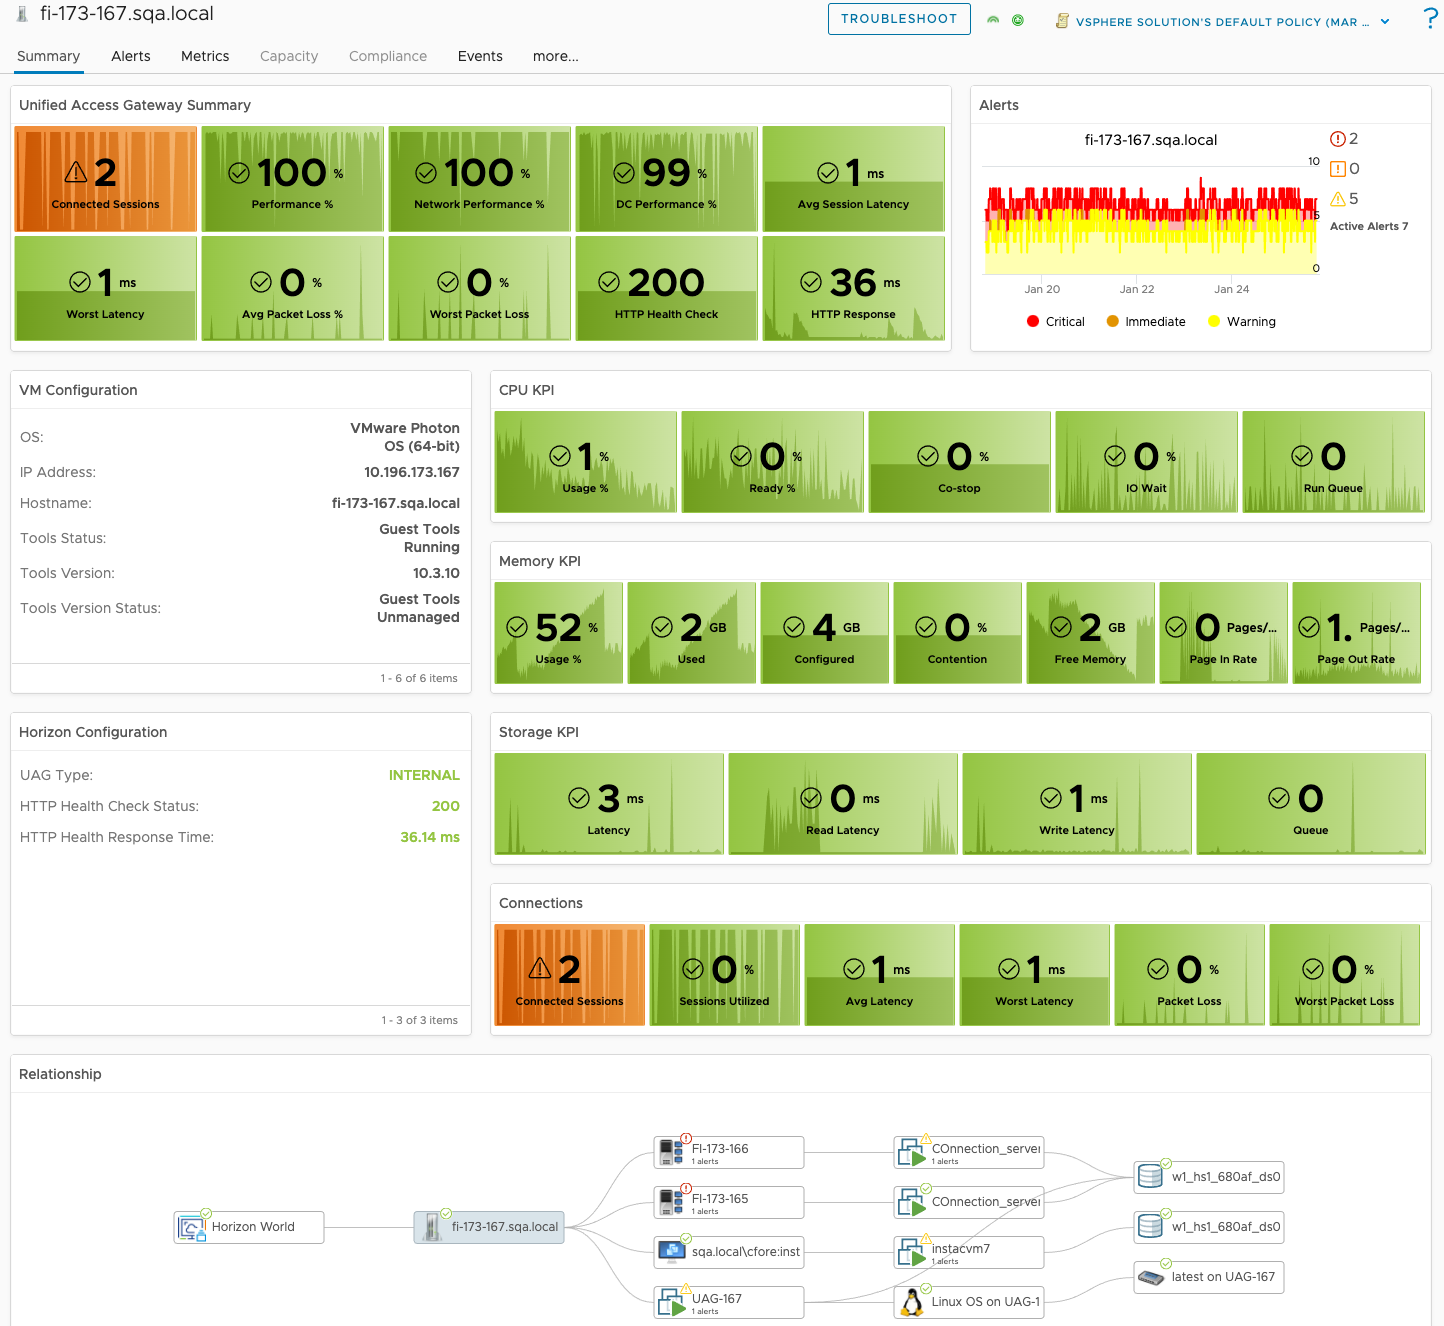
Primary use cases for Unified Access Gateway (UAG) monitoring include:
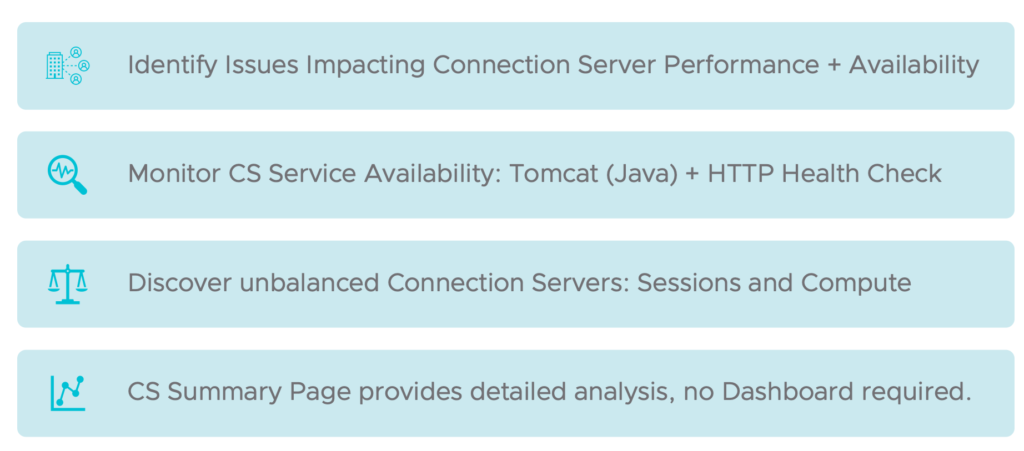
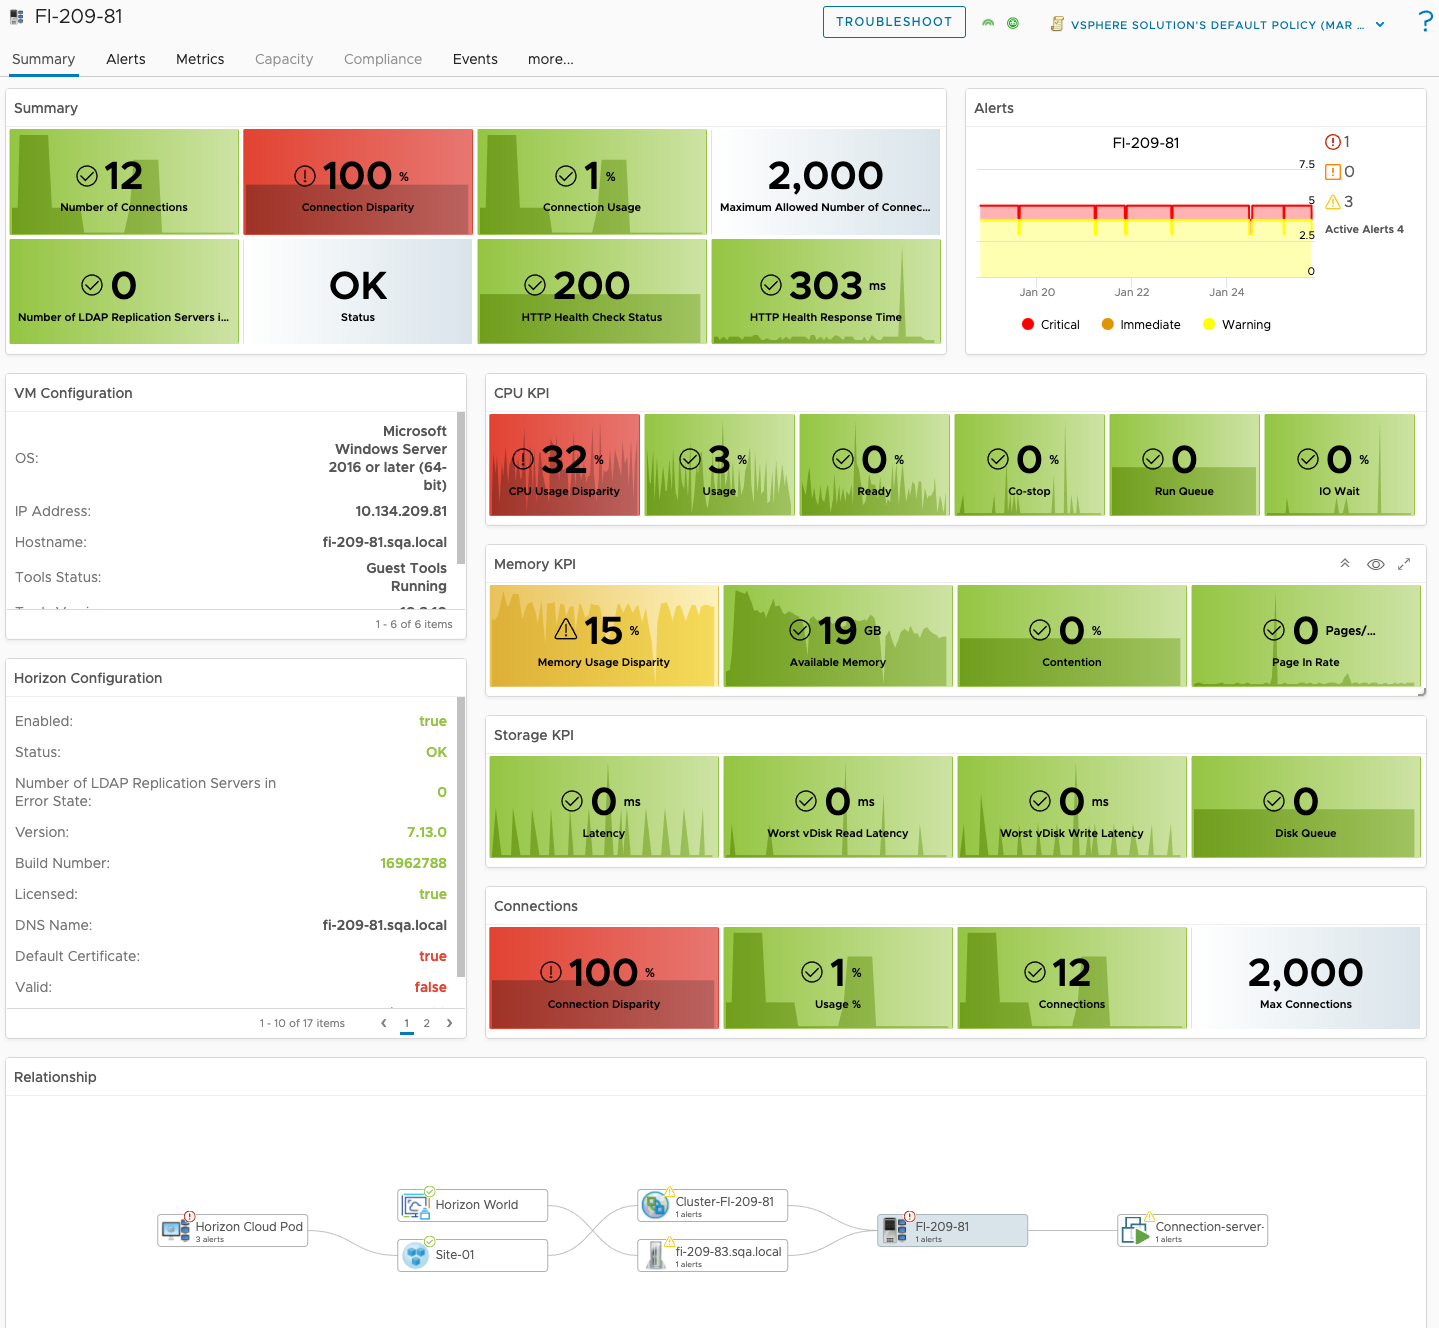
Primary use cases for Horizon Connection Server monitoring include:
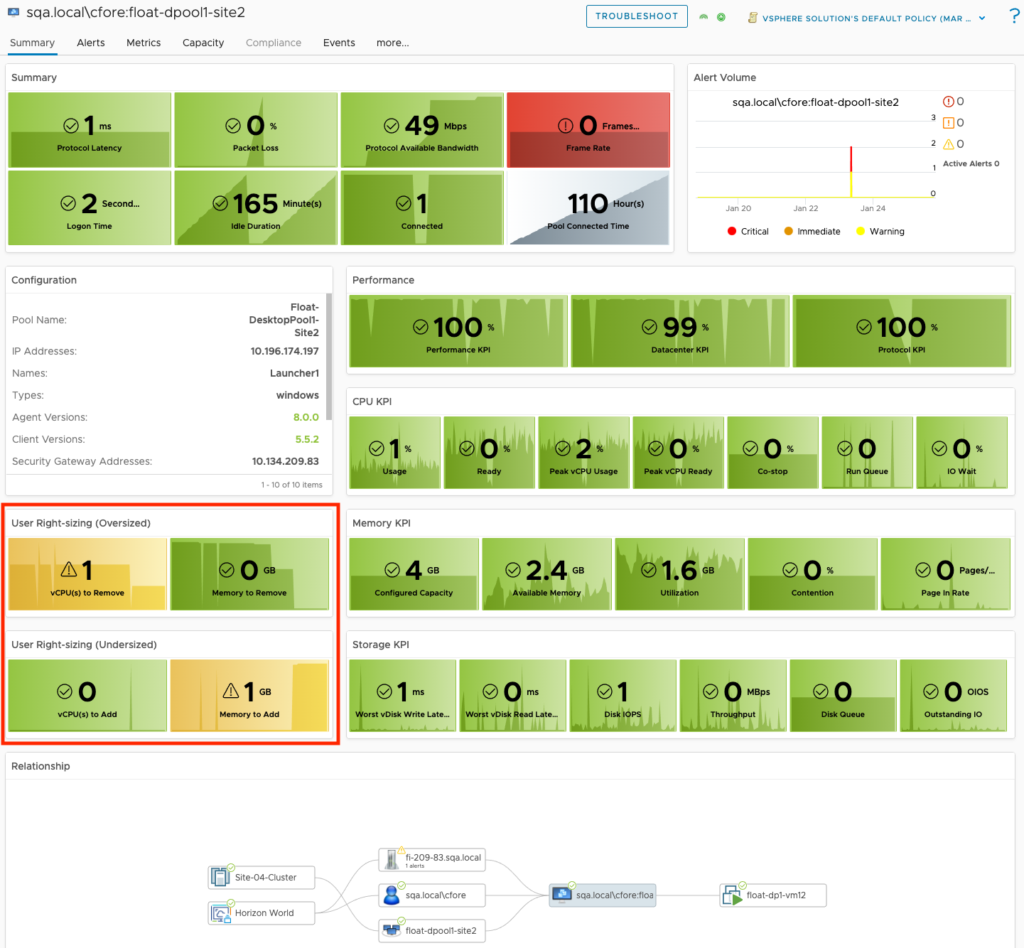
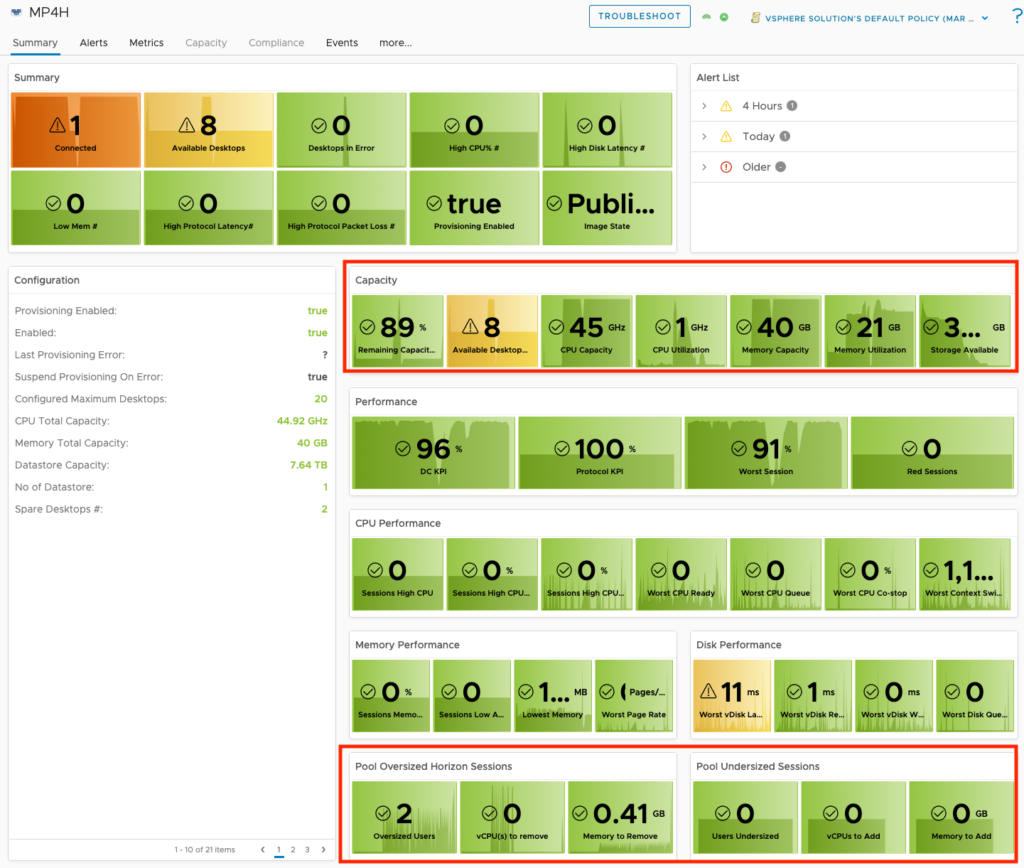
Introducing Horizon User Capacity and Right-sizing metrics:
Introducing Horizon VDI Pool Capacity and Configuration optimization metrics:
Content Release Notes: This content release includes a number of Dashboards, Views, and Super Metrics designed to take advantage of the User Interface enhancements in the vROPs 8.x platform, providing richer and more visually impacting insight into the overall health, performance, and consumption of your Horizon View deployment.
Compatibility: All content was created on the latest vROP 8.0 platform, so it has only been tested to work with this specific version. The Super Metrics are most likely to work with older versions such as 7.5, but the Views specifically have configurations options that were not available prior to vROPs 8.0.
With vROPs 8.0, only Horizon Adapter 6.7.x is fully supported, so make sure that your Horizon View environment is compatible with the vROPs for Horizon 6.7.x adapter.
Conditions: All content provided is on an as-is basis, and should be validated and tested before use in production environments.
*It is recommended that you import and configure the provided Views and Super Metrics before importing the dashboards. Examples of how to do so are provided in previous posts.
As the number of user sites or locations increases, having good visibility into the overall quality of connectivity of those sites to your Horizon View data center(s) becomes increasingly important. Having worked with many customers on troubleshooting connectivity between such locations, it has become clear that monitoring only at the physical network layer is not sufficient to properly diagnose user connectivity issues impacting the display protocol. In fact, in most cases, it’s the configuration of the physical layer that causes the issue(s), and the device(s) in question do not have the ability to diagnose or detect their impact to the display protocol.
Alas, all hope is not lost! With vROPs for Horizon, we have the ability to monitor the key metrics related to protocol performance and can alert when those metrics have reached critical thresholds. We can also leverage a handy custom grouping feature to organize the remotely connected sessions into defined sites or locations, based on information available in the user’s session data. We can then leverage Super Metrics to calculate the overall health of the group of connected sessions from that site, and then display and alert when the health has dropped below our SLA thresholds.
Sound like something you want to take on? Then read on!
We need a strategy to capture and organize how we determine which connections are from which site. The most common approach is to leverage the known internal subnet IP range for that site, and set that as the primary filter for the custom group. However, additional metrics supplied by the user’s session data can be leveraged as well.
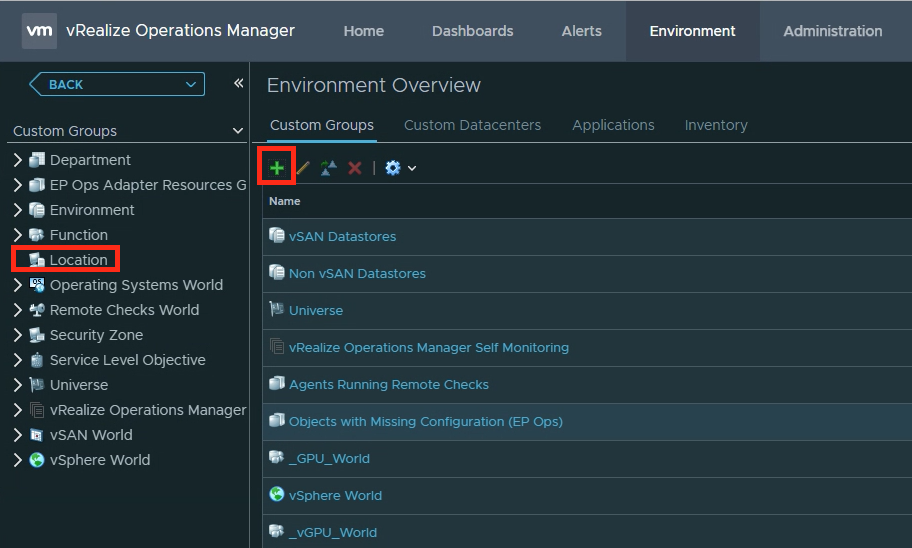
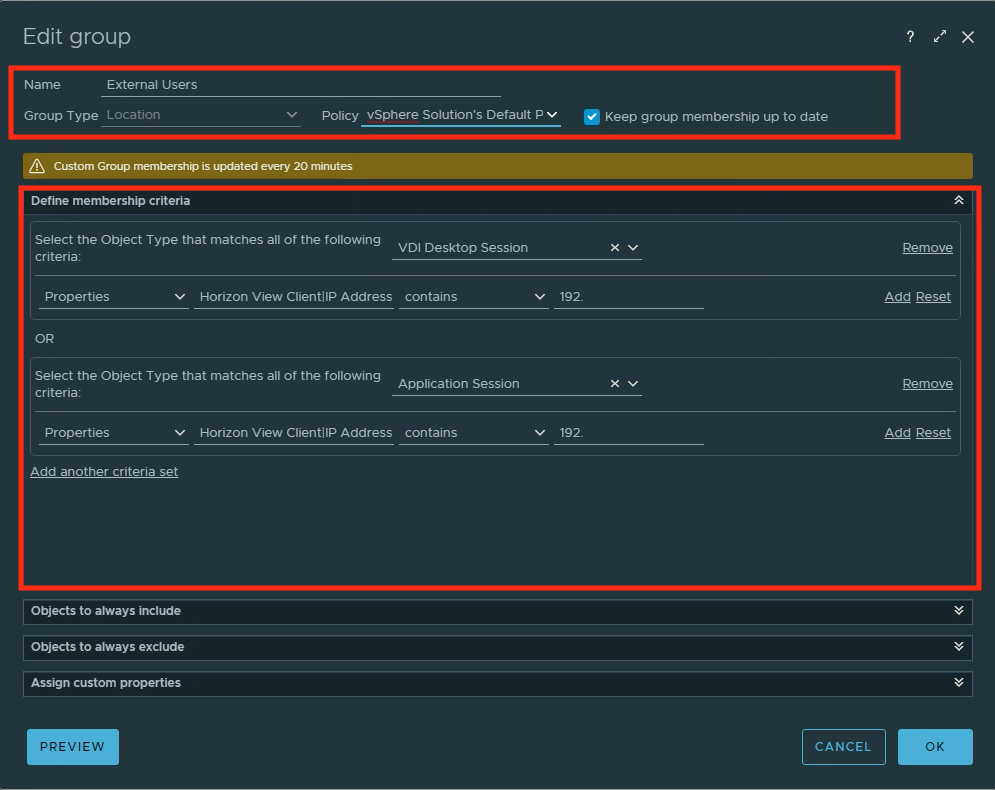
In this example, I will create a new Site labeled “External Users”, under the “Location” group, and filter on all users who have an internal subnet IP containing “192.”.
Navigate to Environment tab -> Location -> +Notice that both session types Desktop and Application are added separately. While not required it will impact which sessions are captured, so make sure to add the required session types.
Note: It may take some time before the group starts to populate the sessions, and as noted in the image above, population updates are every 20 minutes.
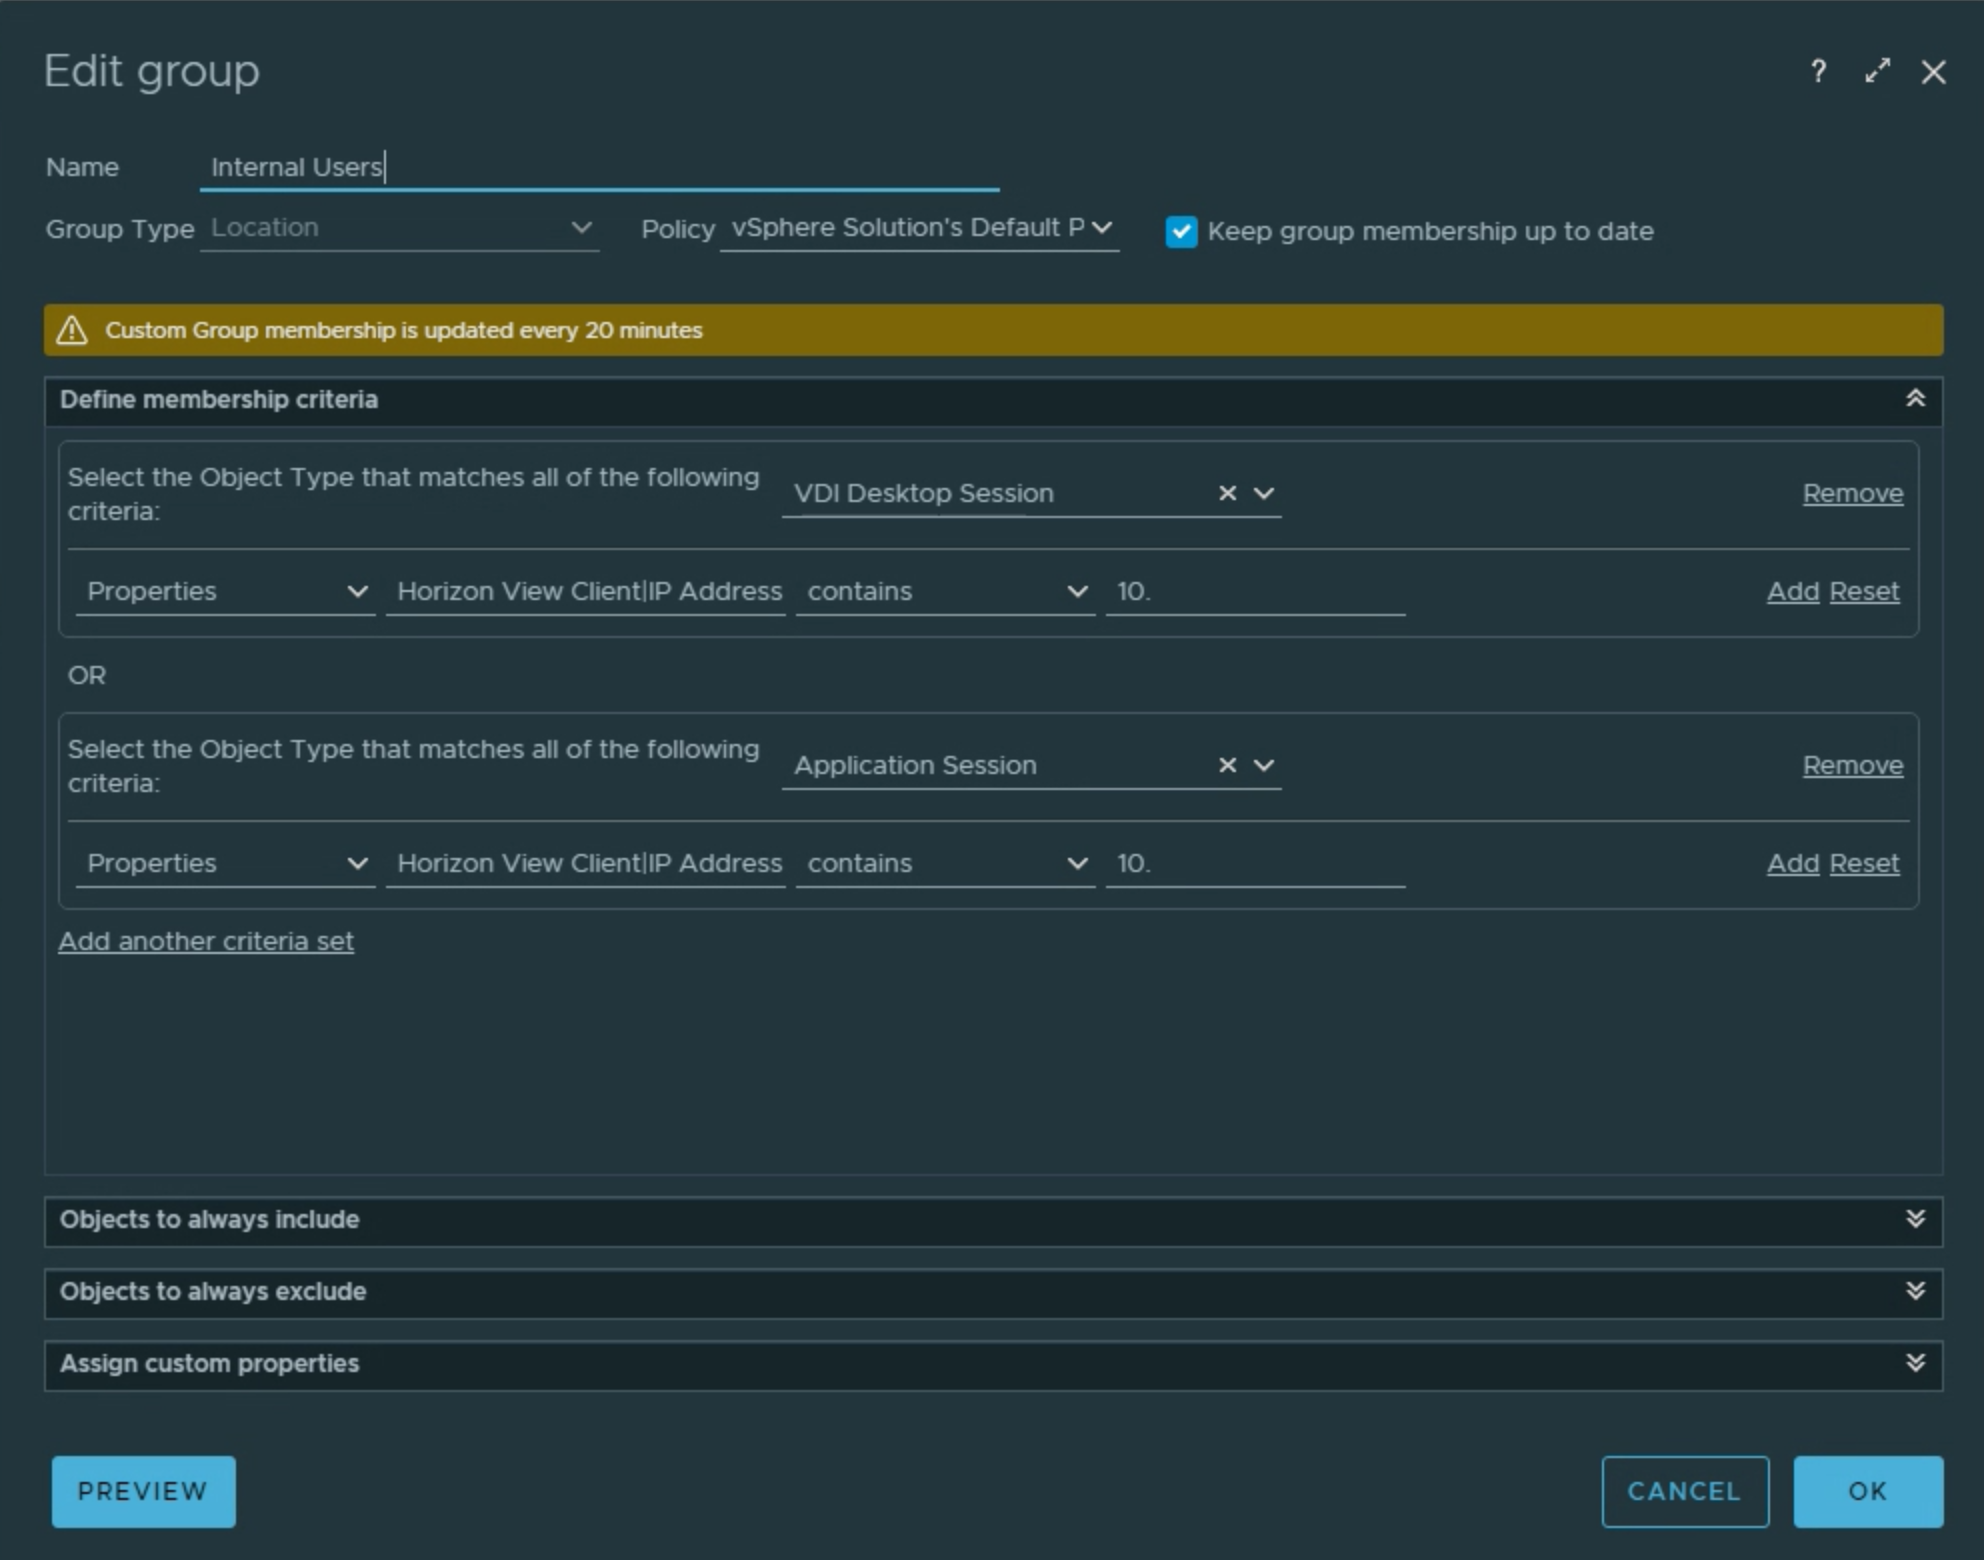
You will also want to create at least one more additional site for comparison purposes. In the example below, I have created an “Internal Users” site that filters on 10.x networks to separate the session traffic.
Second is just after first… as long as we’re counting up! 👆
Once your group has started to populate with sessions, it’s time to create meaningful Super Metrics on the group that will give us insight into how well that site is connected.
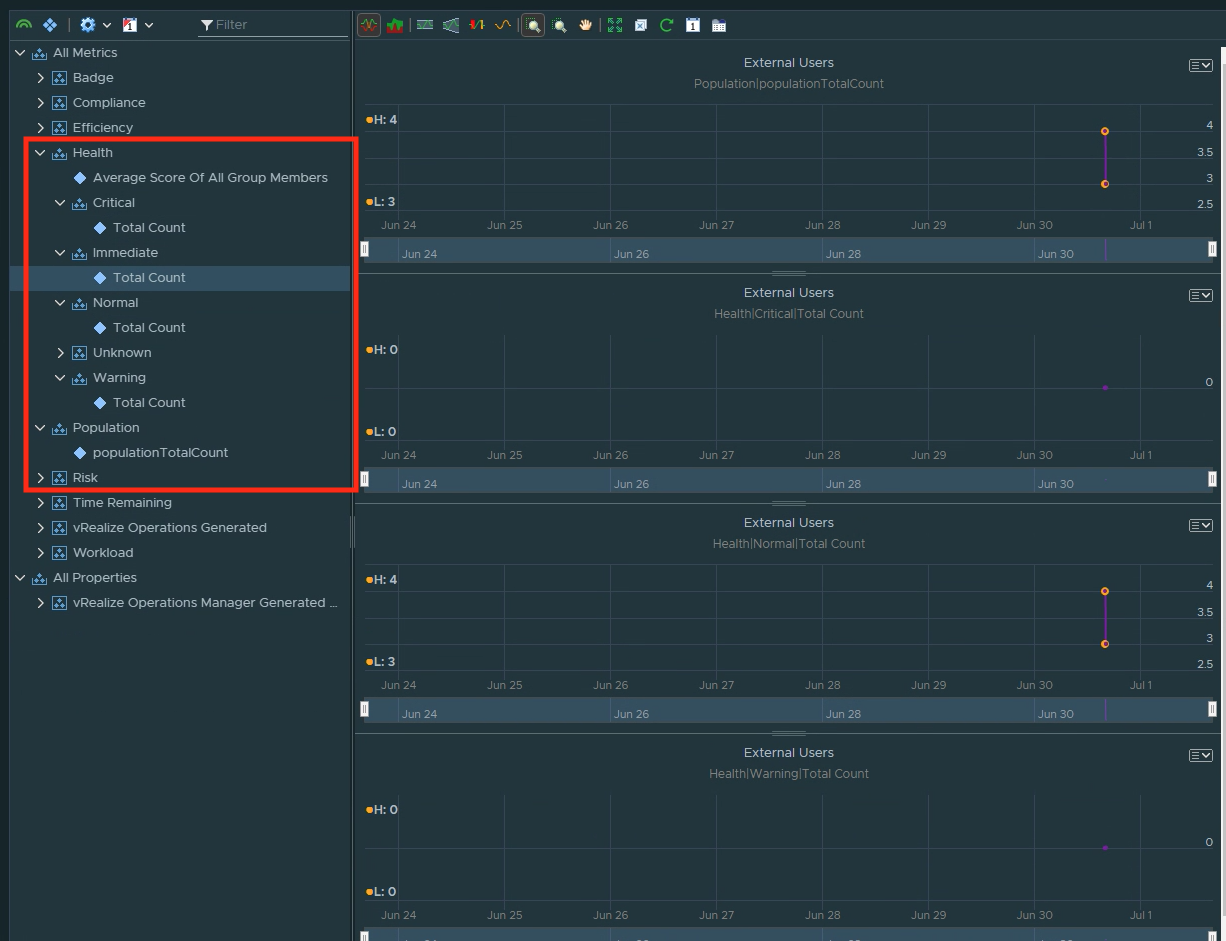
By default, vROPs 7.5+ will create population TotalCount and Health Criticality Total Count metrics. These will be useful in leveraging out-of-box KPI based alerts that track how well users are connected to the Horizon Environment and let us know the distribution of good to bad connected sessions from that site.
Out of box Health Criticality counts on the custom group.
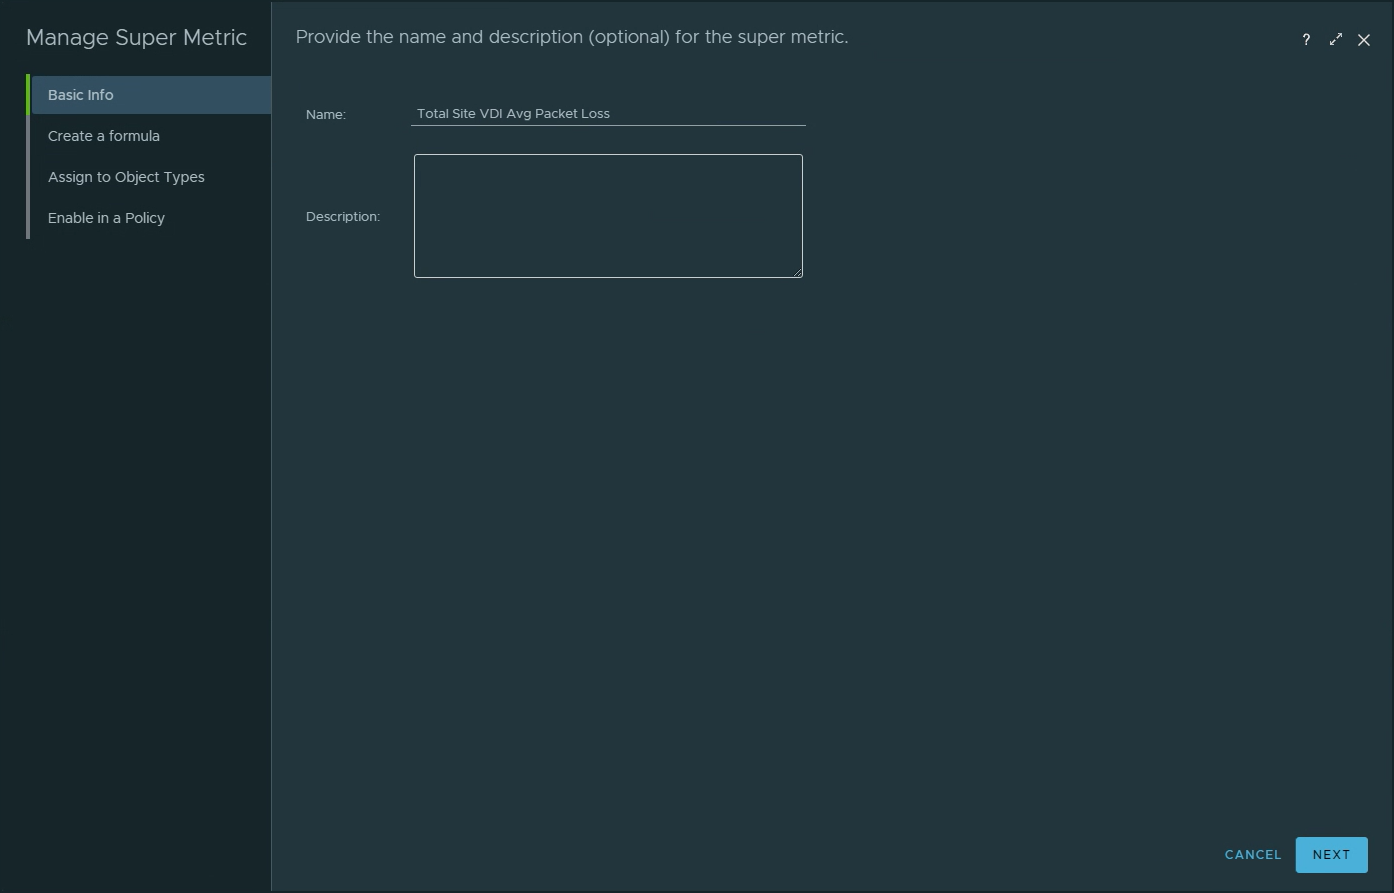
Leveraging Super Metrics, it’s time to create additional site tracking metrics that include, but are not limited to, average site Latency, Packet Loss, Jitter, Frame Rate, and Transmitted Bytes.
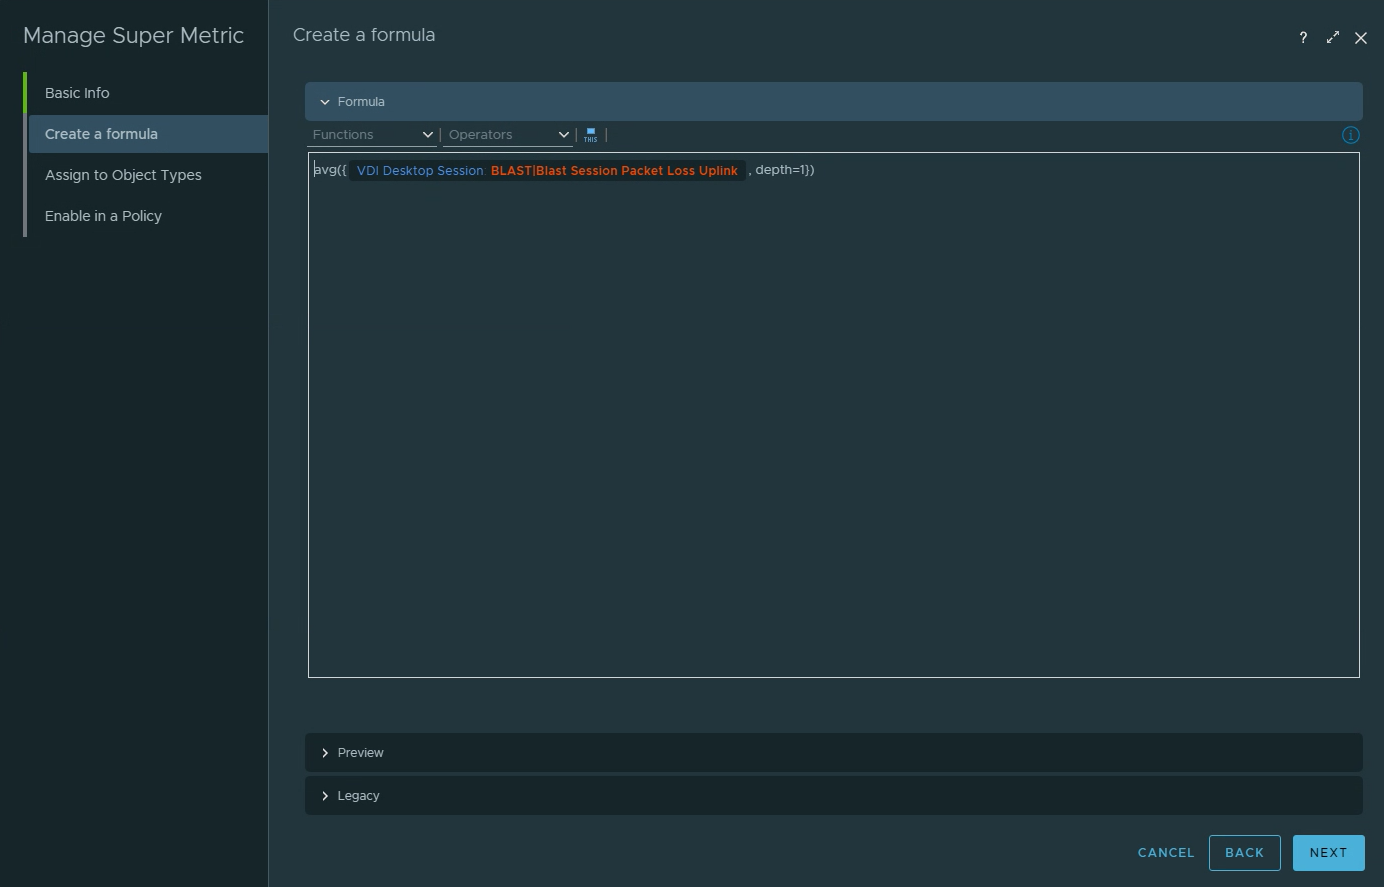
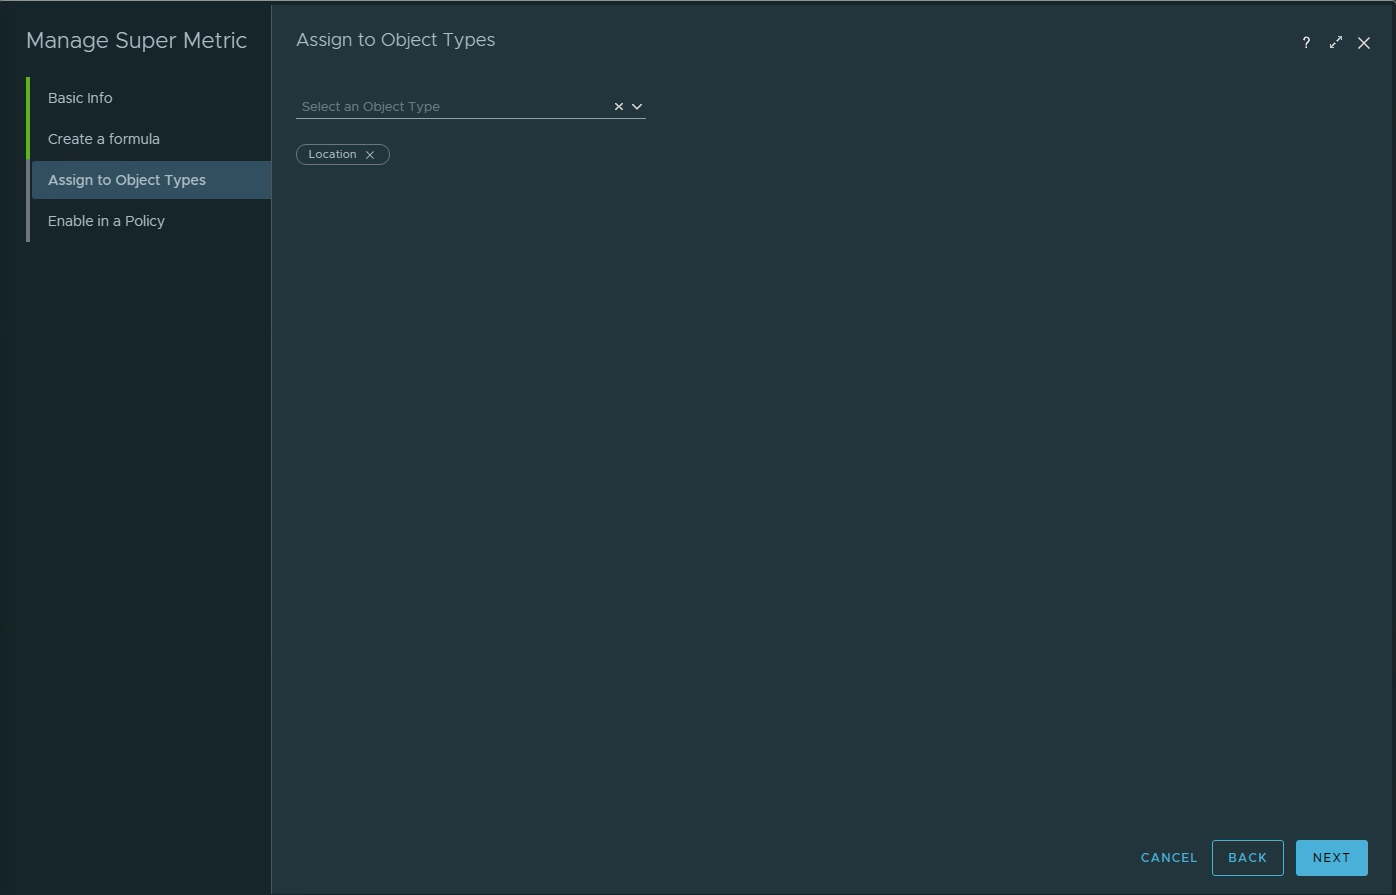
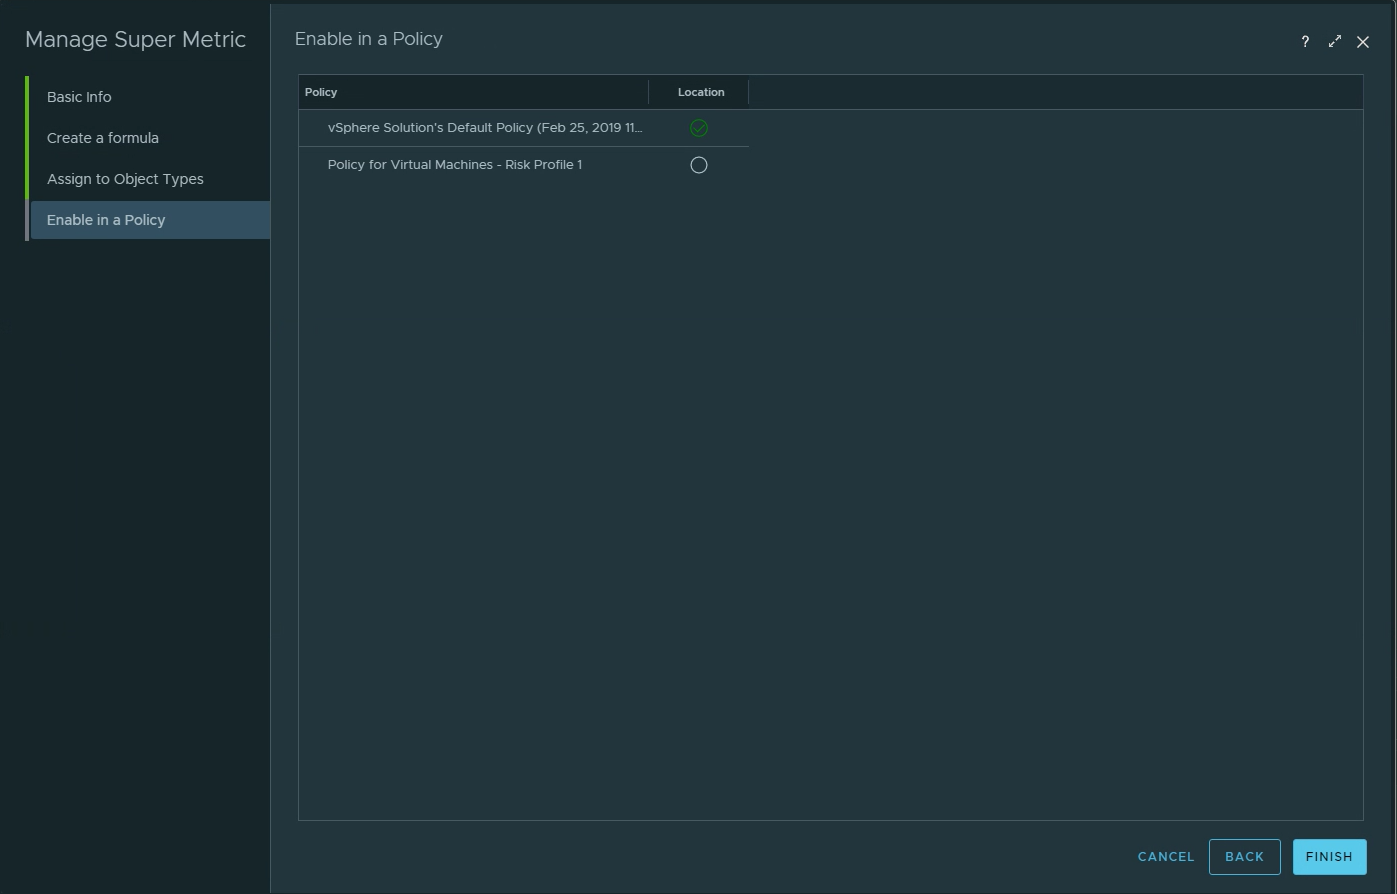
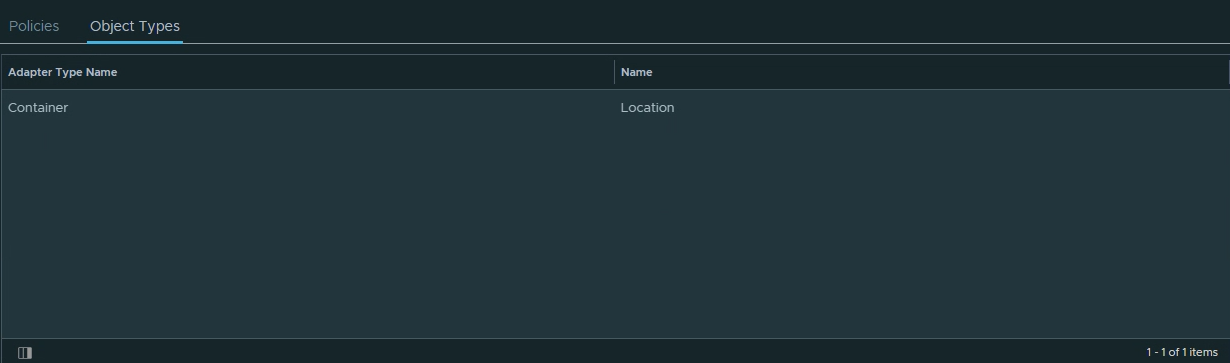
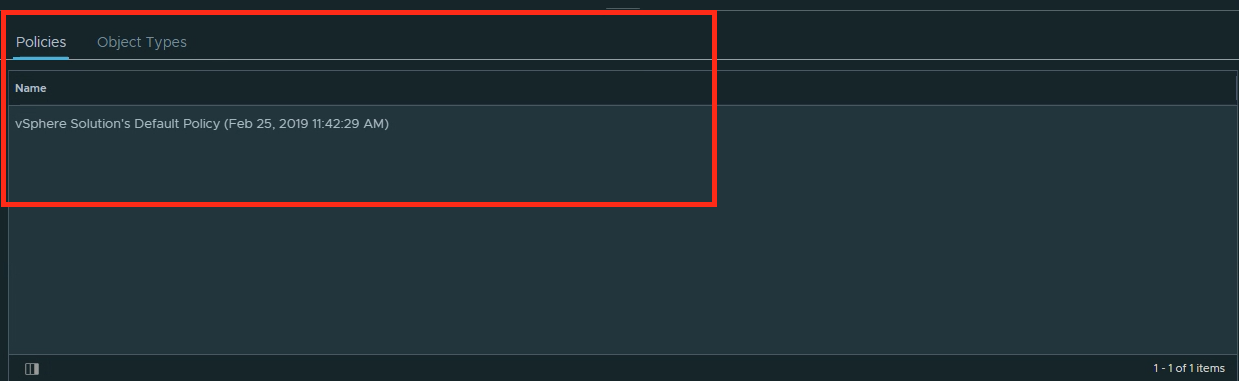
Super Metric name is “Total Site VDI Avg Packet Loss”.Use the Avg function on the VDI Session Blast Packet Loss Uplink metric.Assign the Super Metric to the “Location” object.Select the active policy that will allow the Super Metric to collect.Verify that the “Location” Object Type has been assigned to the Super Metric.Verify that the active policy is associated with the Super Metric.
Thirdly Rinse and Repeat… ♻️
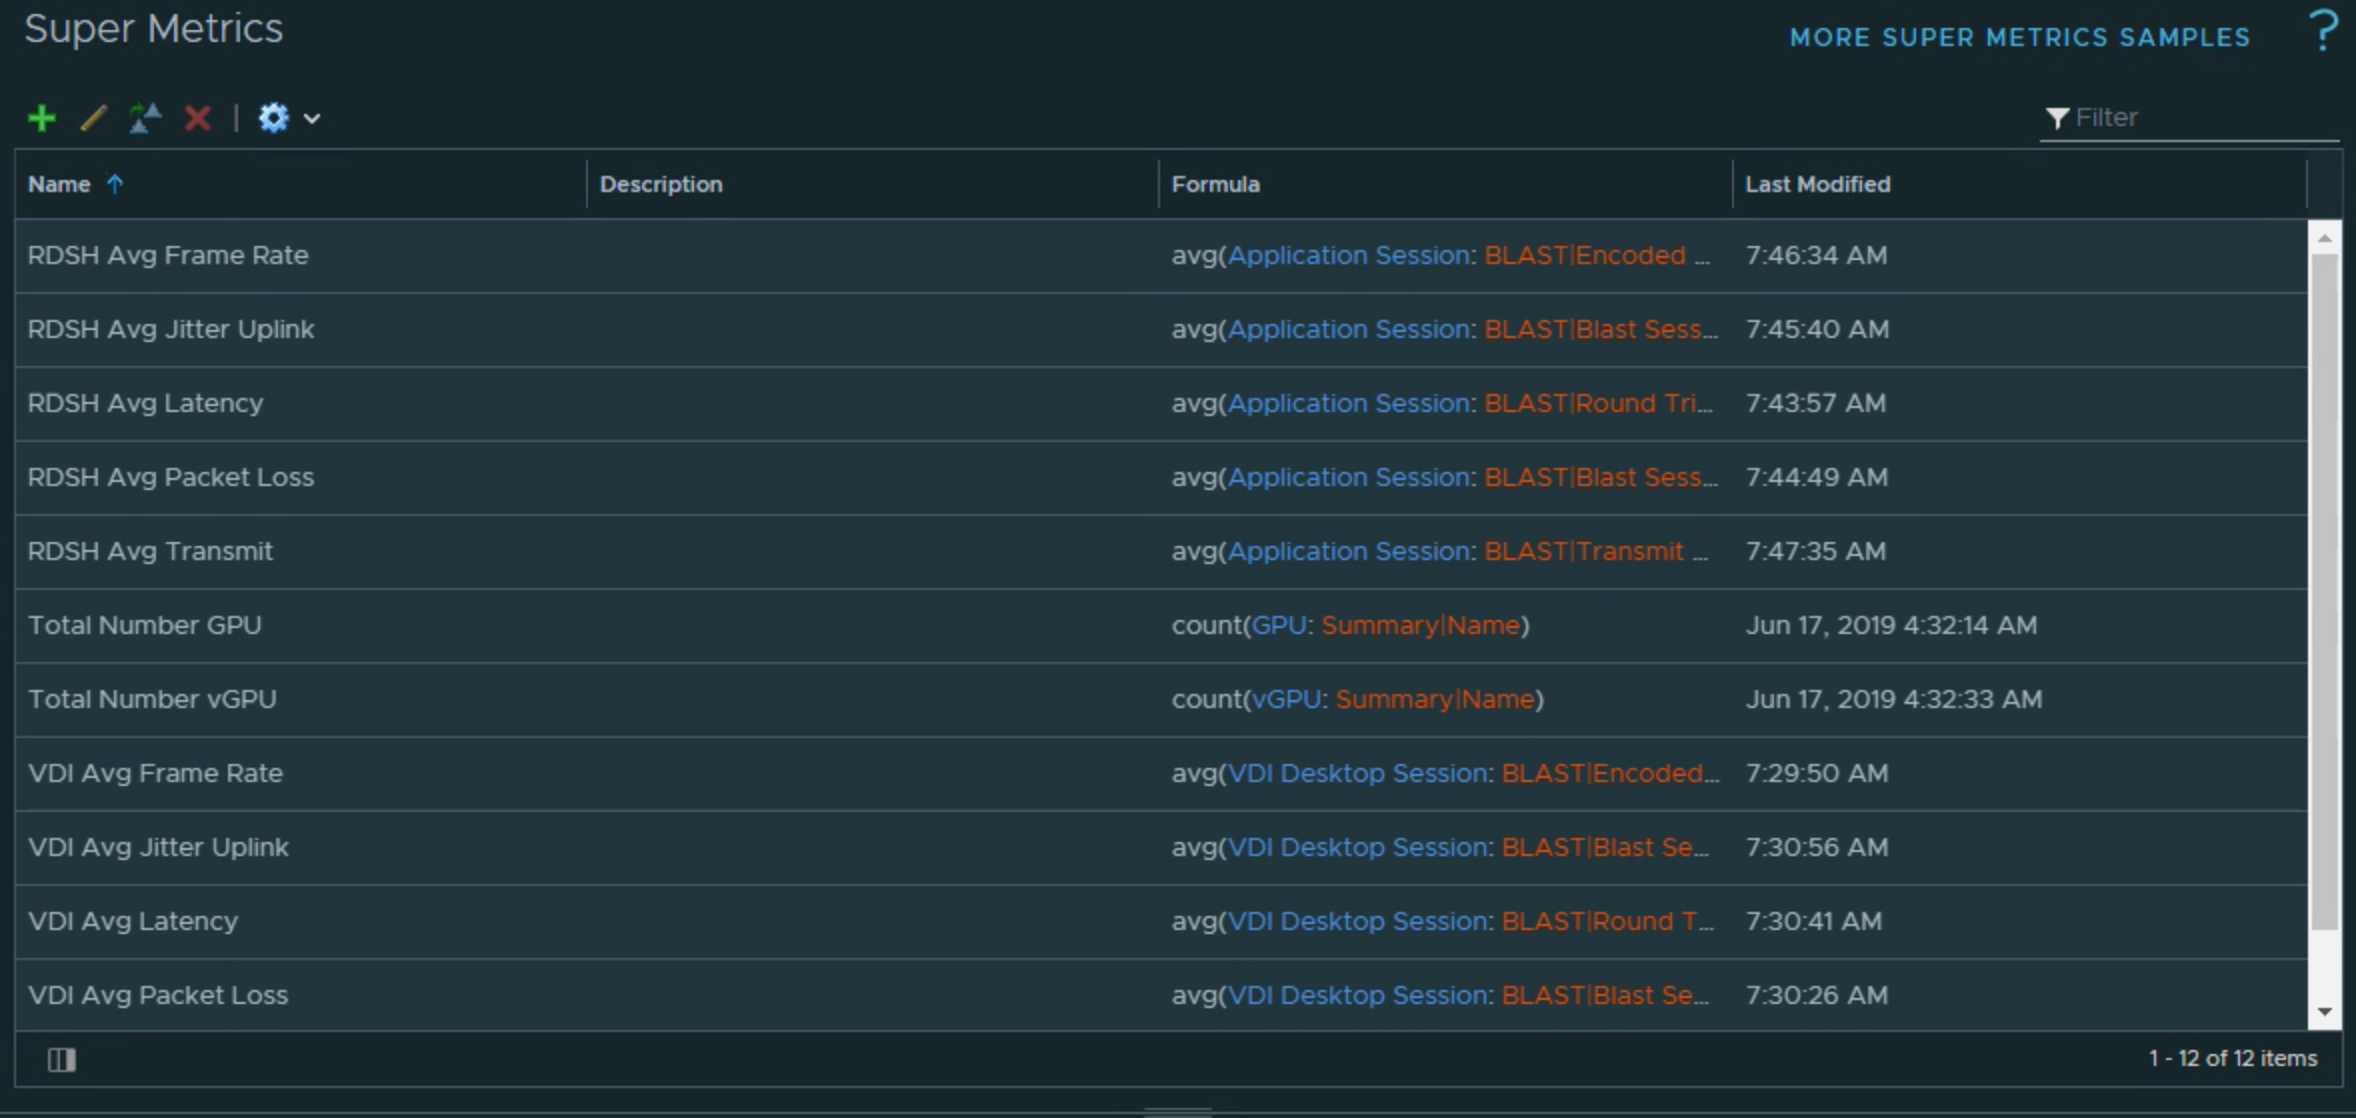
Continue to create the Super Metrics for the additional session metrics that you want to collect. As in our example below, you will need to do this for both the VDI and Application Sessions individually to capture the metrics from both types of sessions.
Completed Super Metrics list.
Now… what to do with all this stuff? 🤔
Now that we have meaningful Super Metrics on our custom group, it’s time to display that data in a way that it makes it easier to diagnose specific site connectivity issues, and compare that site against other sites that are connecting to our Horizon environment.
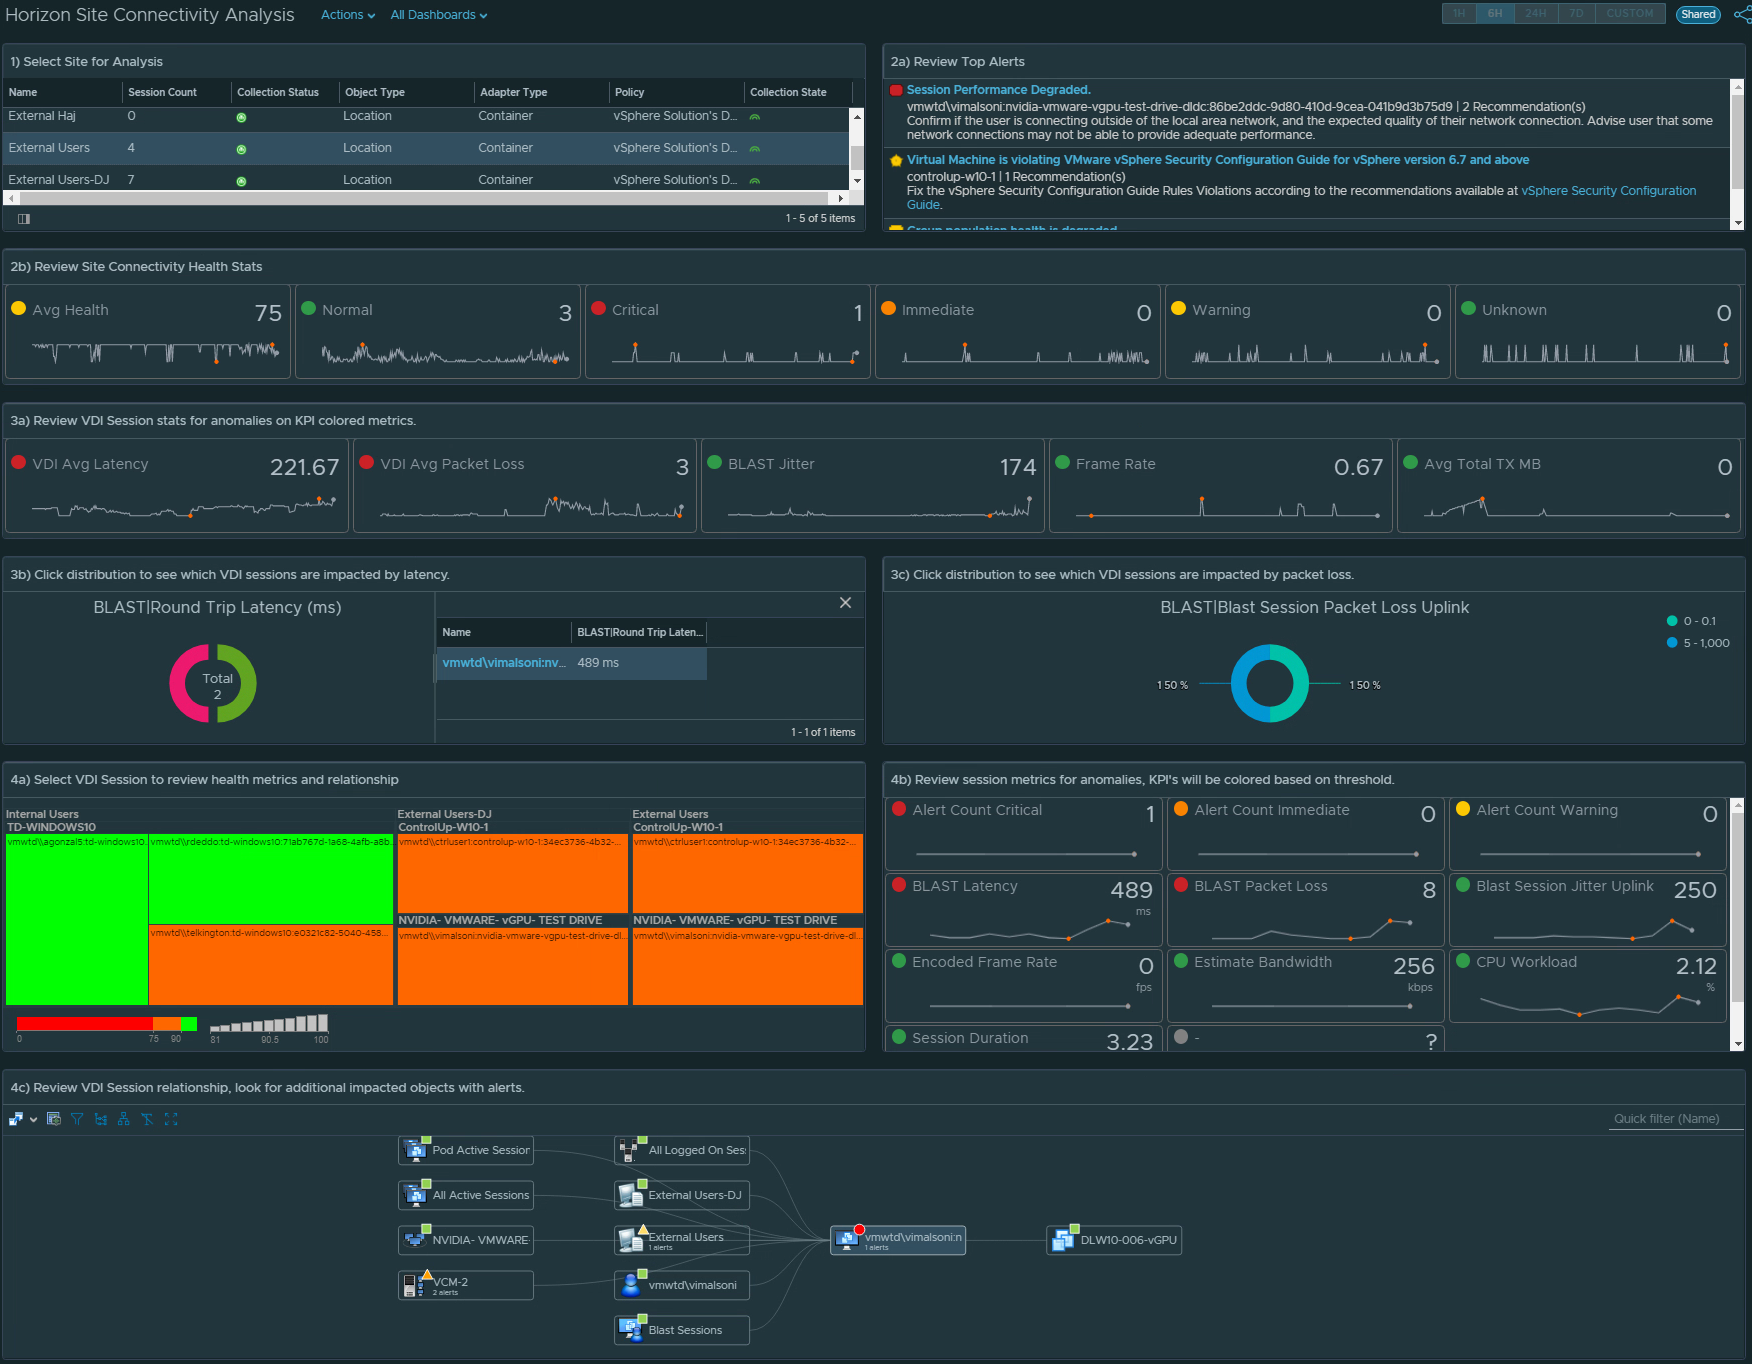
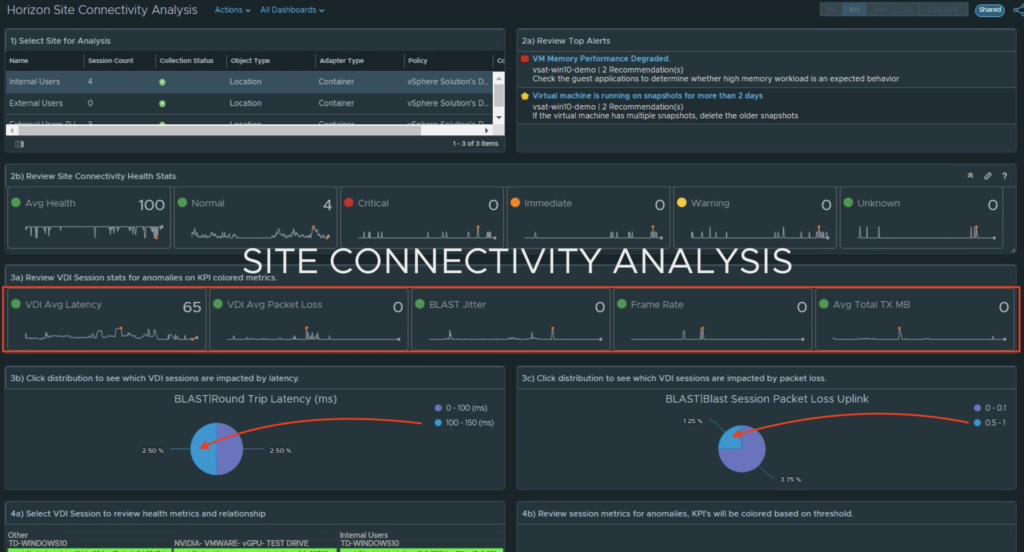
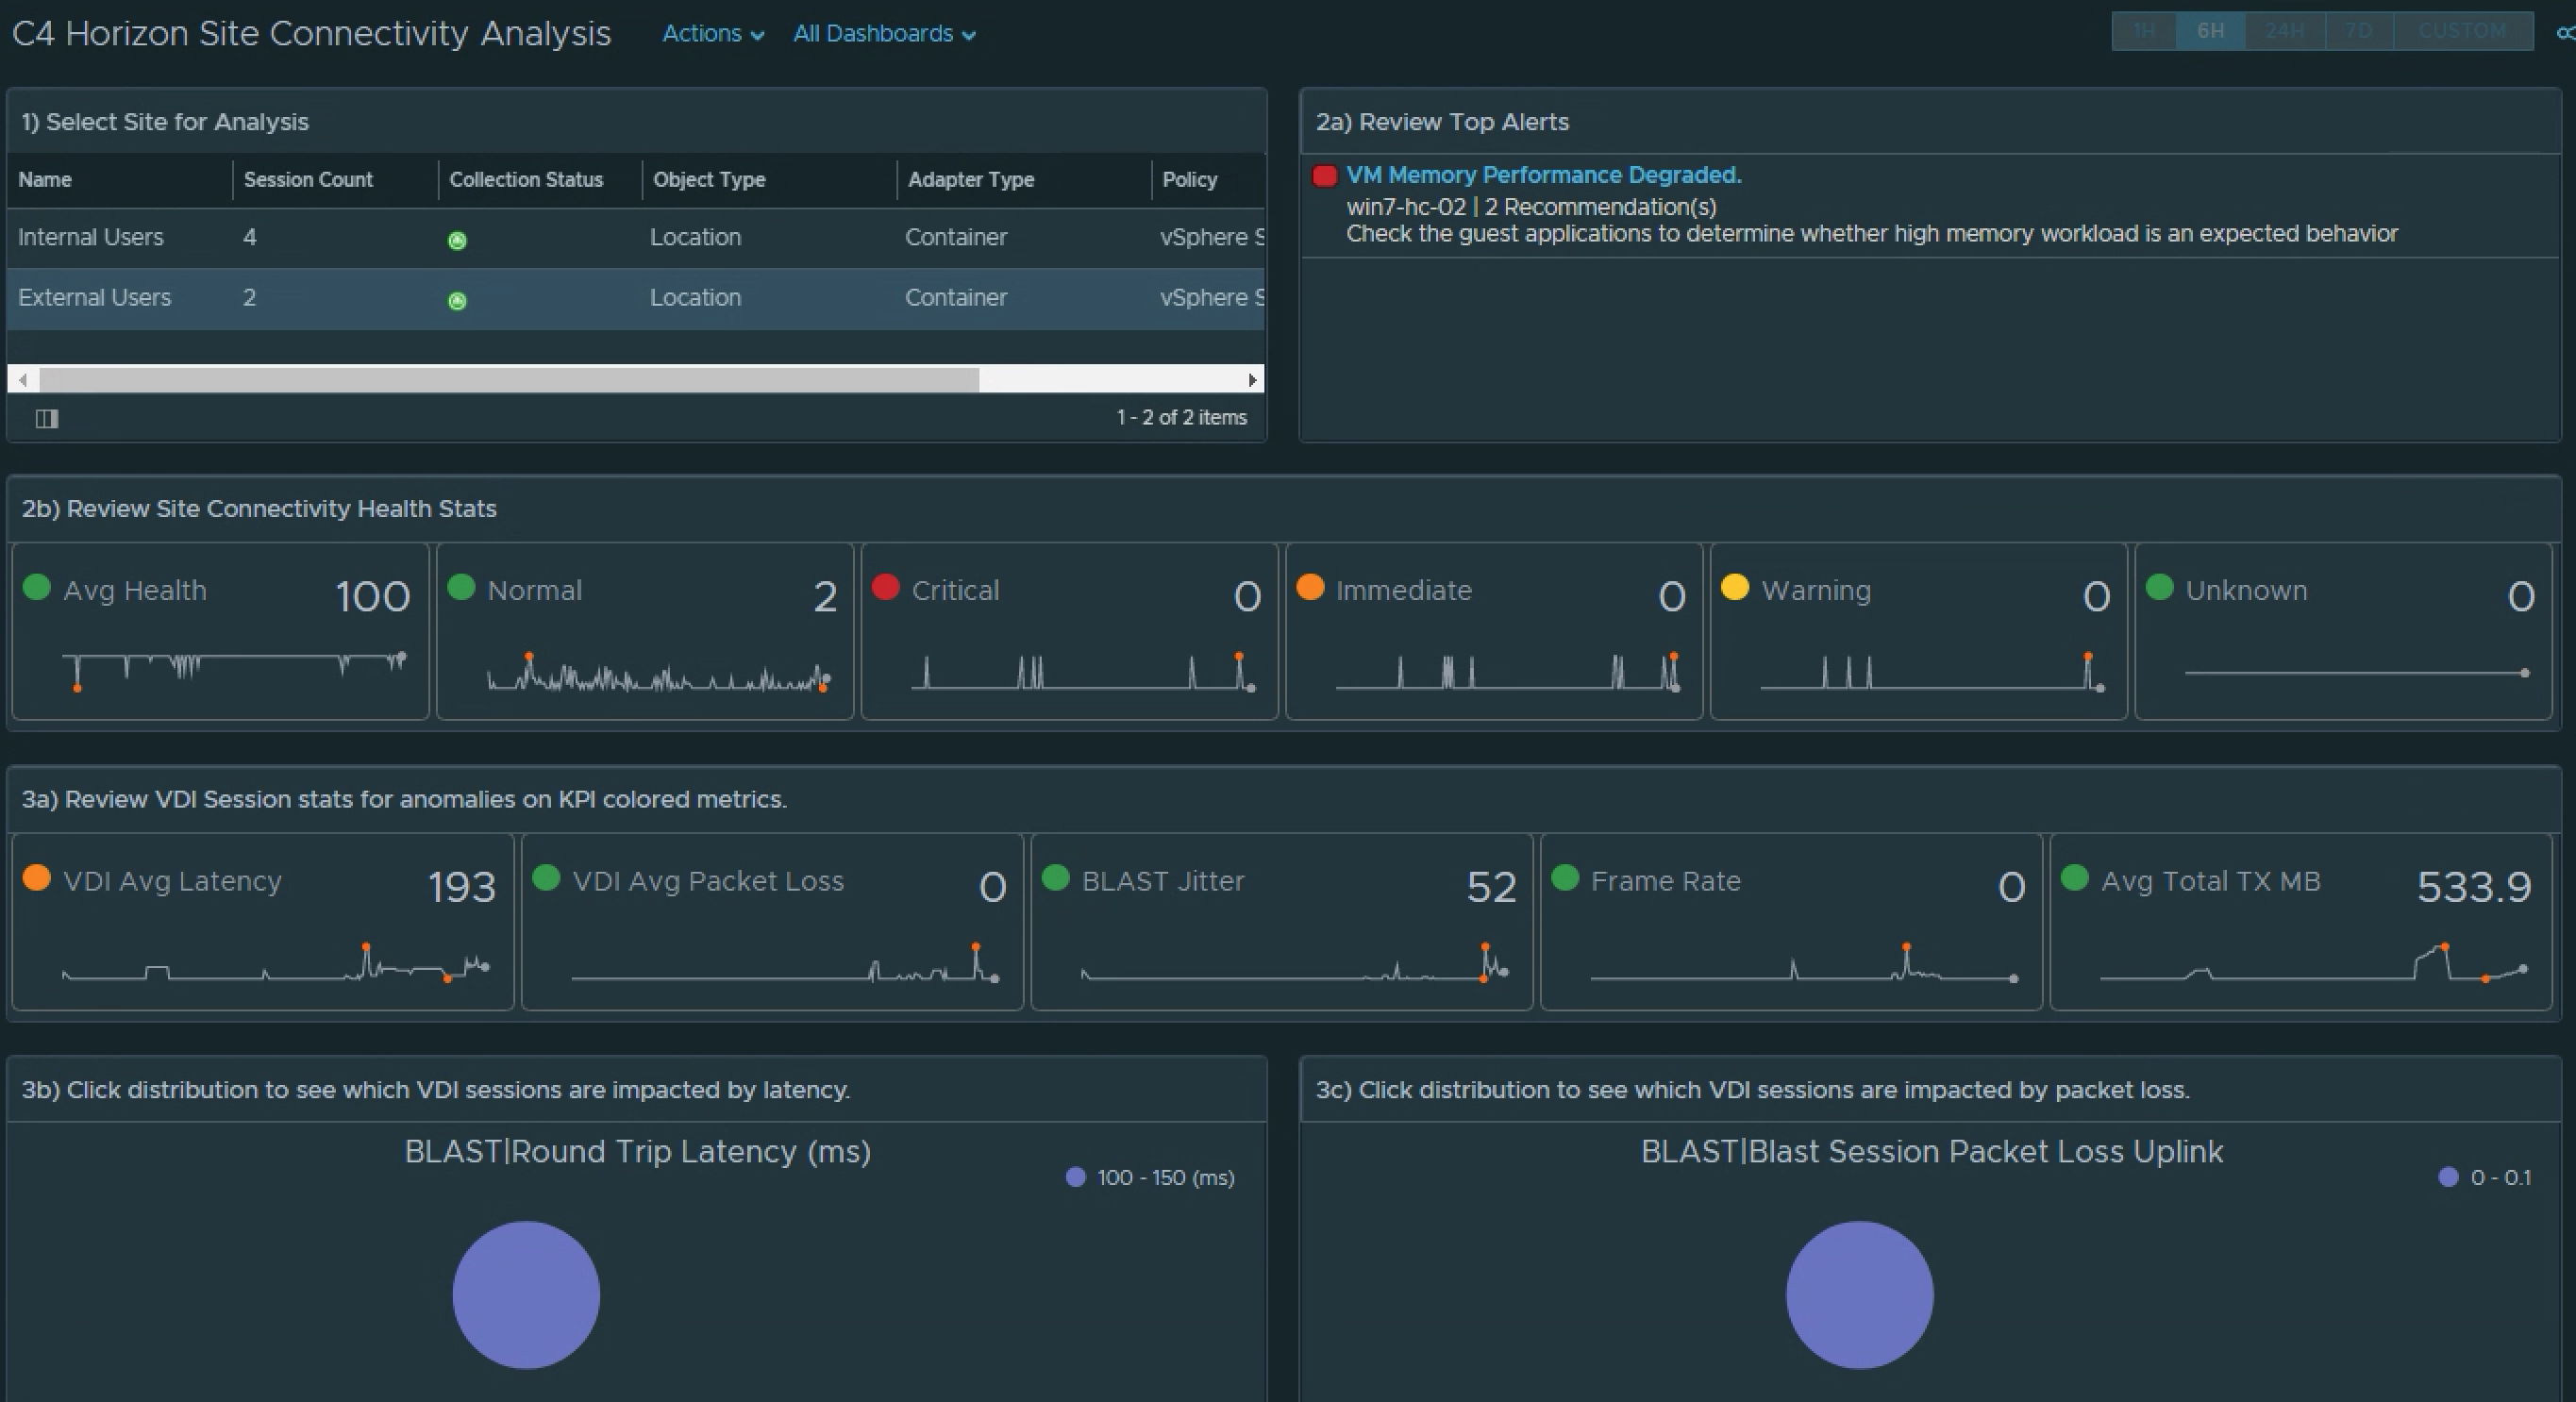
To do so, I’ve created a custom example Dashboard that allows you to select from the list of defined sites, and then display the relevant Alerts and Super Metrics that we defined on those sites. While you can choose to display the data in any manner you see fit, I’ve chosen to use a combination of Scoreboard, Distribution, and Heatmap widgets.
I’ve also chosen to label the widgets using an ordered numbering system with directions so that other users leveraging the dashboard will know how it’s meant to be consumed.
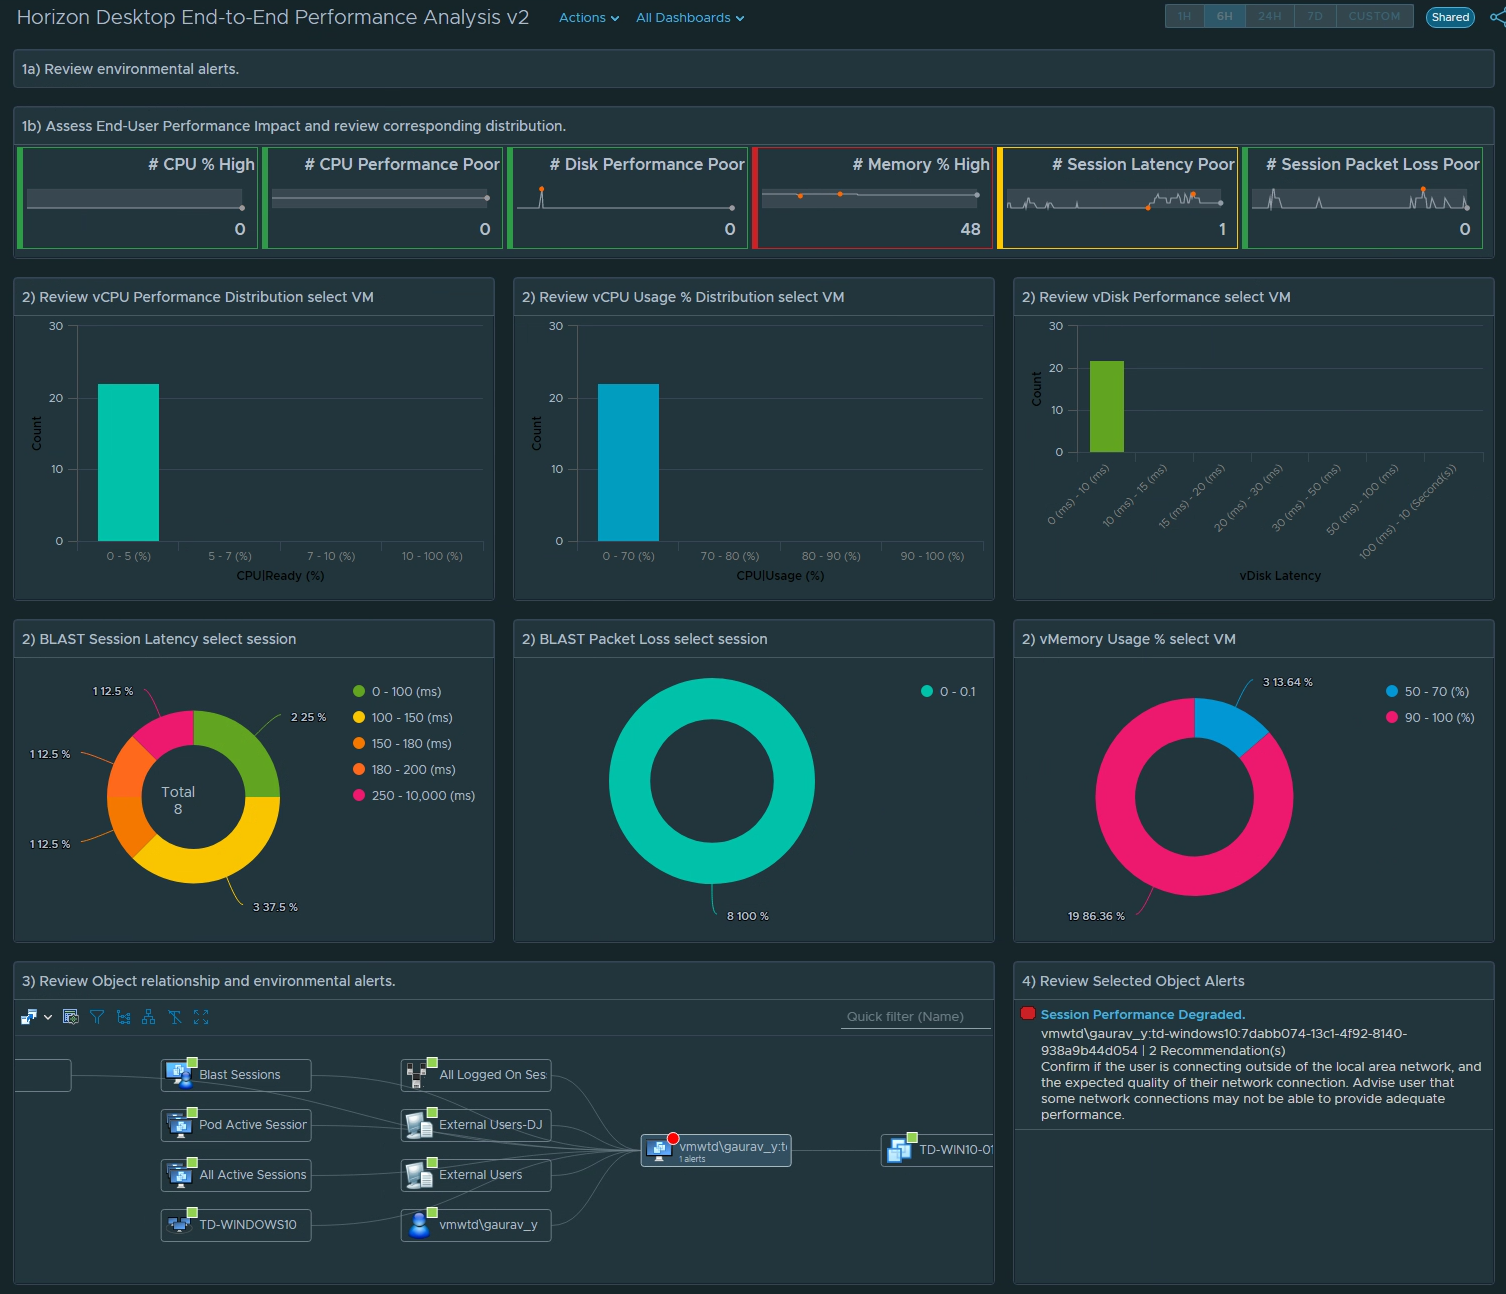
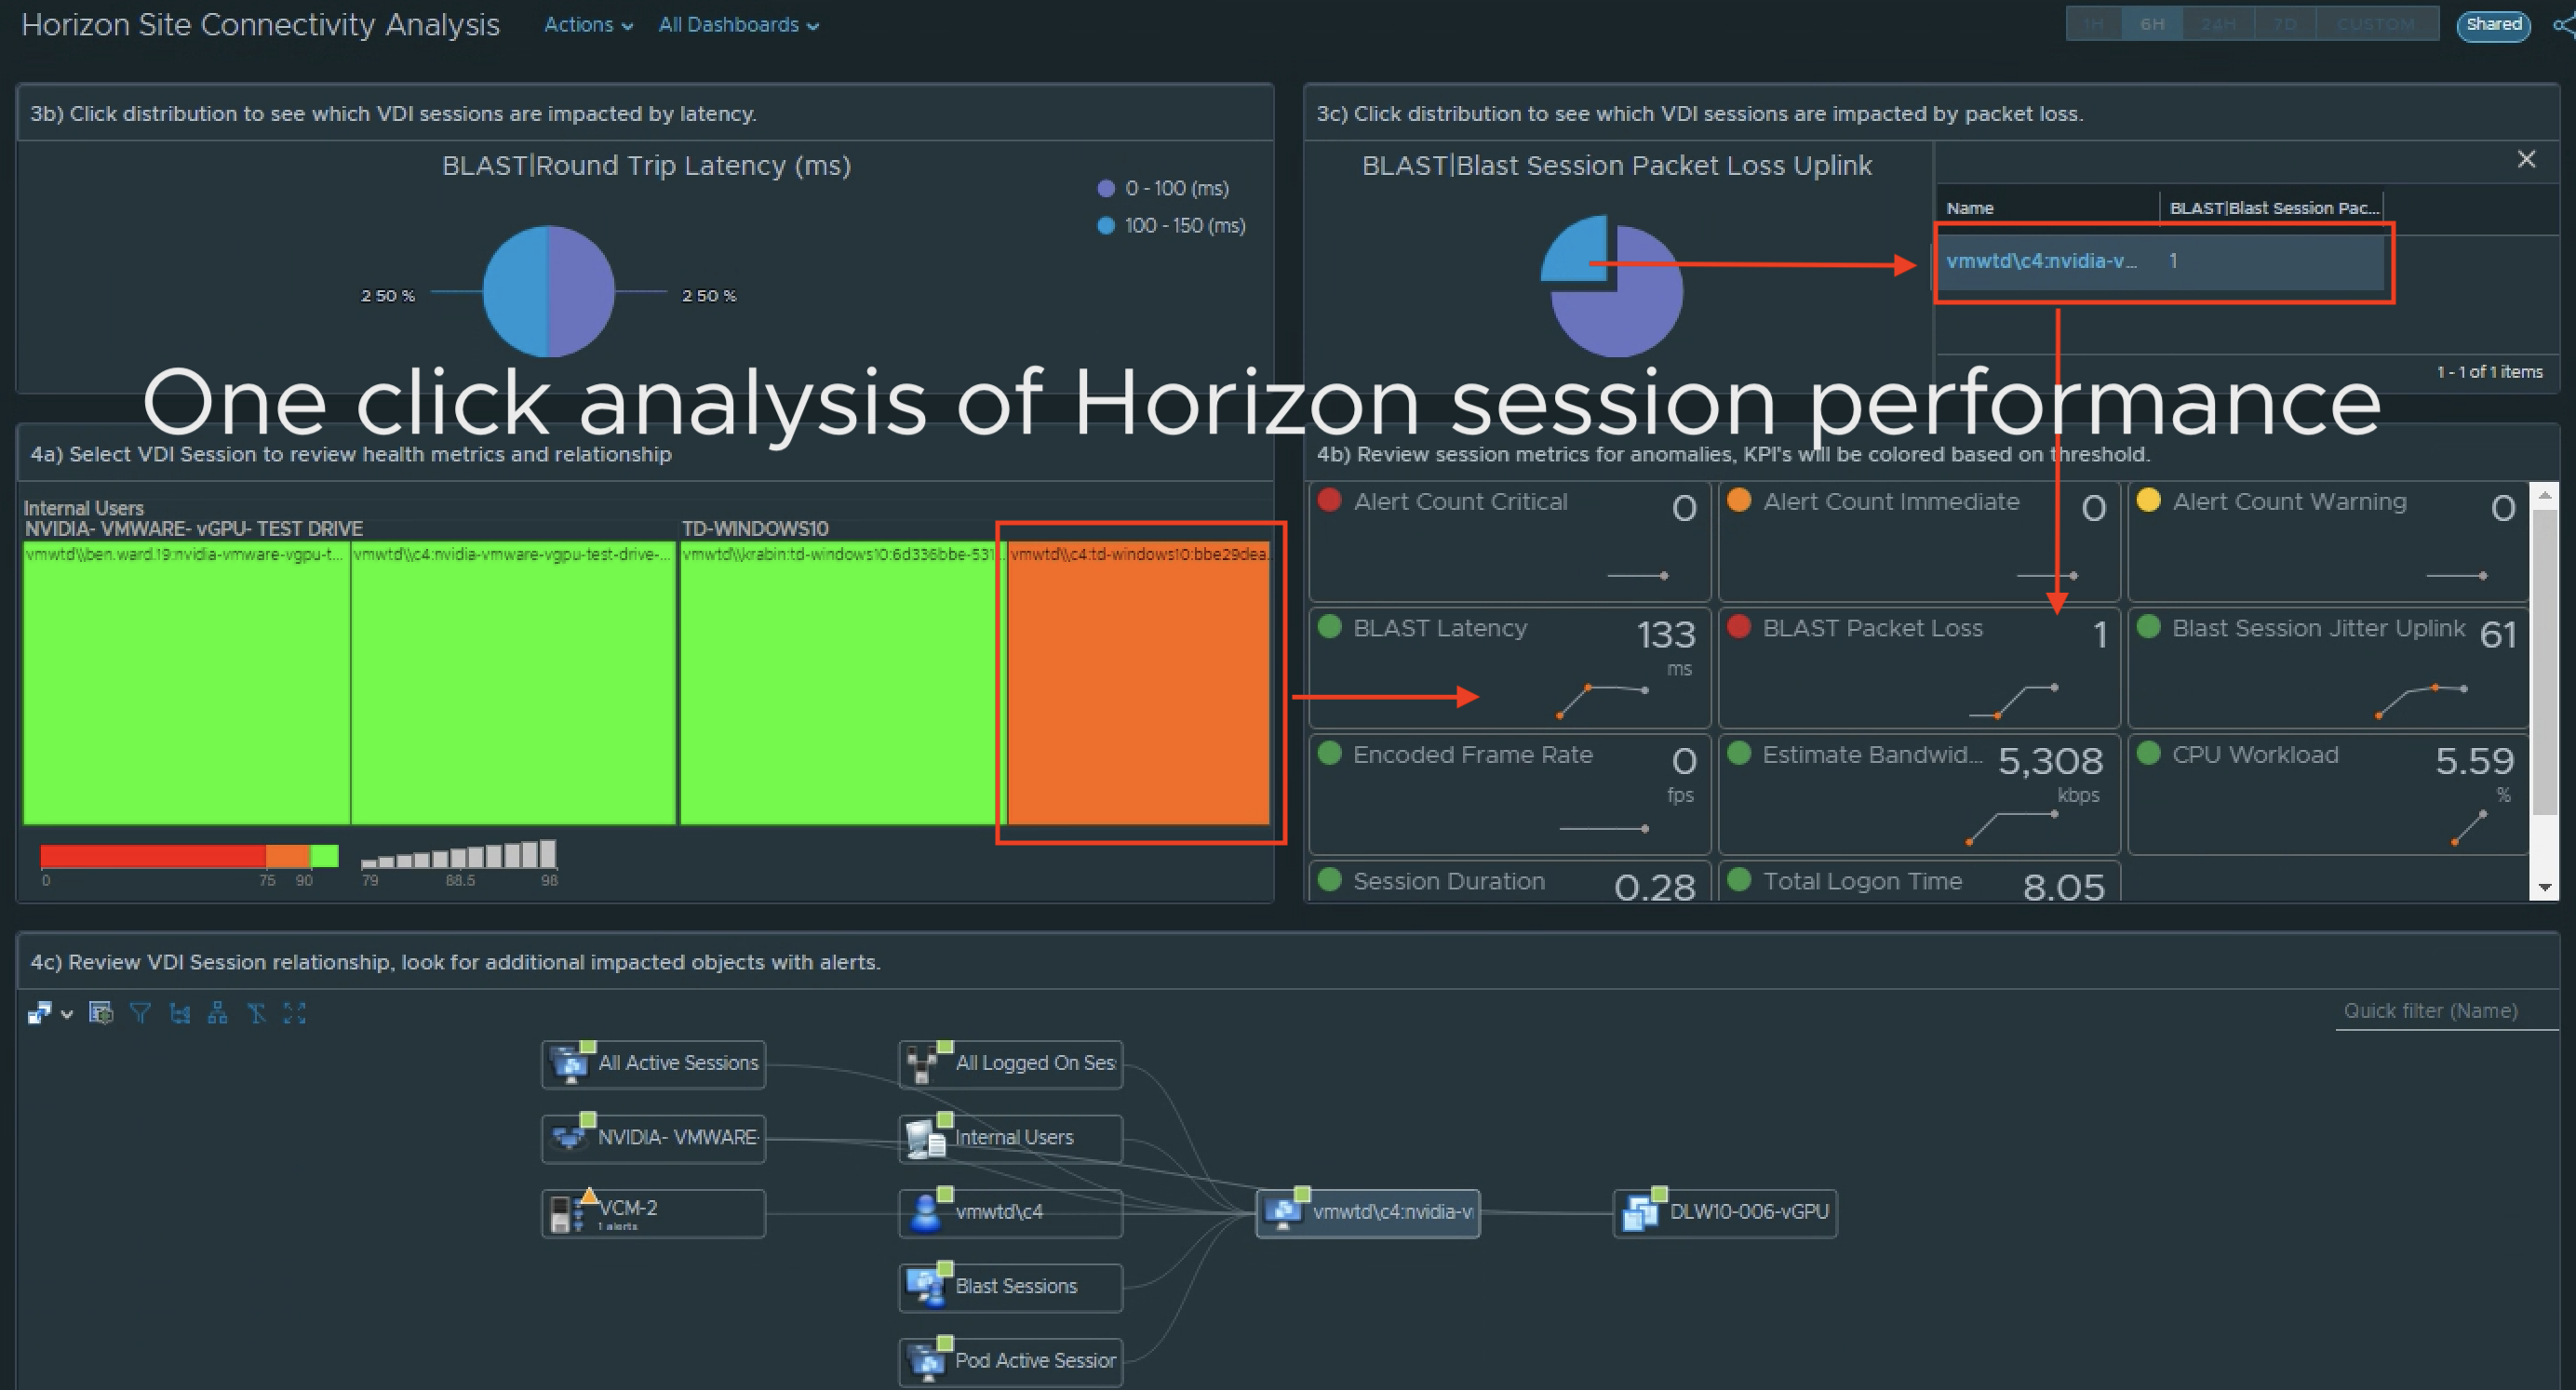
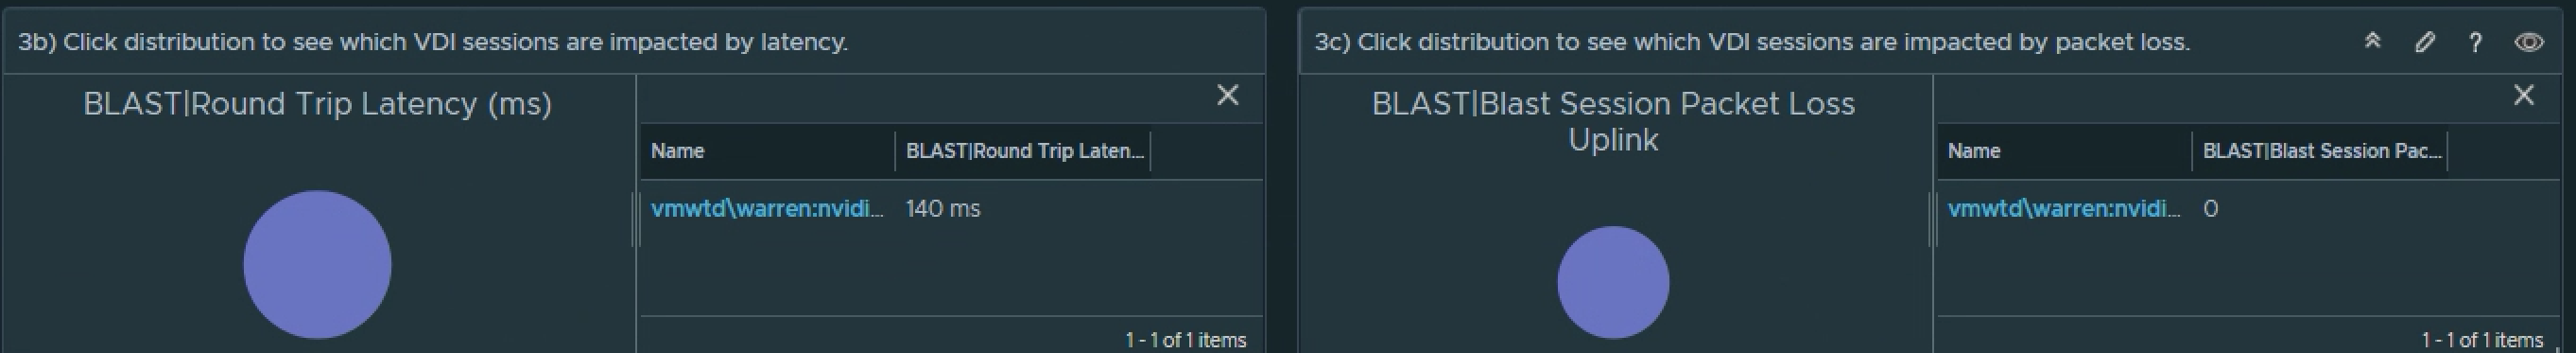
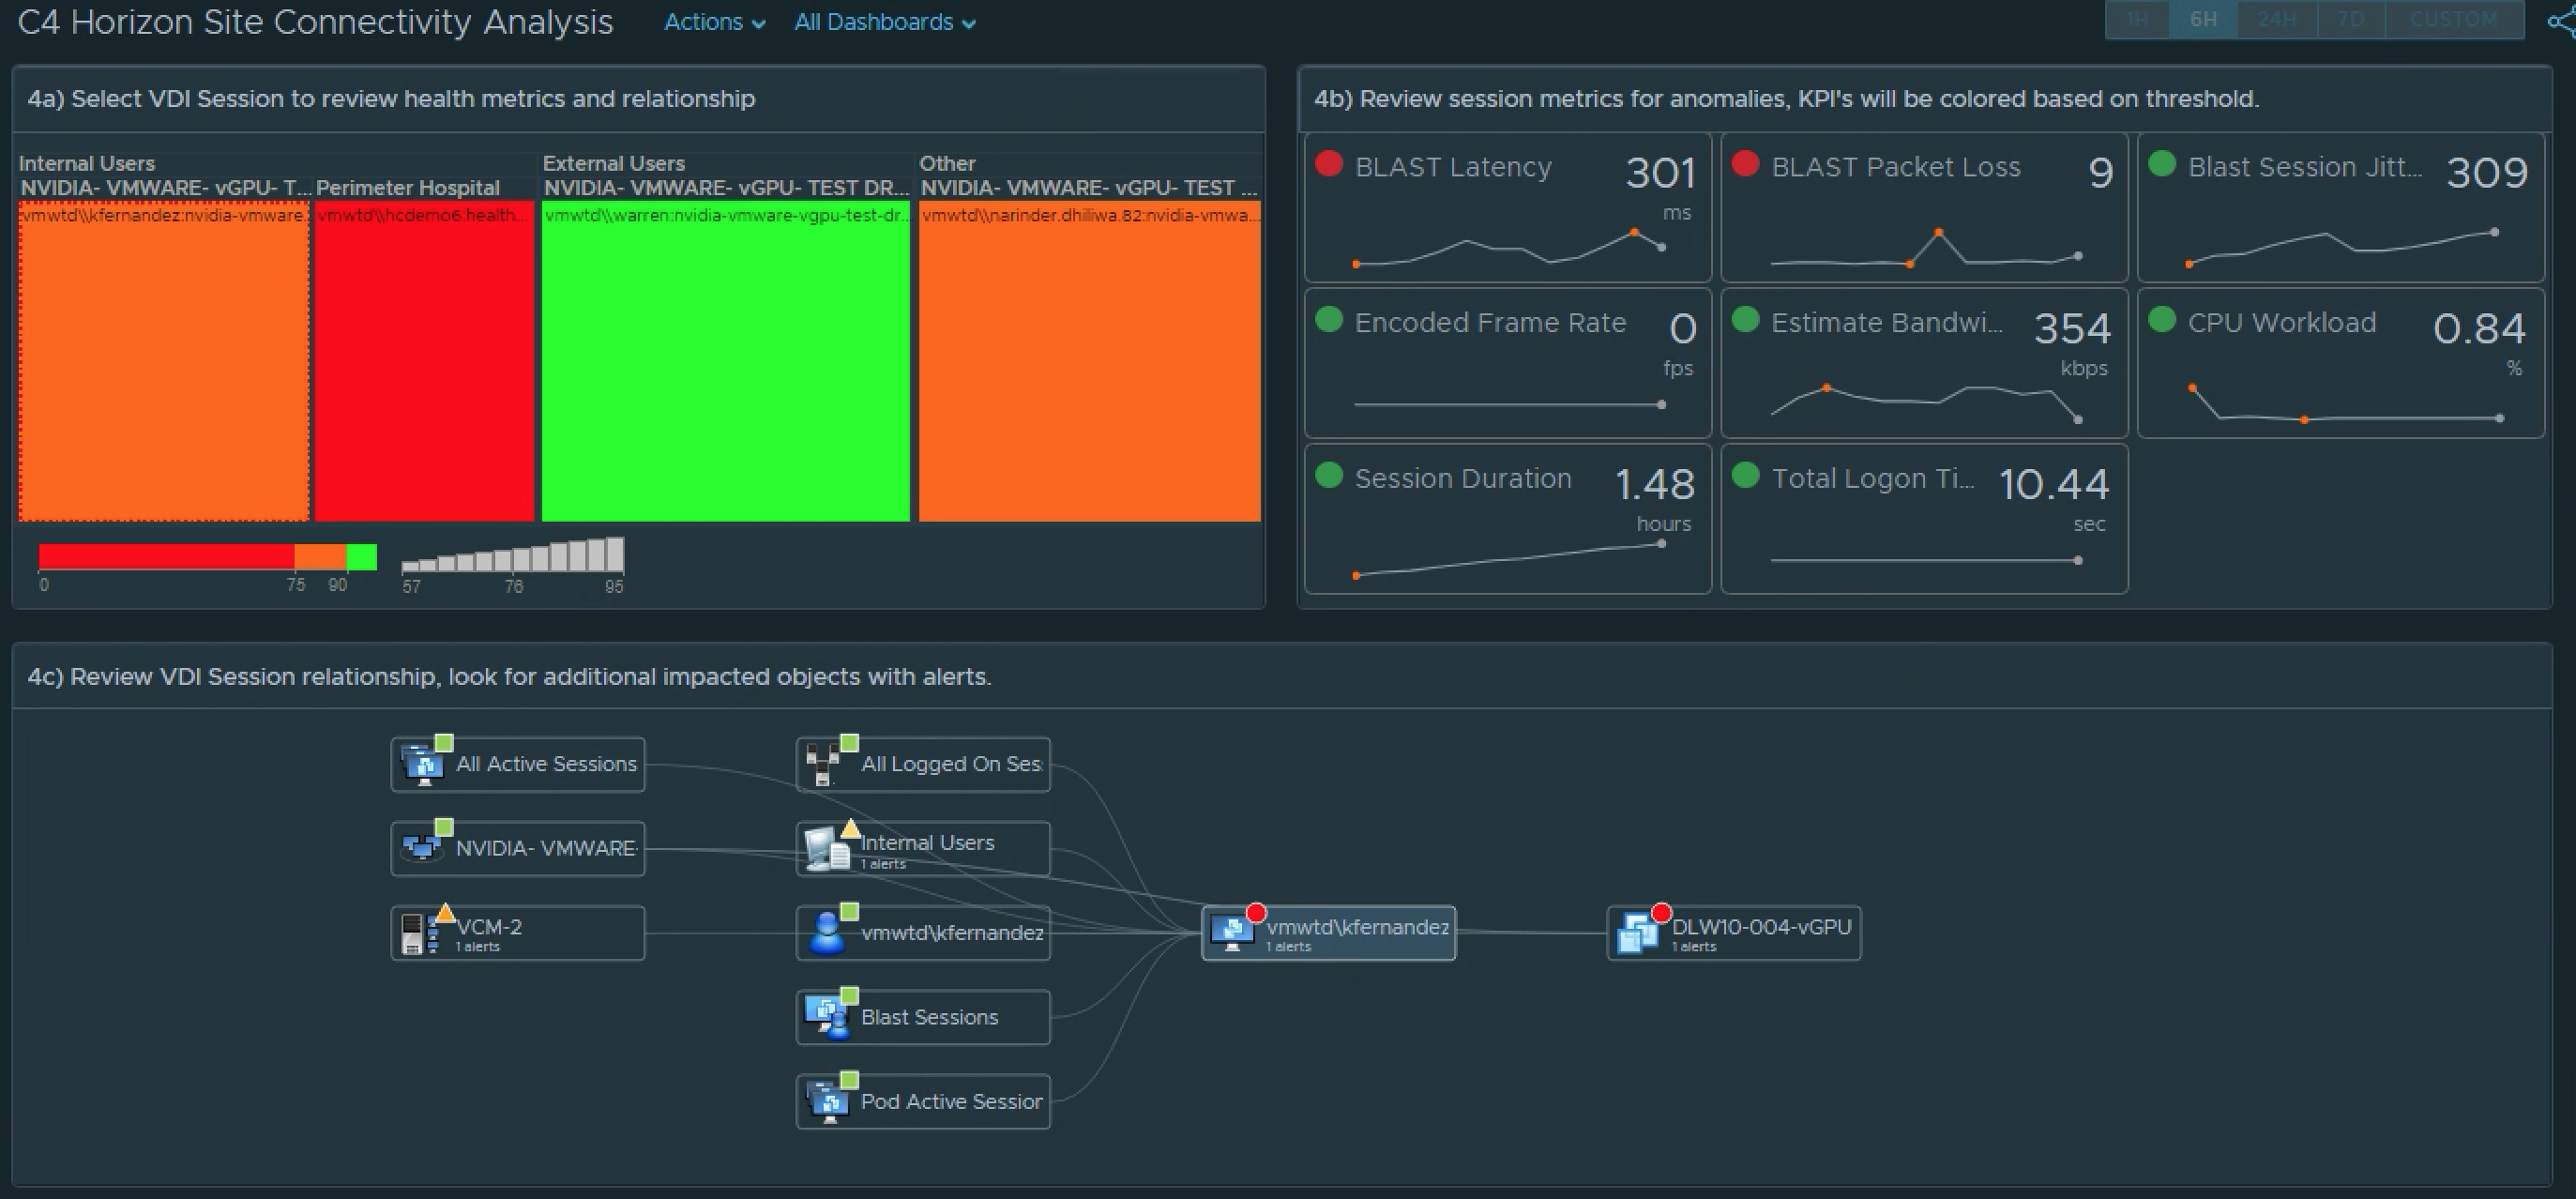
1) Select the site. 2a) Review the site alerts. 2b) Review the break down of criticality of alerts. 3a) Review Super Metrics that were created to analyze the site connectivity.3b) and 3c) Notice that clicking on a Distribution View will show you which session(s) fall under the defined performance “buckets”. 4a) Select a problem session. 4b) Review scoreboard of relevant KPIs impacting that session. KPI’s are colored to show level of impact to the user’s session. 4c) Review session related objects looking for other impacted objects with alerts.
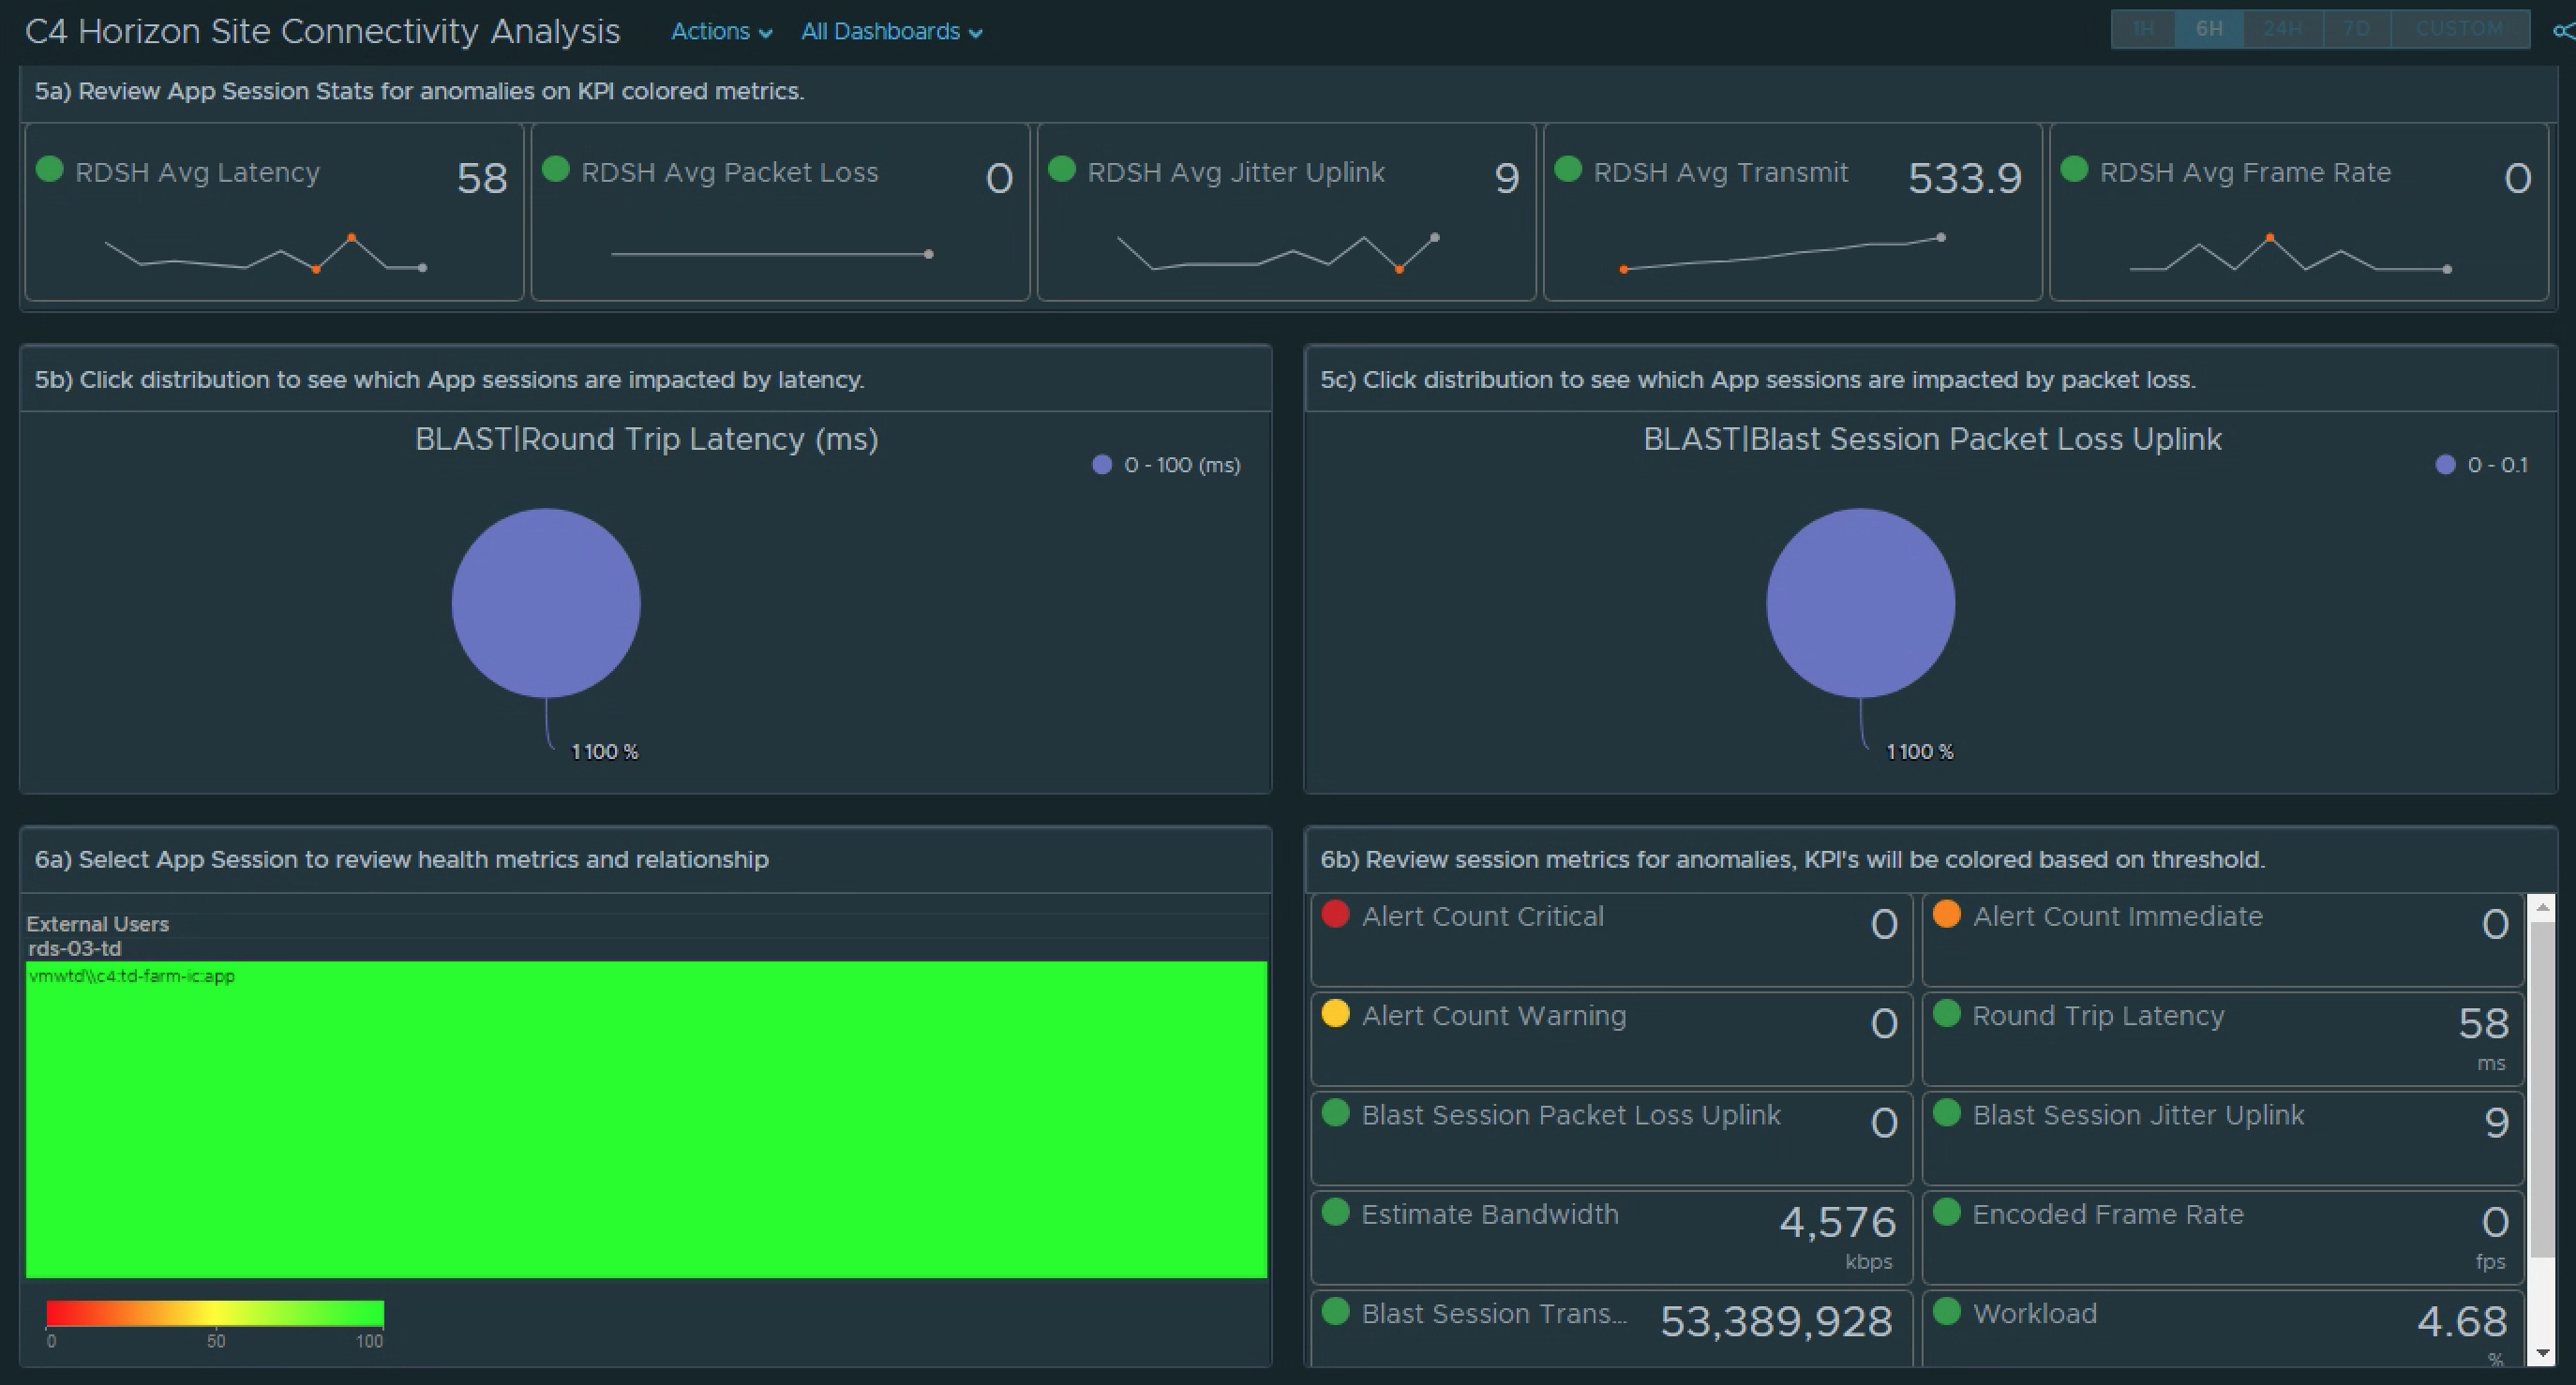
Continue your analysis of the Application Sessions if relevant for your site. The workflow will be the same as the above VDI Session analysis.
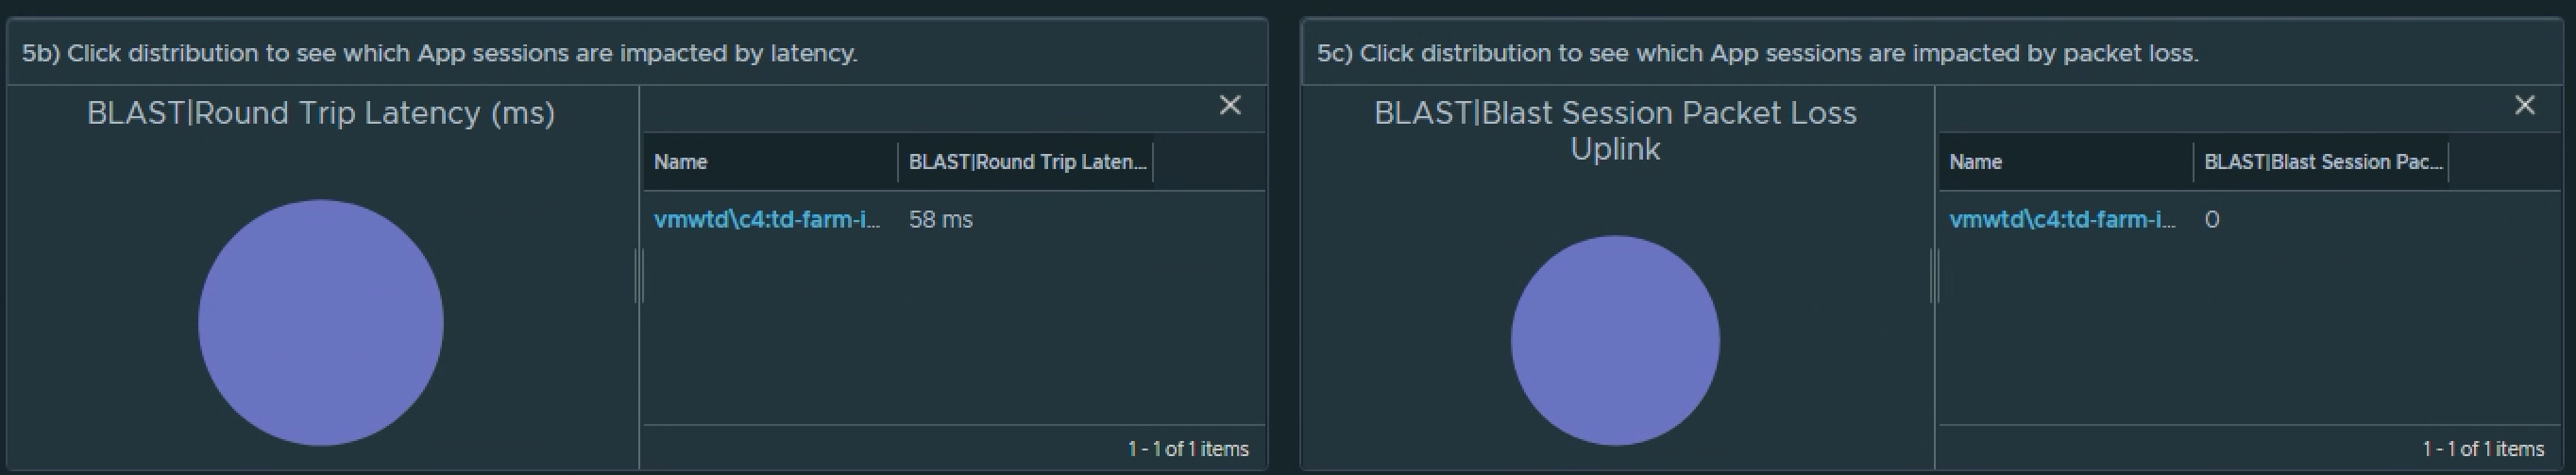
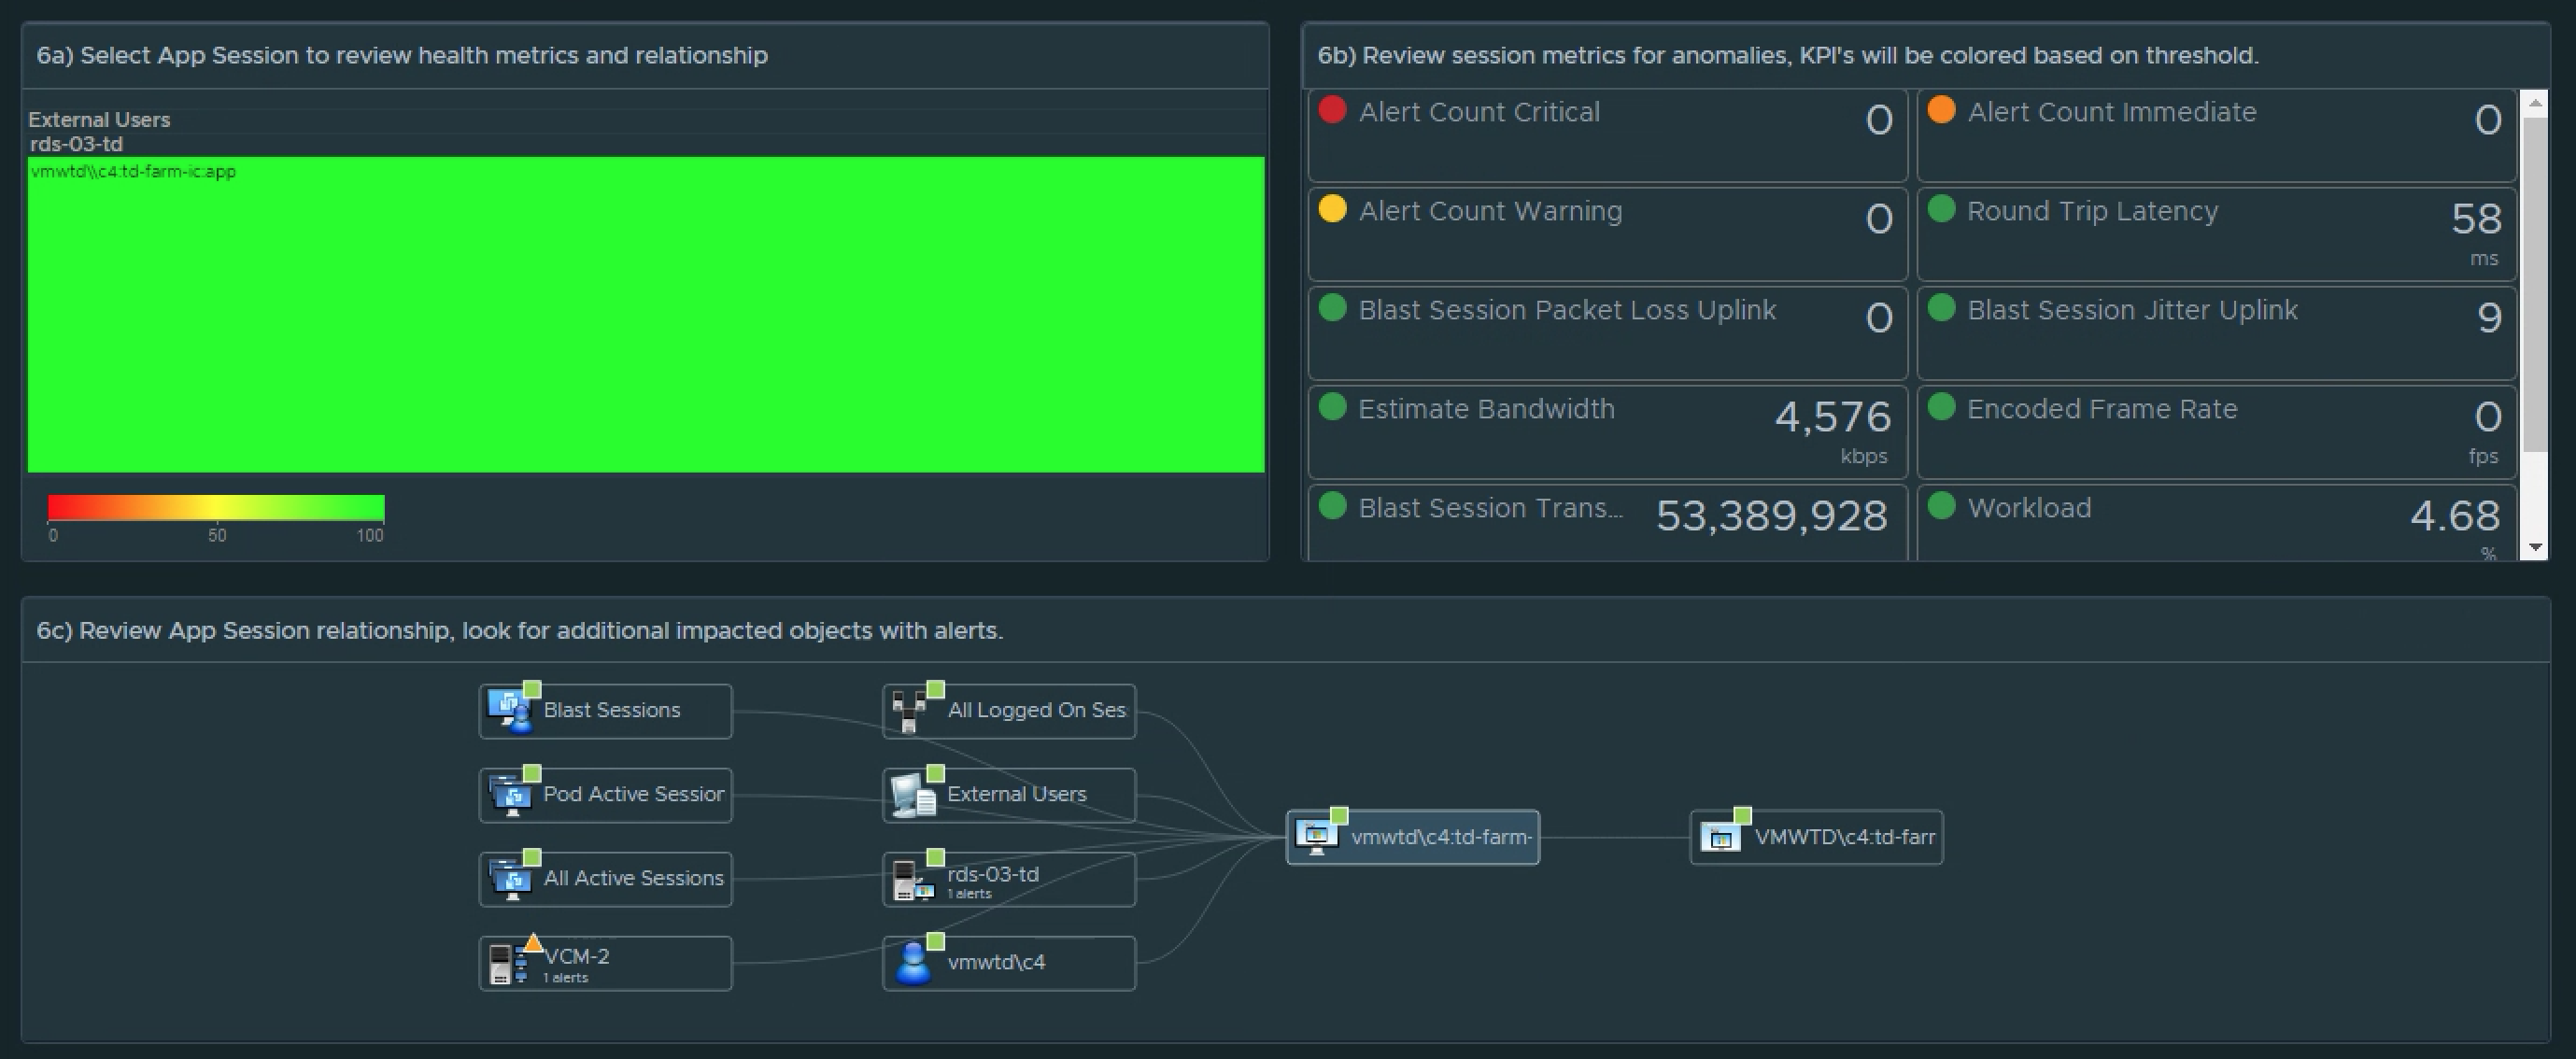
5a) Review the App Session Super Metrics for anomalies. 5b) and 5c) Clicking the Distributions will show you the session(s) the fall into each performance “bucket”.6a) Select the session you want to review. 6b) Review the Scoreboard metrics for offending KPIs. 6c) Review the session relationship chart and look for additional objects with Alerts that may be impacting the user session.
Next steps… Download and enjoy! 🏁
Now that we’ve discussed how to create the content and the high-level strategy for performing the site connectivity analysis, it’s time to download and import the content . The zip file provided in this blog contains all of the content that is required to create the custom dashboard, except for the step on creating the custom group locations. That step will still be required for you to define what “Sites” you want to monitor for connectivity performance.
Contents of the zip include a Dashboard_Horizon Site Location Analysis.zip, Views_Horizon Site Location Analysis.zip, and Supermetric_Horizon Site Analysis.json. All of which need to be imported and at least one Location group defined before the Dashboard will function properly.
Enjoy! Please provide thoughts or feedback on how to make the dashboard and content better.
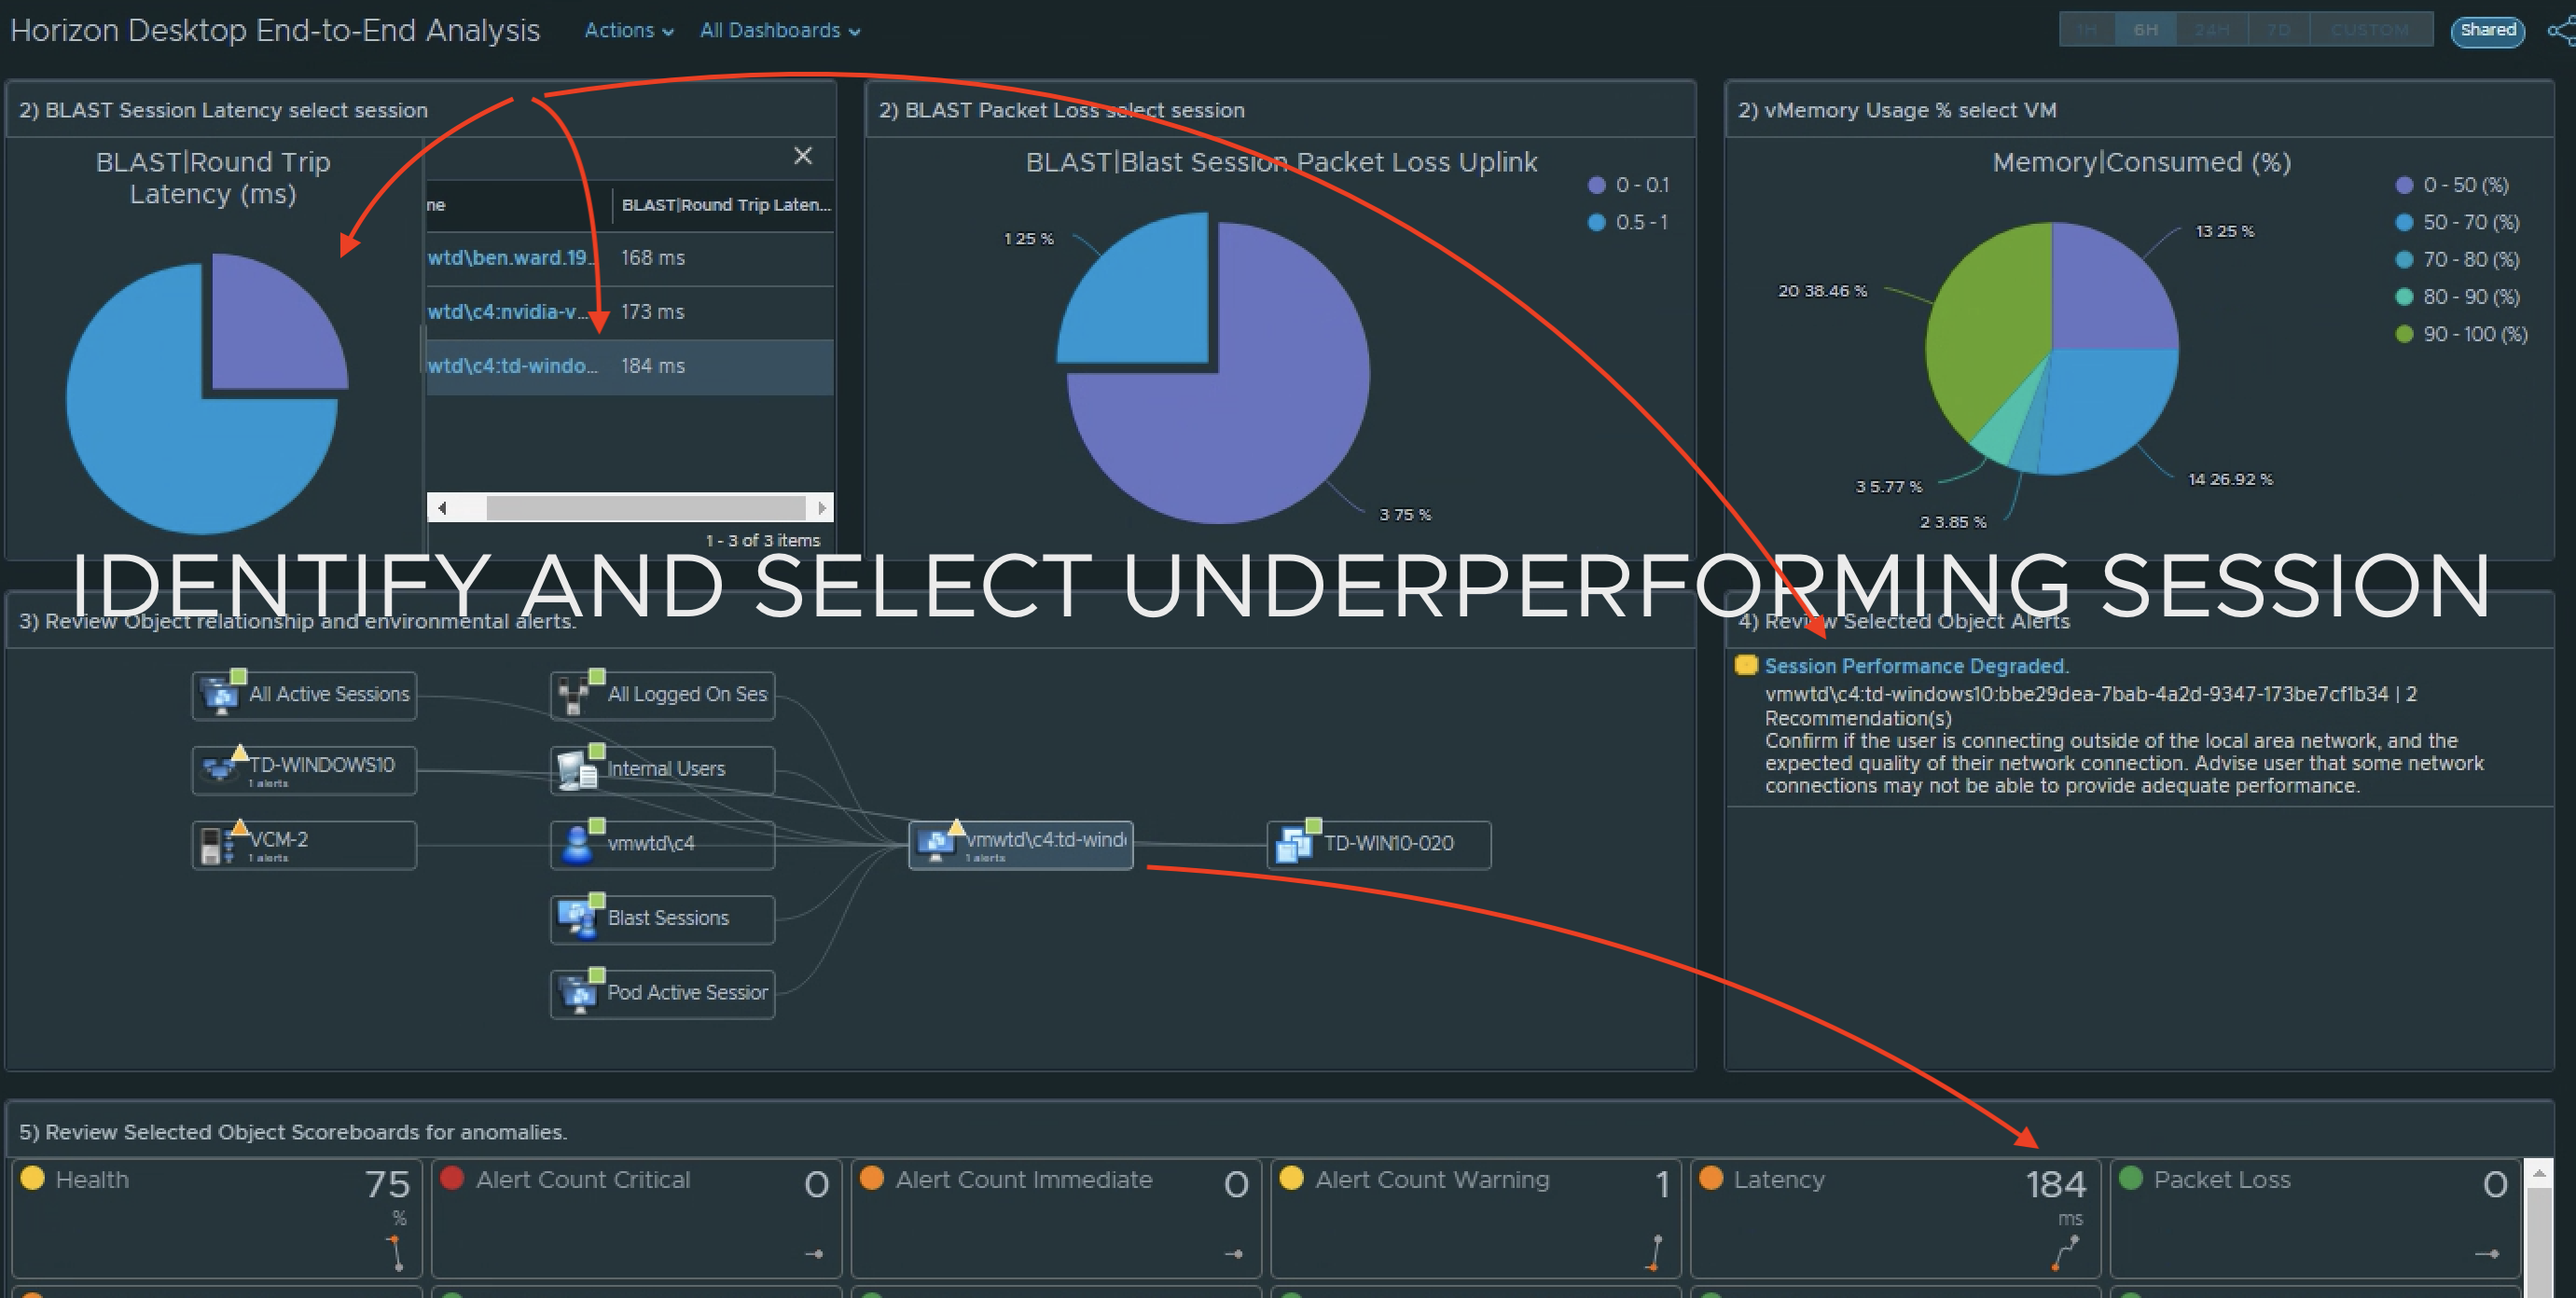
VROPs for Horizon provides end-to-end visibility into key User session statistics that make it easy for Horizon admins to visualize and alert on performance problems impacting the user’s of their environment. One of the key metrics used in determining how well user’s are connected to their virtual app or desktop session is Session Latency (ms), as it most visually impacts the user’s perspective of their session performance. The lower the session latency, the quicker video, keyboard, and mouse inputs are redirected to and from a user’s endpoint client, giving the user a more native-like PC experience.
As the latency trends higher (>180ms), the experience begins to degrade, and the user can begin to notice “sluggishness“ – slow keyboard, mouse, and video responsiveness.
VROPs for Horizon gives us direct visibility into when these issues are occurring across all of the Active User Sessions of the Horizon View environment. However, once the session becomes inactive, it will go into a stale object state and be removed from vROPs during a clean-up window.
To be able to view this information historically on Pools and User objects, you can create Super Metrics that simply maps the session latency to the objects you want to report on.
Creating the Super Metric
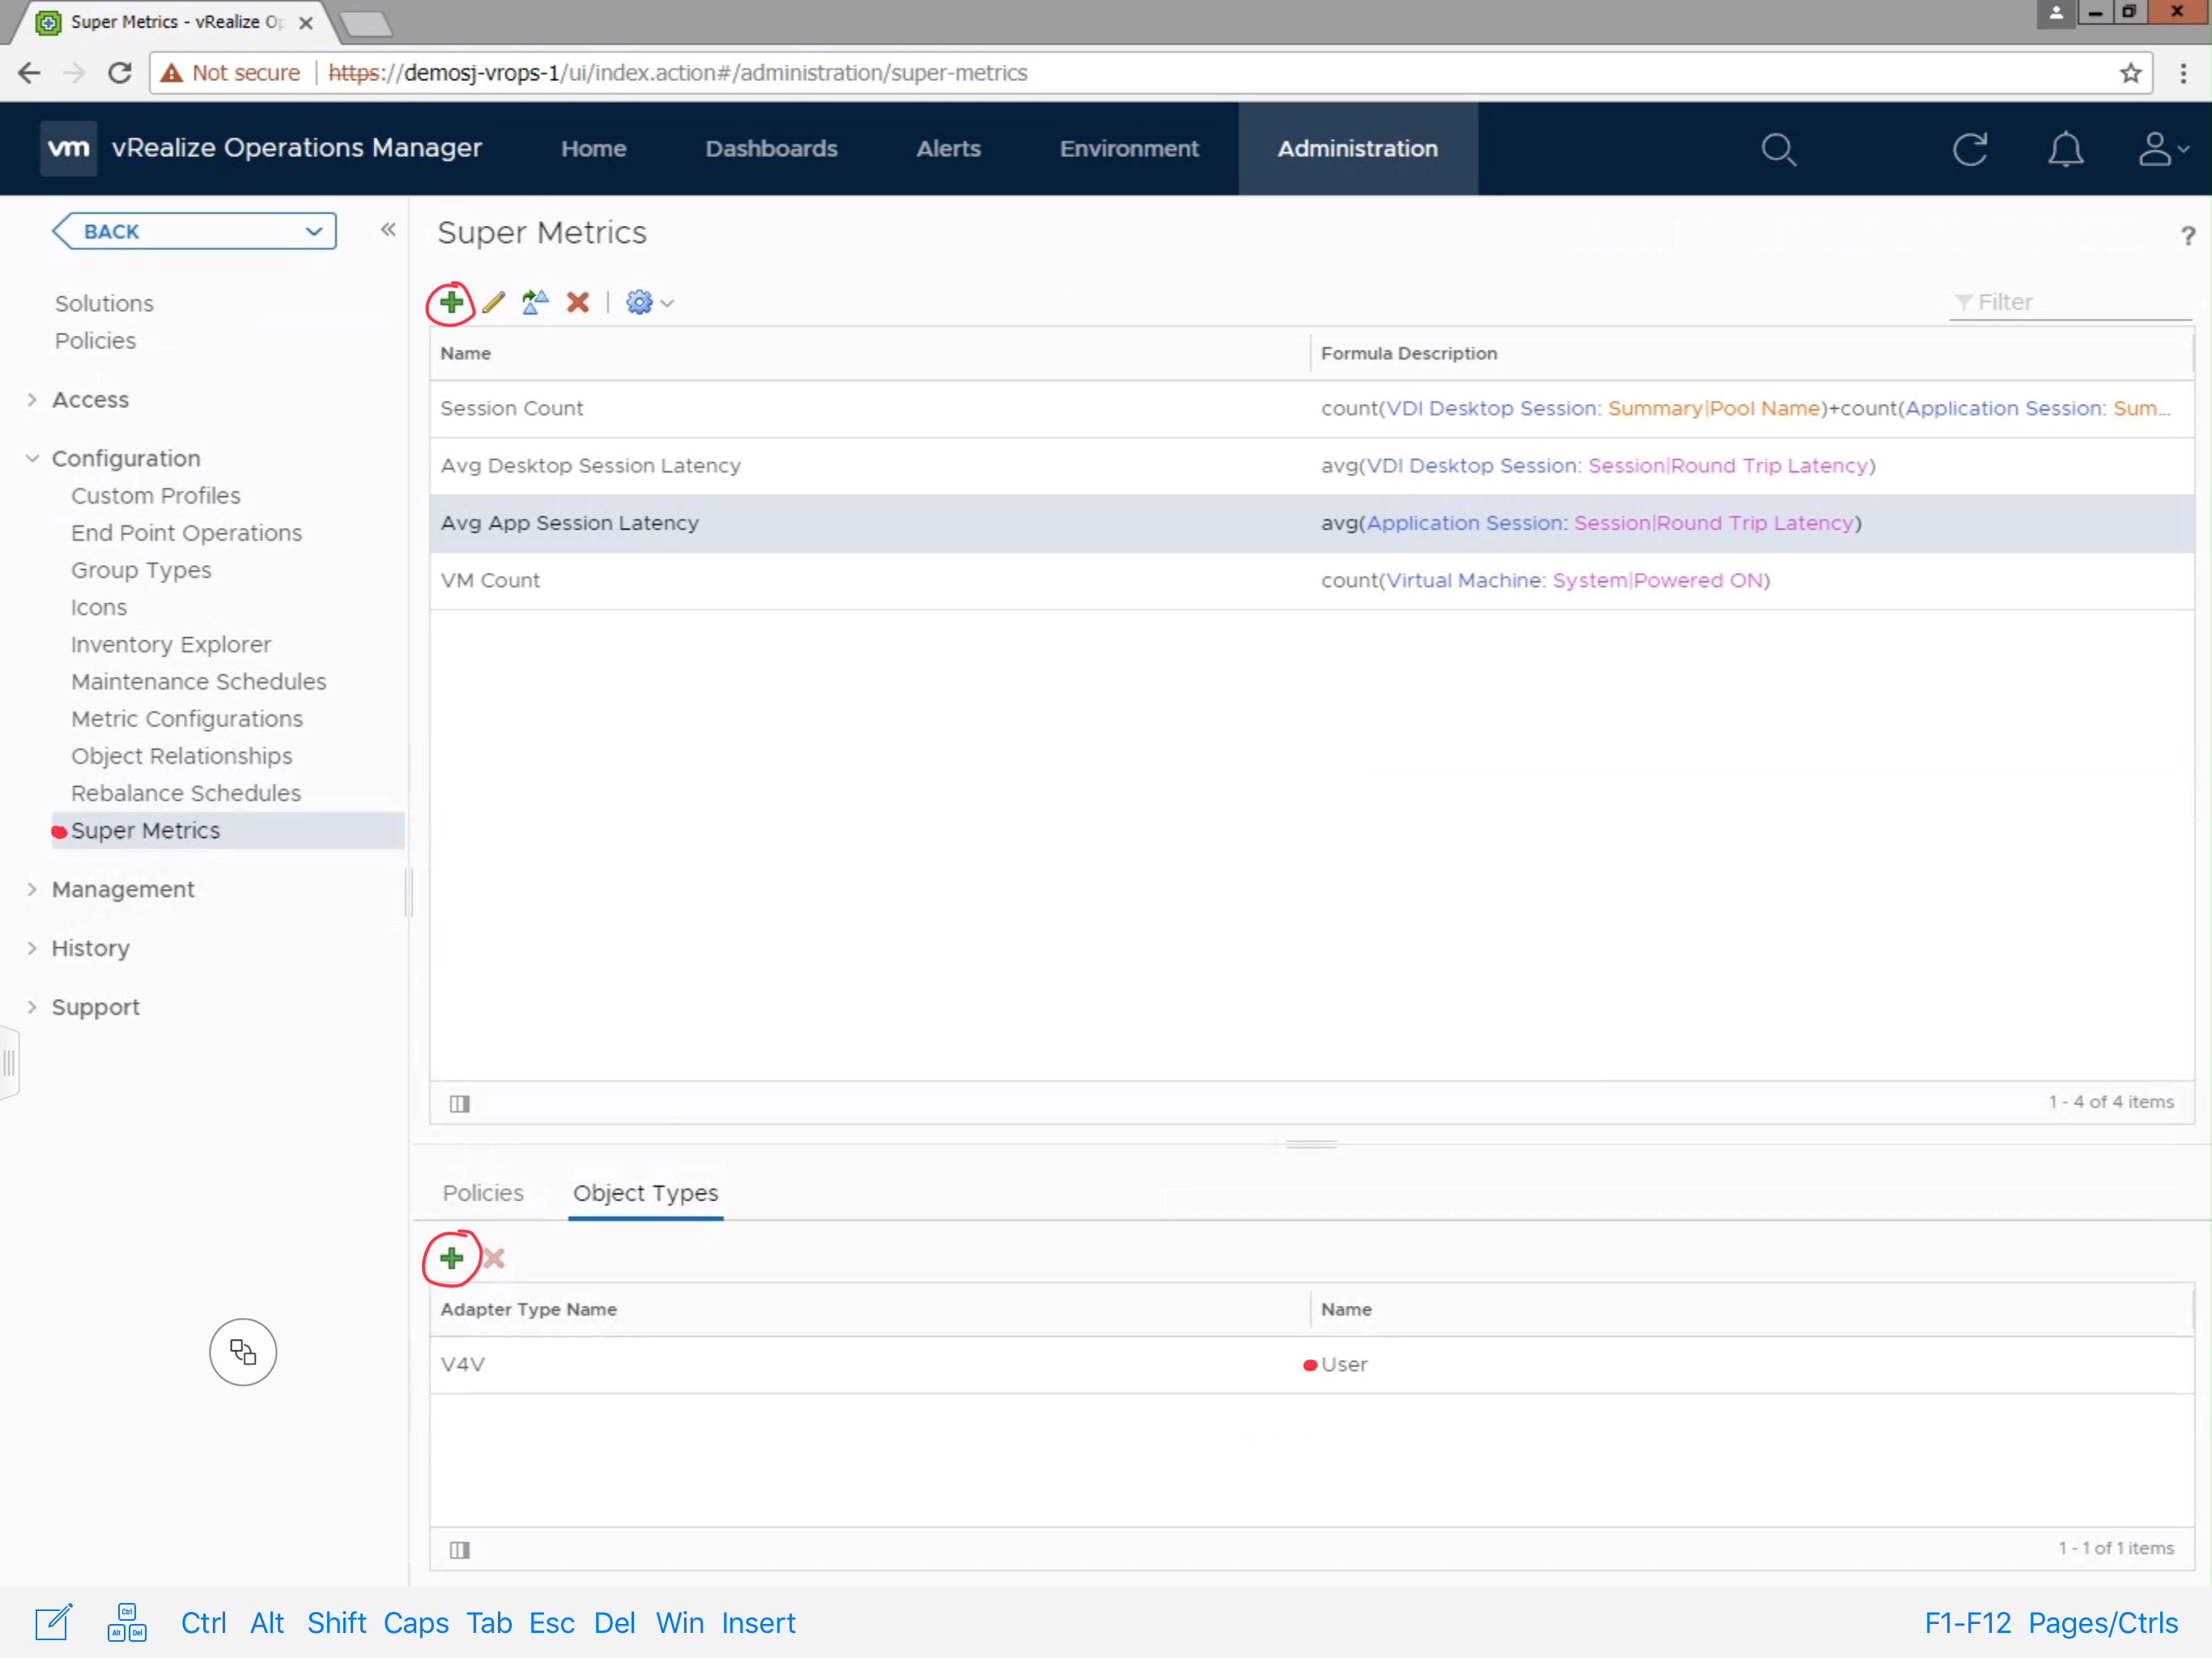
To create the Super Metric, Navigate to Administration -> Configuration -> Super Metrics. Click the green + sign to create a new Super Metric.
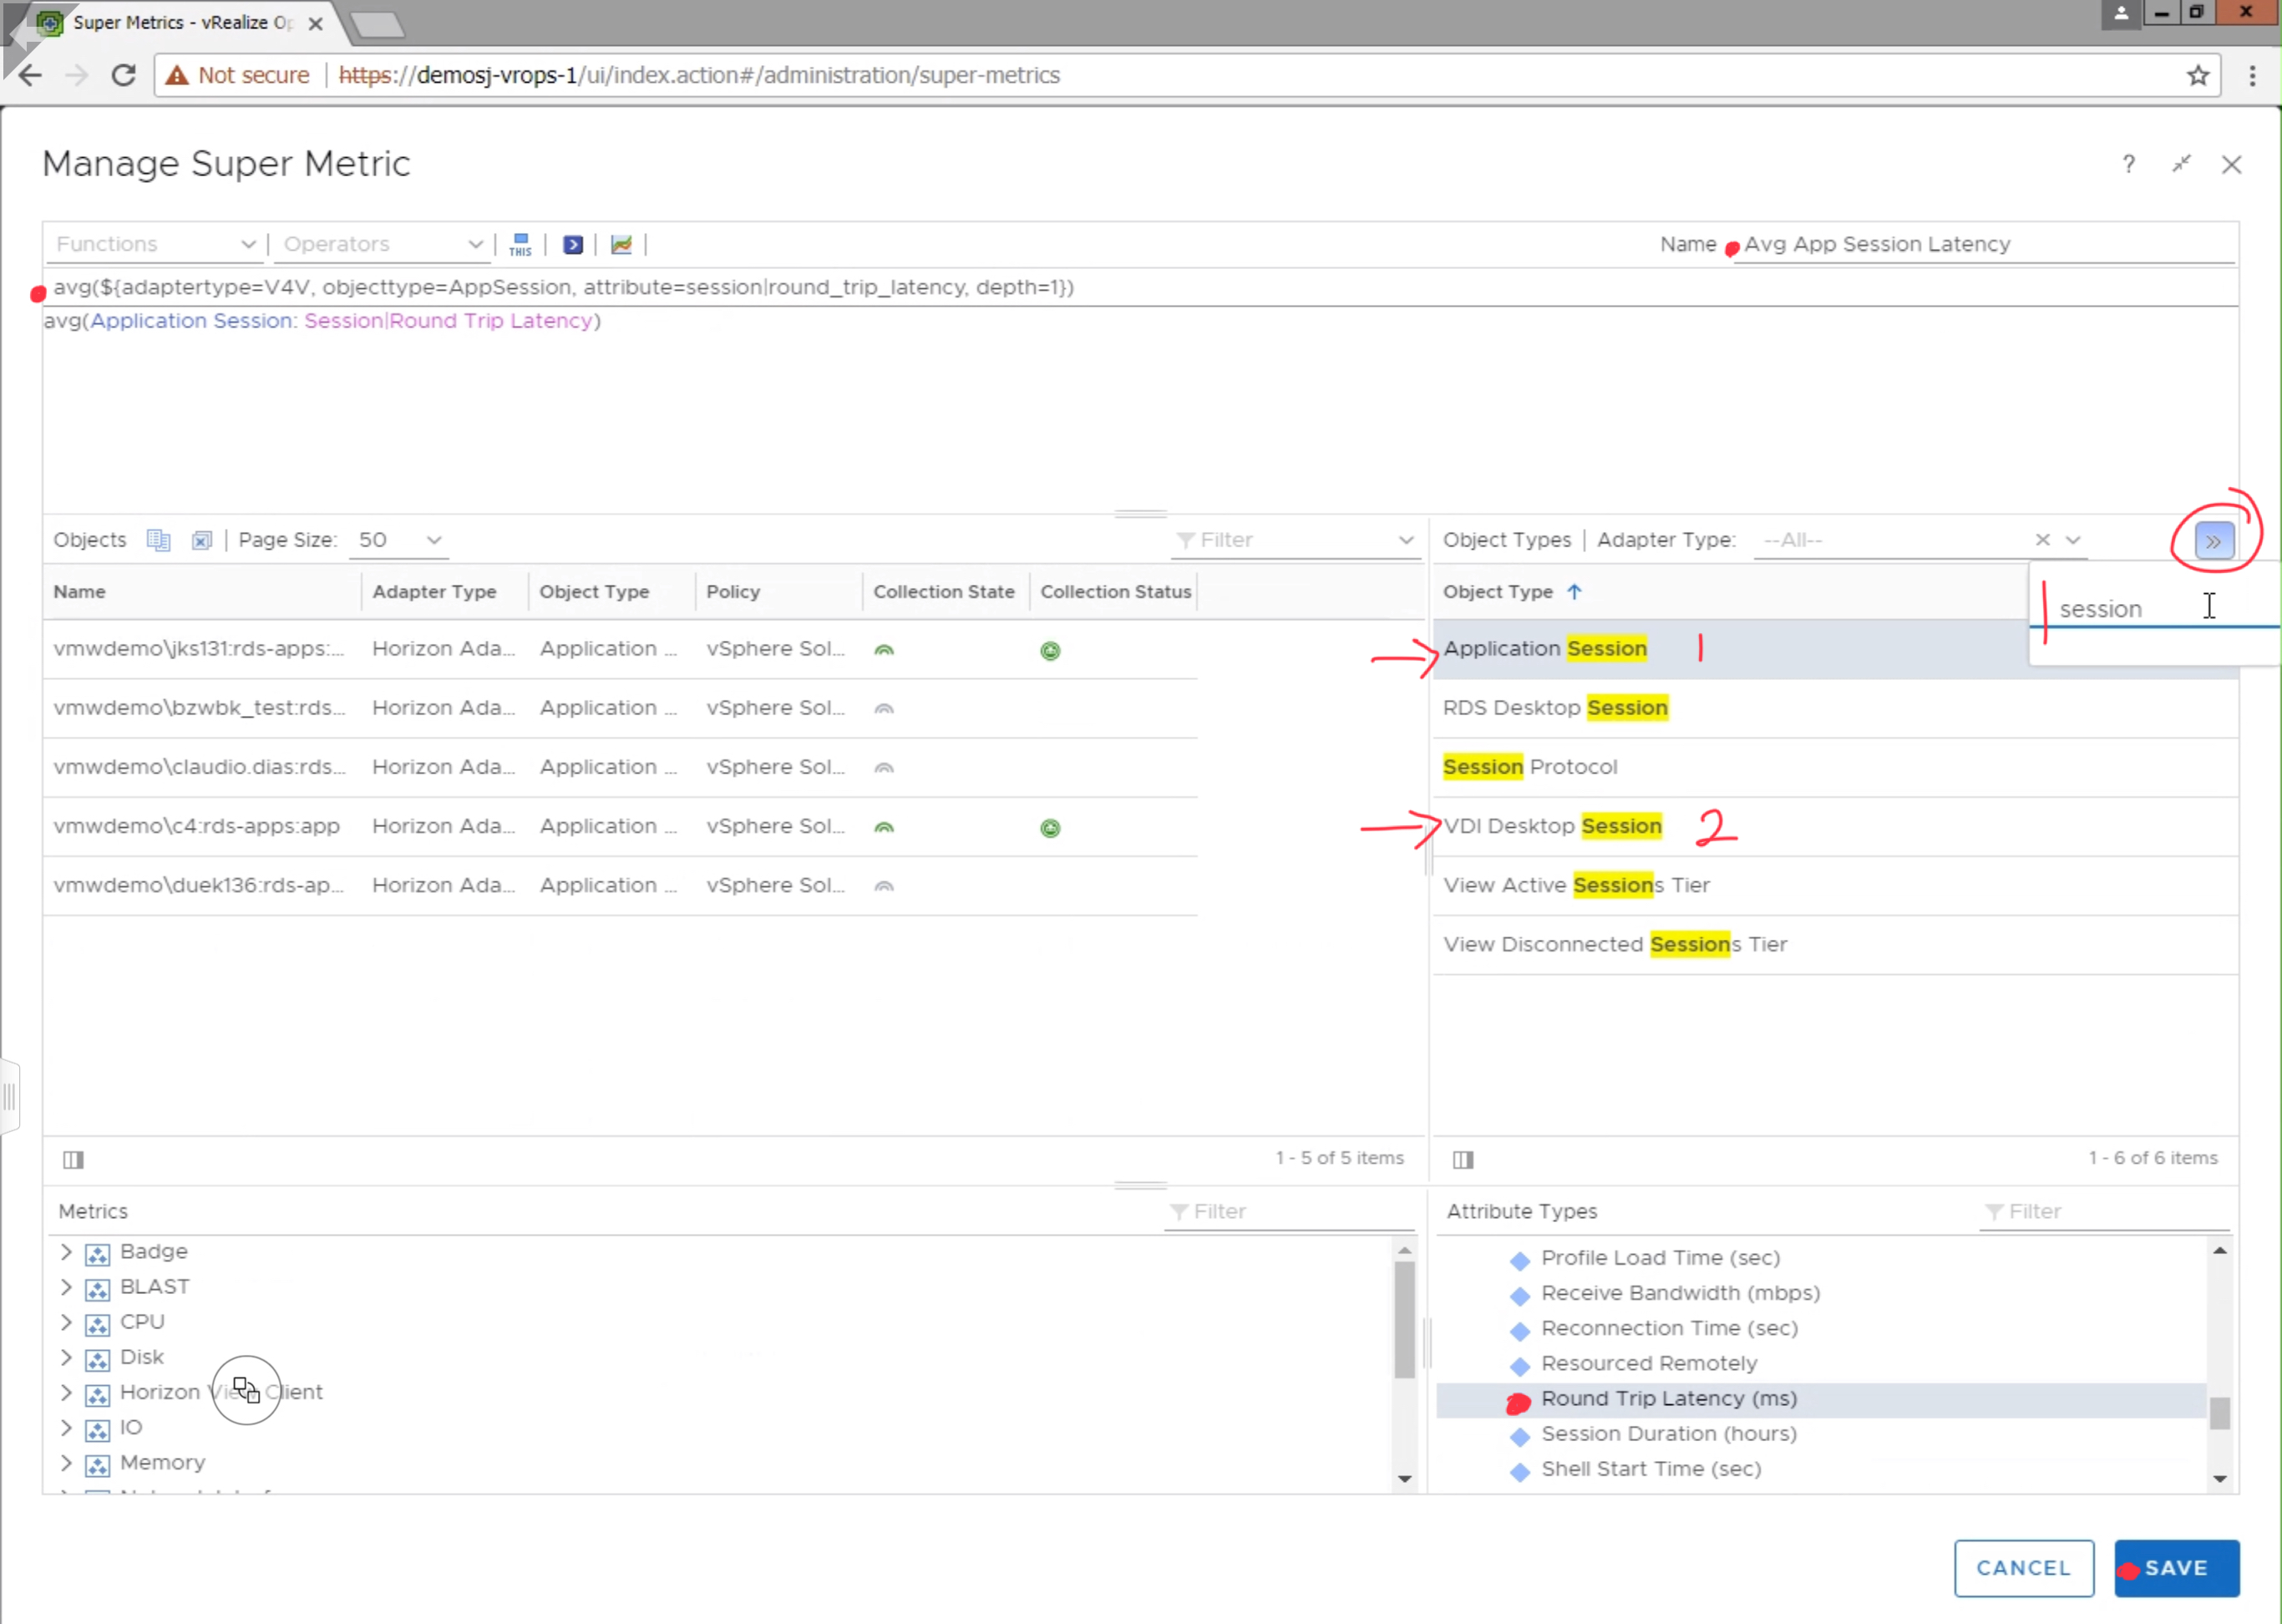
Provide the Super Metric a unique name, in this case we are using “Avg App Session Latency”. Search for the “Application Session” Object Type, and click “Round Trip Latency (ms)” to add it to the Super Metric. Since, we are looking for the average latency, select “avg” from the available functions list, making sure that the average function applies to the metric by encapsulating it parenthesis as demonstrated in the image below. Click Save to finish the Super Metric.
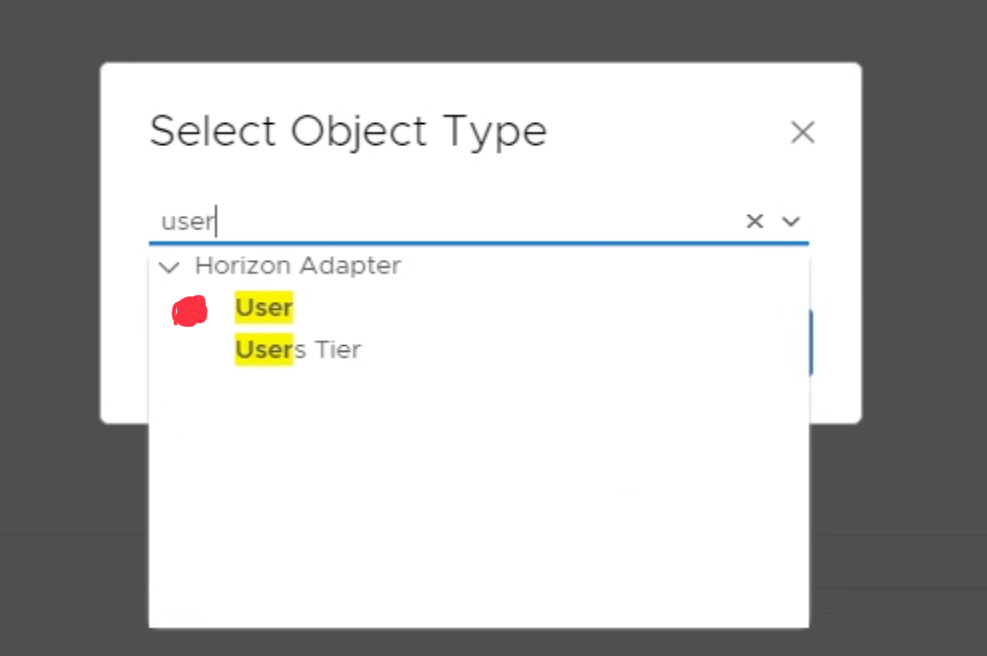
Next, you will need to add the Super Metric to the “User” object type. Click the green + sign under the “Object Types” section. Search and select the “User” object type.
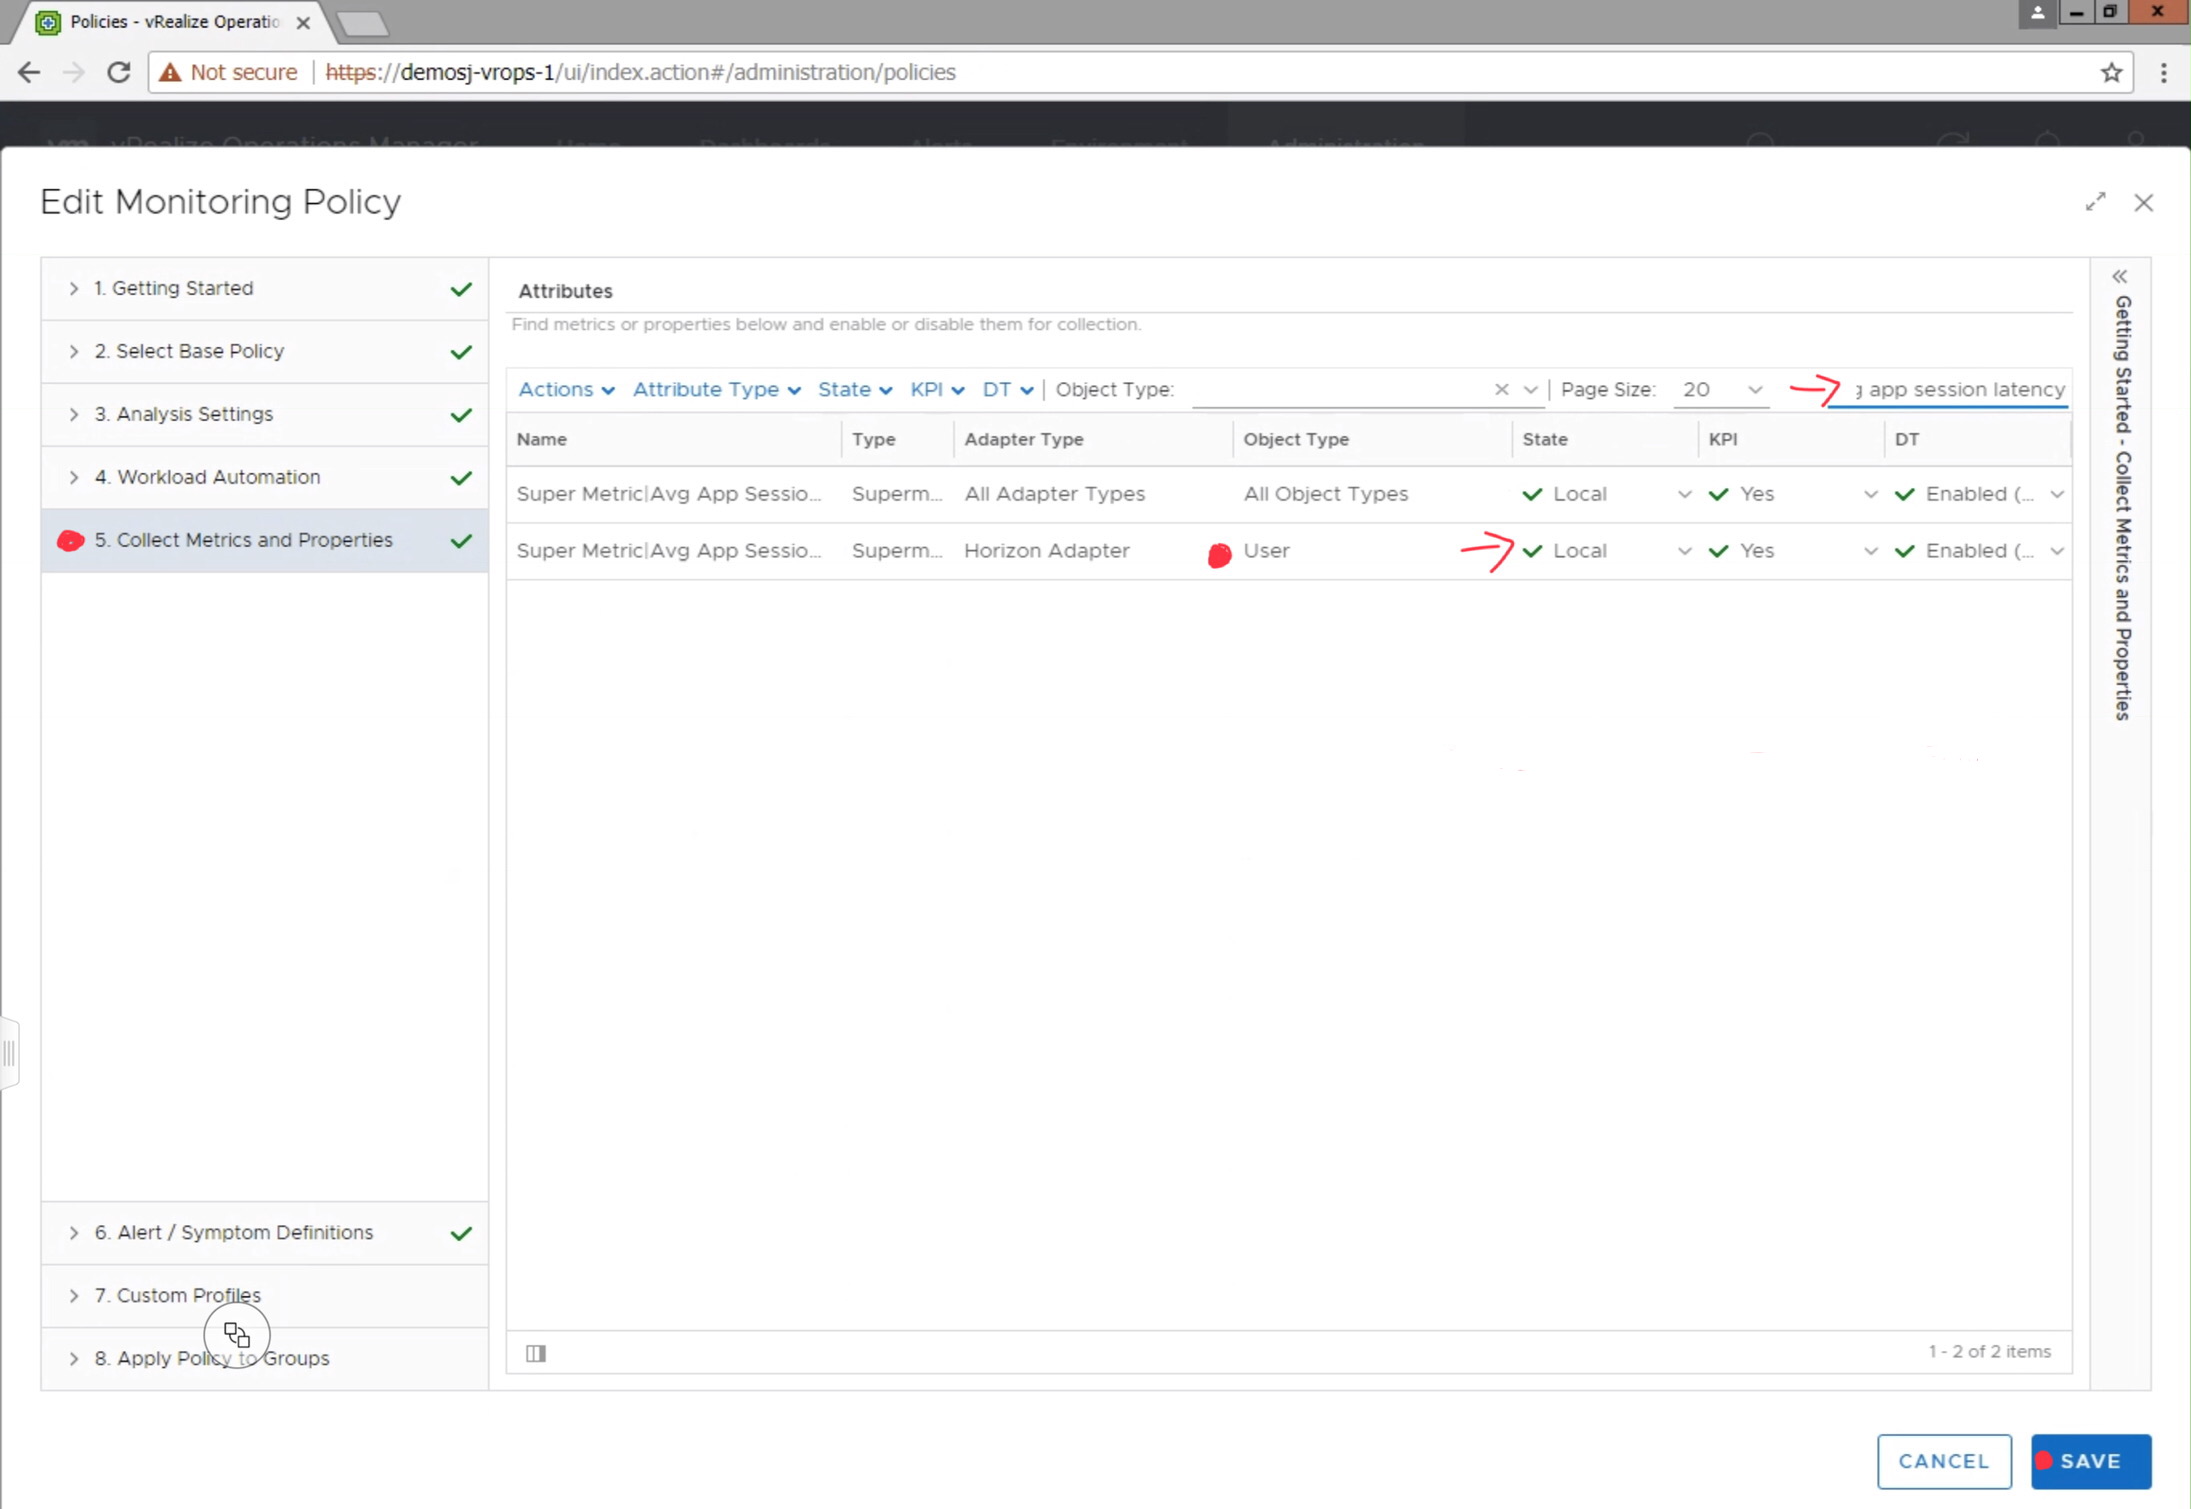
Before the Super Metric will begin collecting data, you will need to navigate to Administration-> Policies, and edit the active monitoring policy to enable the metric for collection.
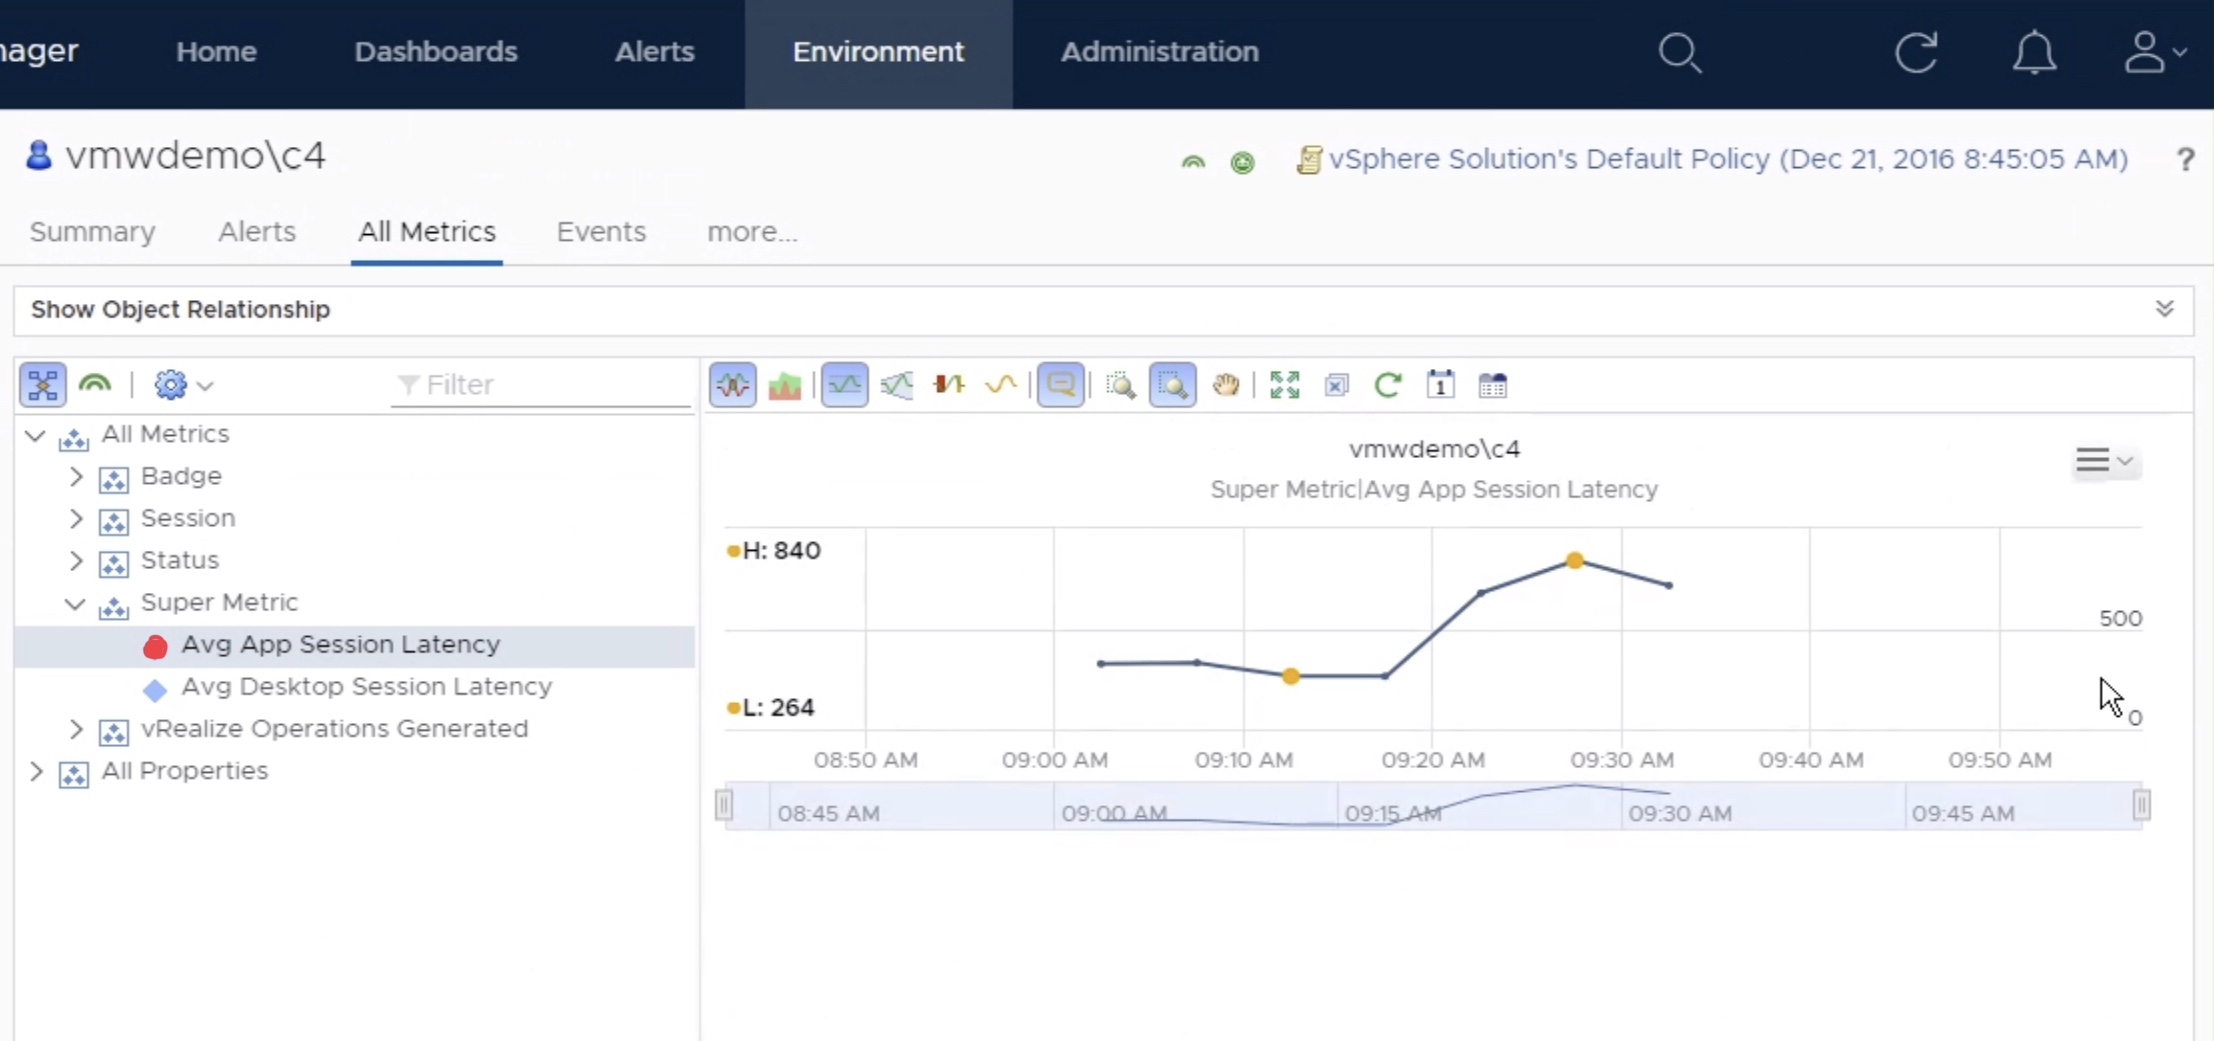
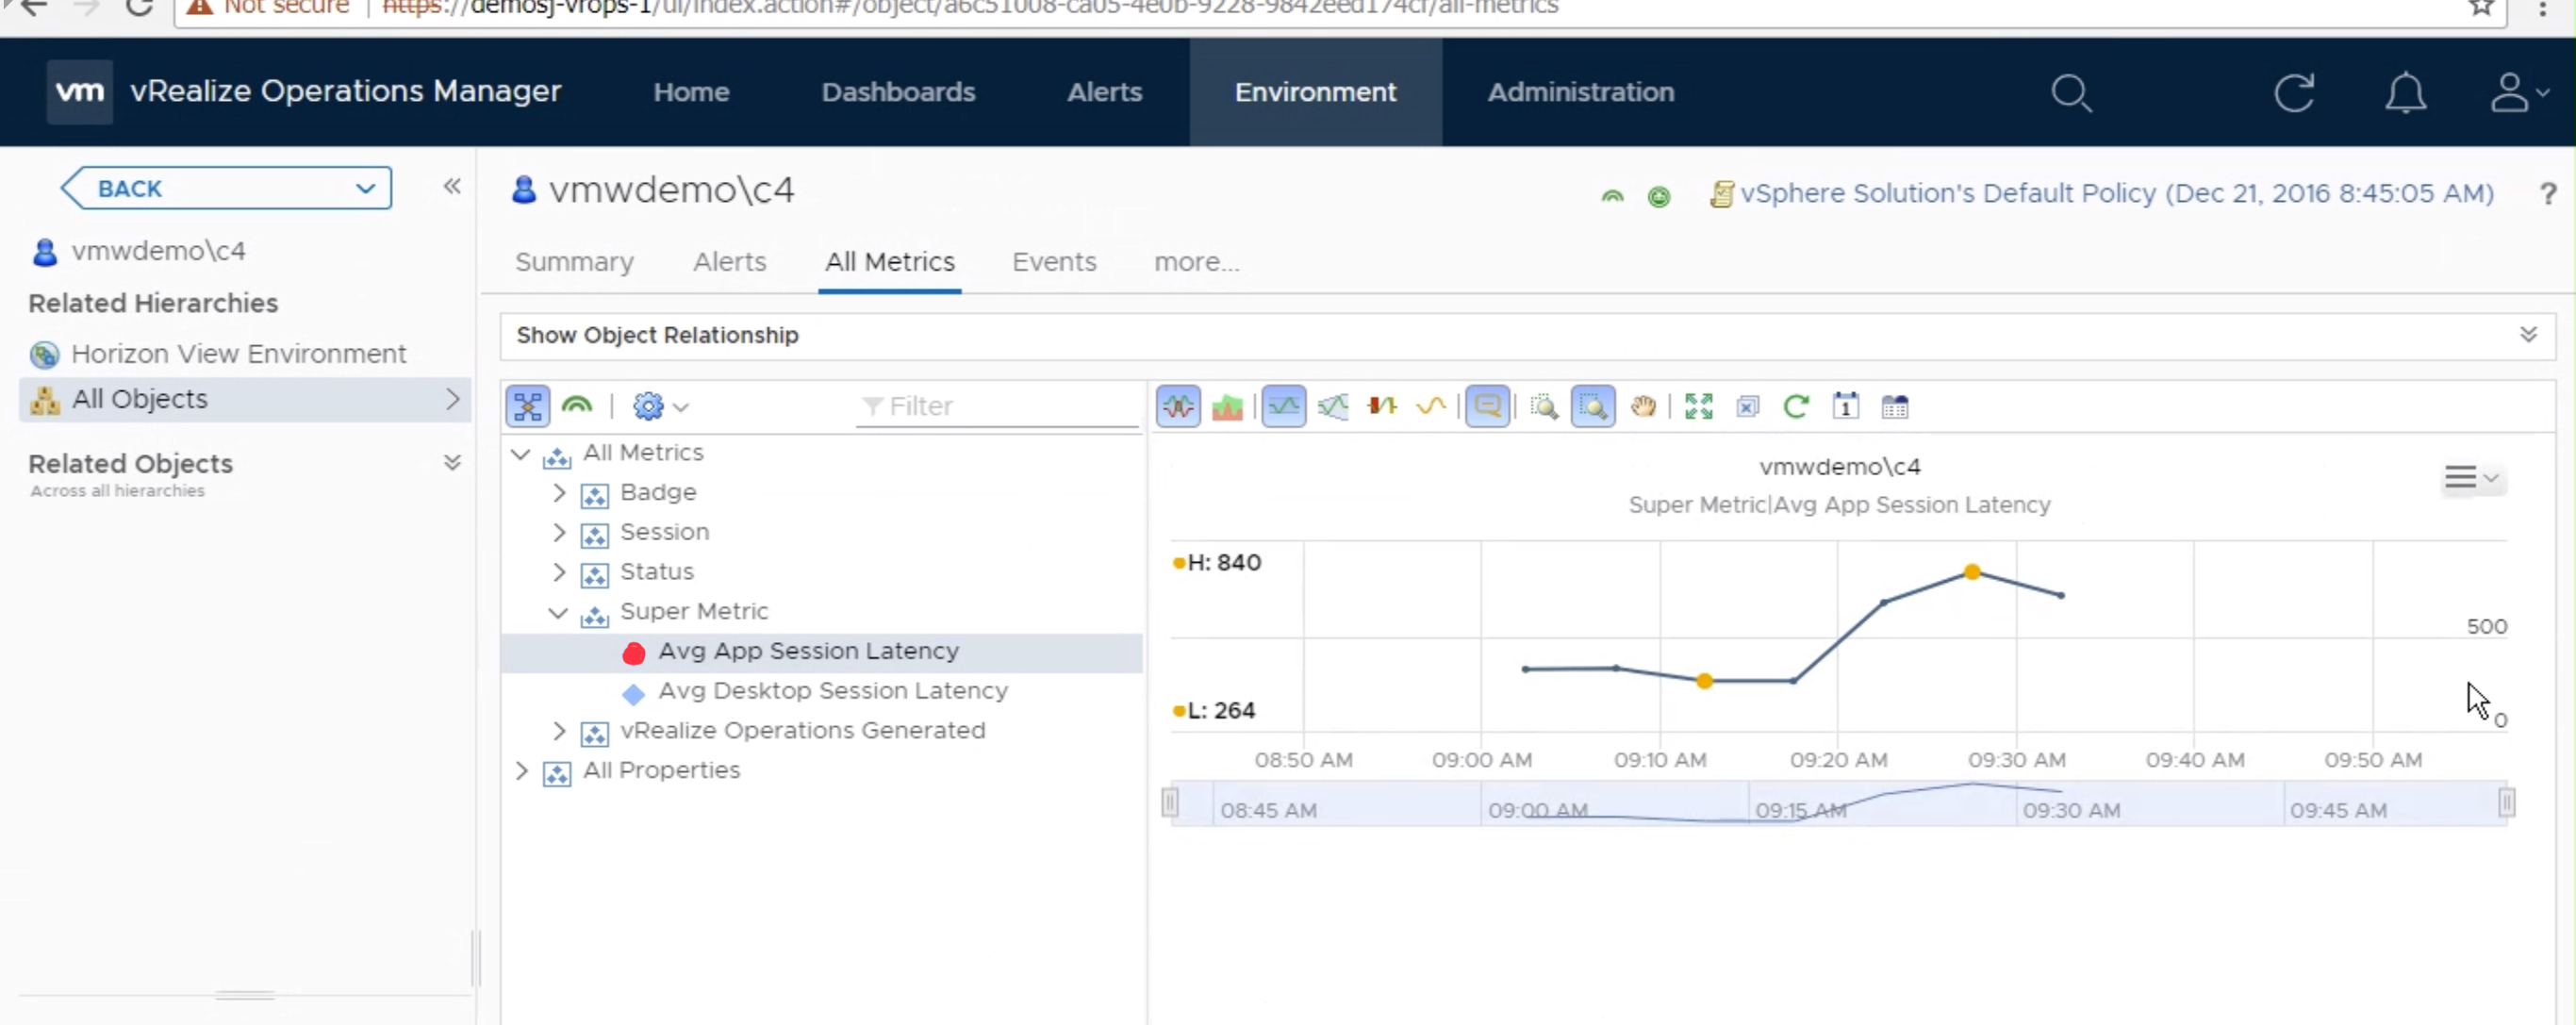
Once the metric has started to collect data, you can view the data on a individual “User” object by selecting “All Metrics” -> Super Metric -> select metric.
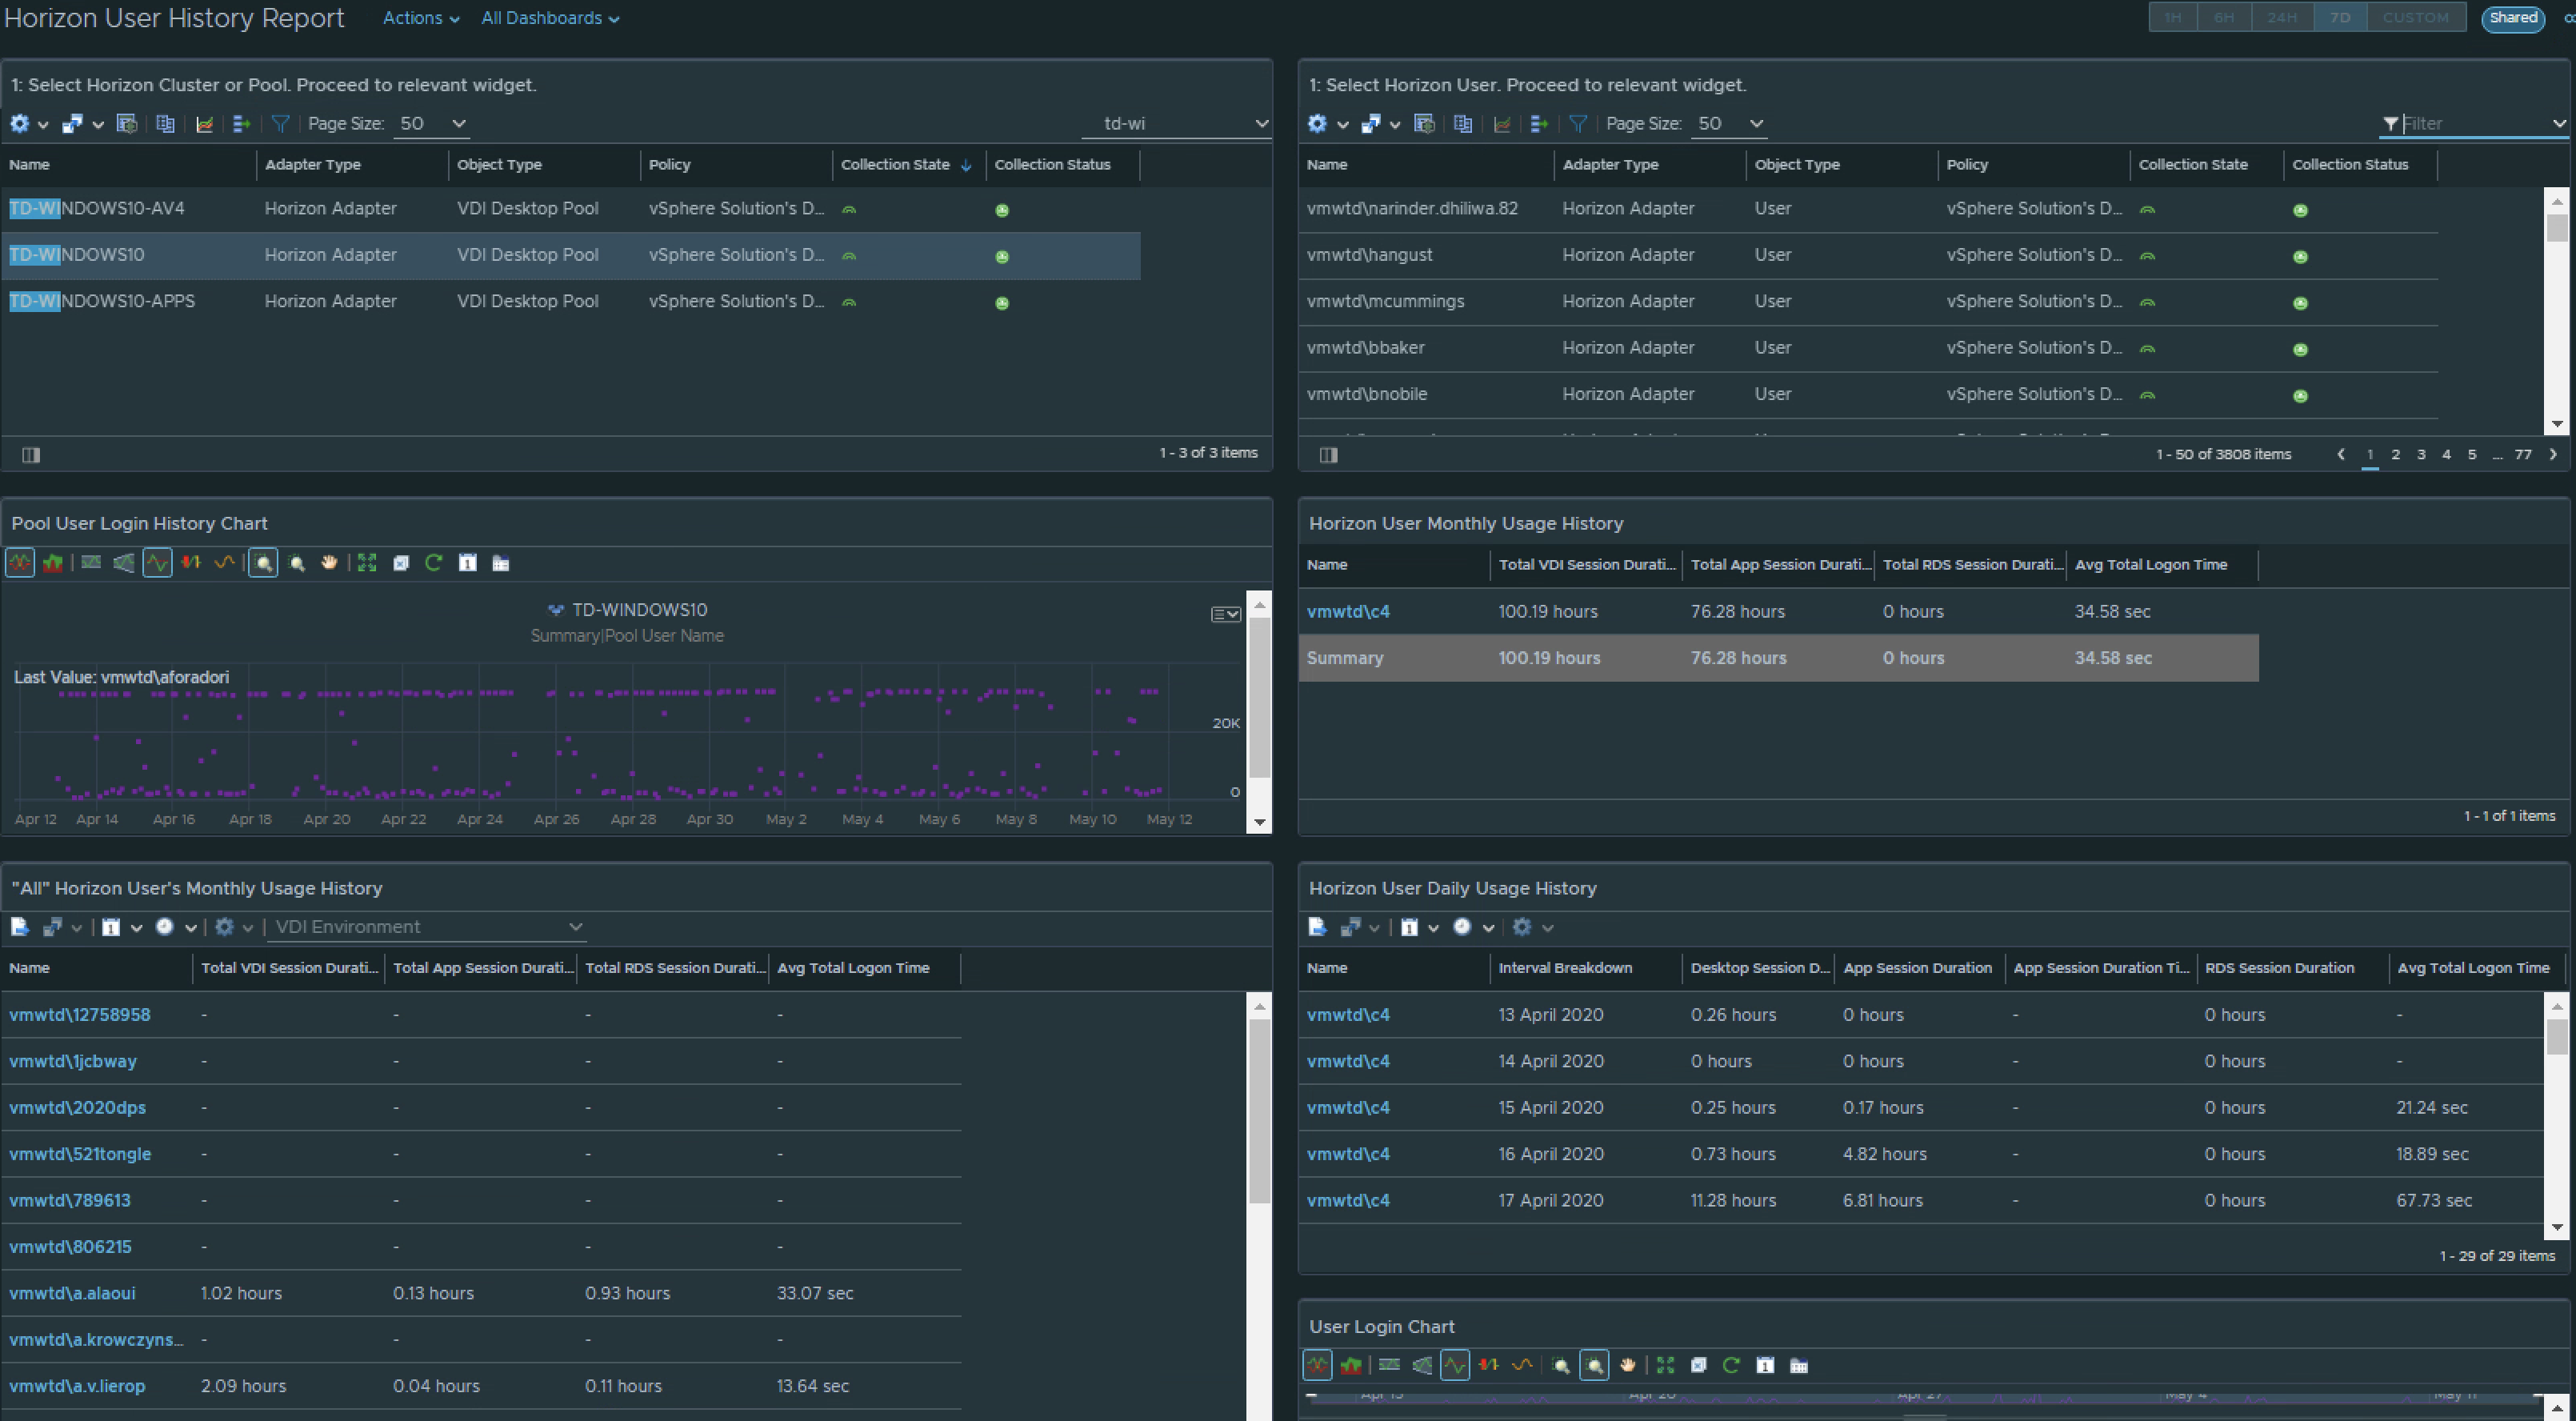
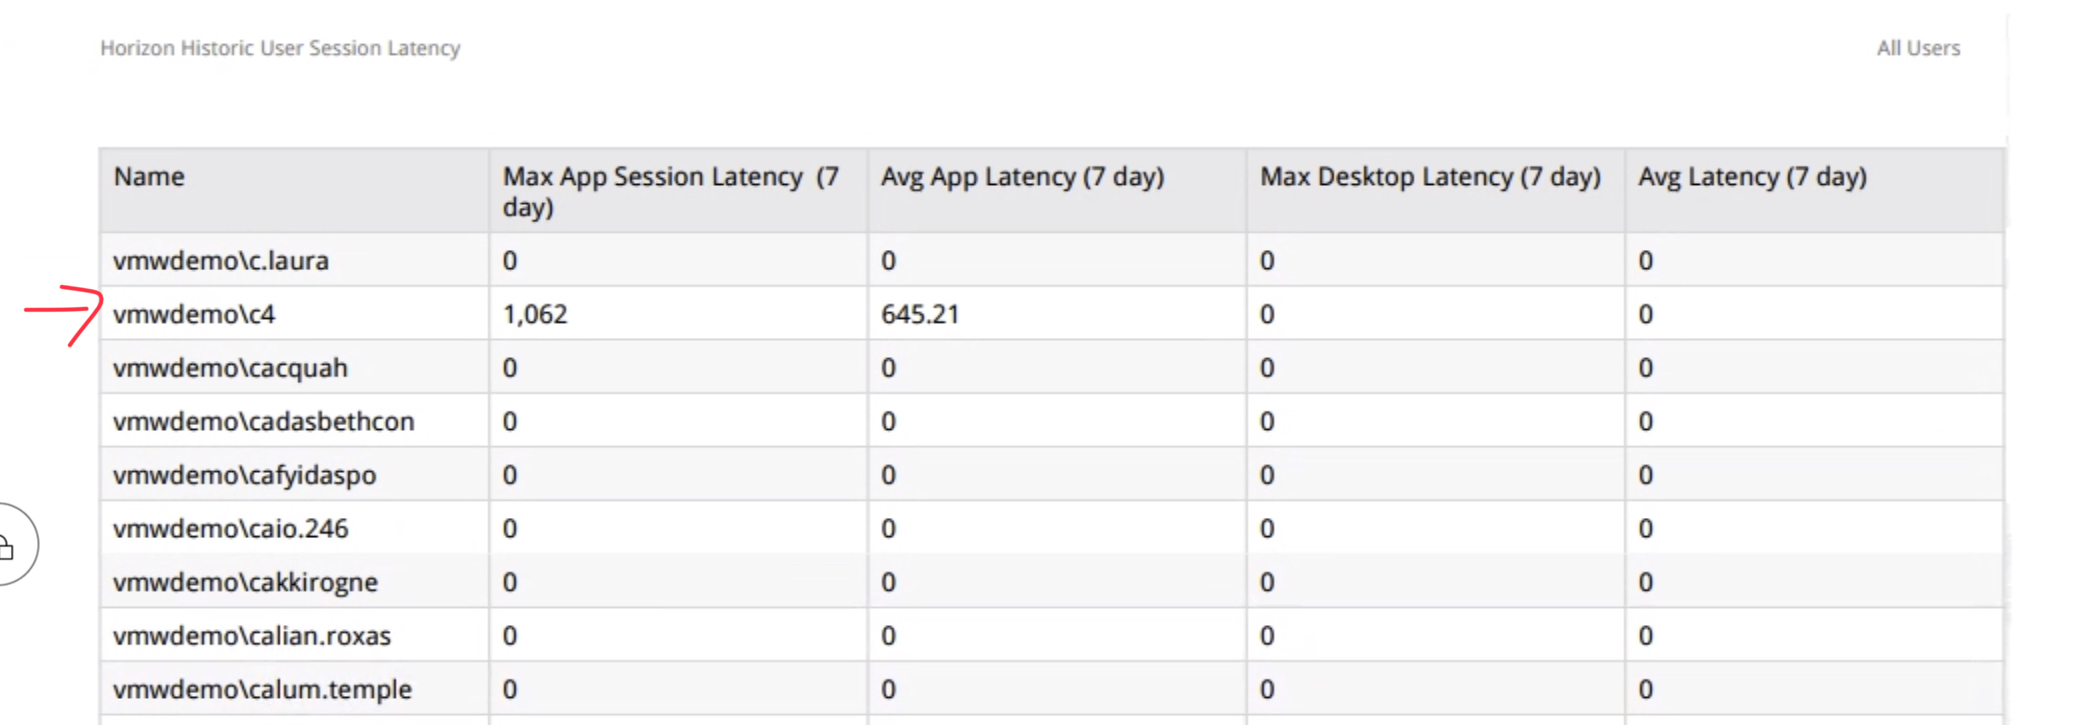
You can also create custom Views that display the historical latency for all users of the environment, as well as perform simple roll-up statistics.
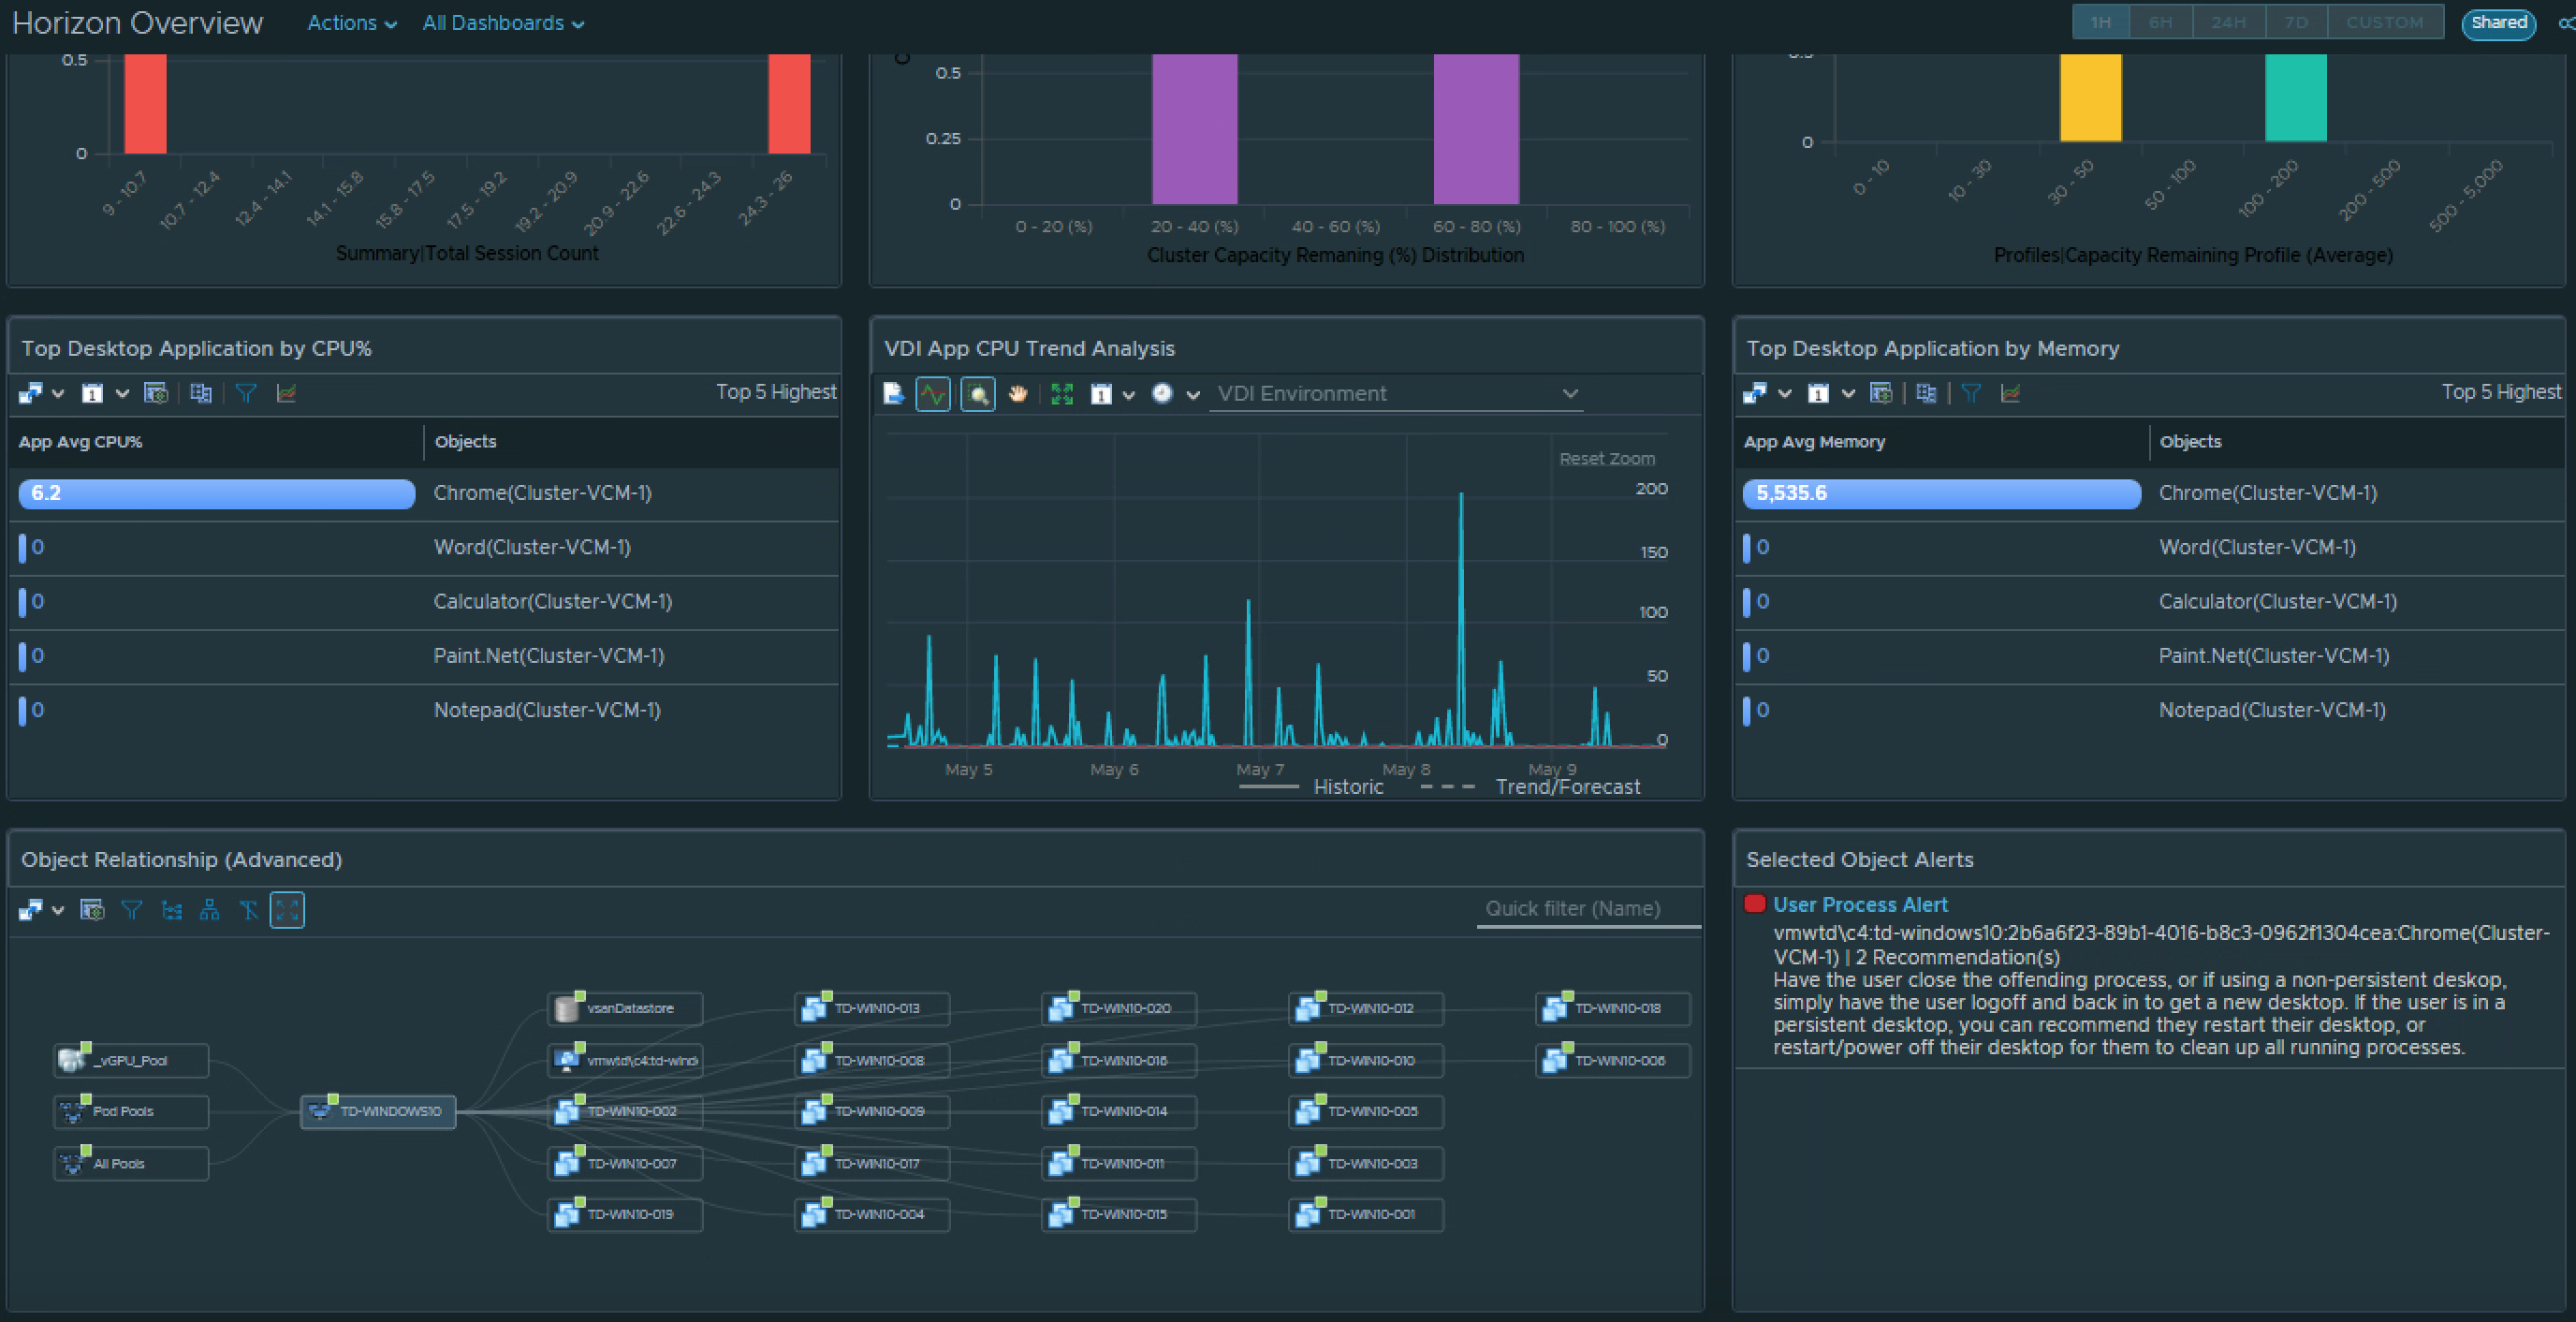
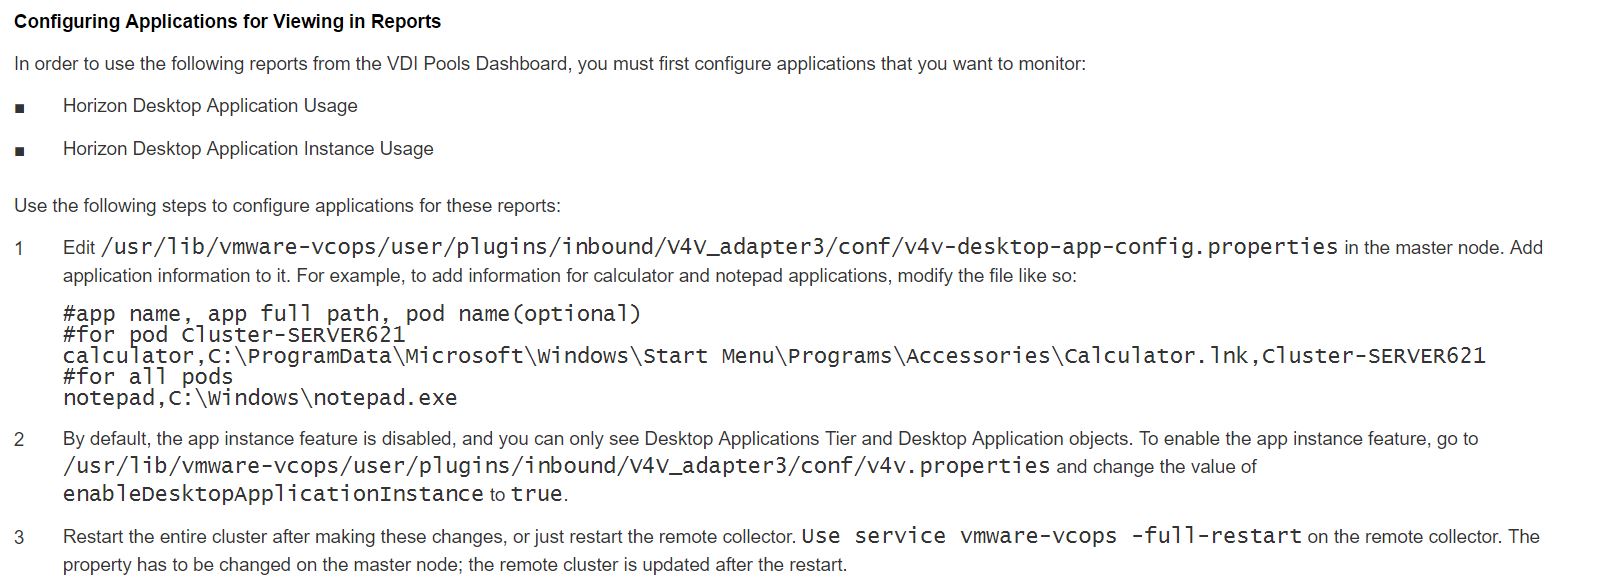
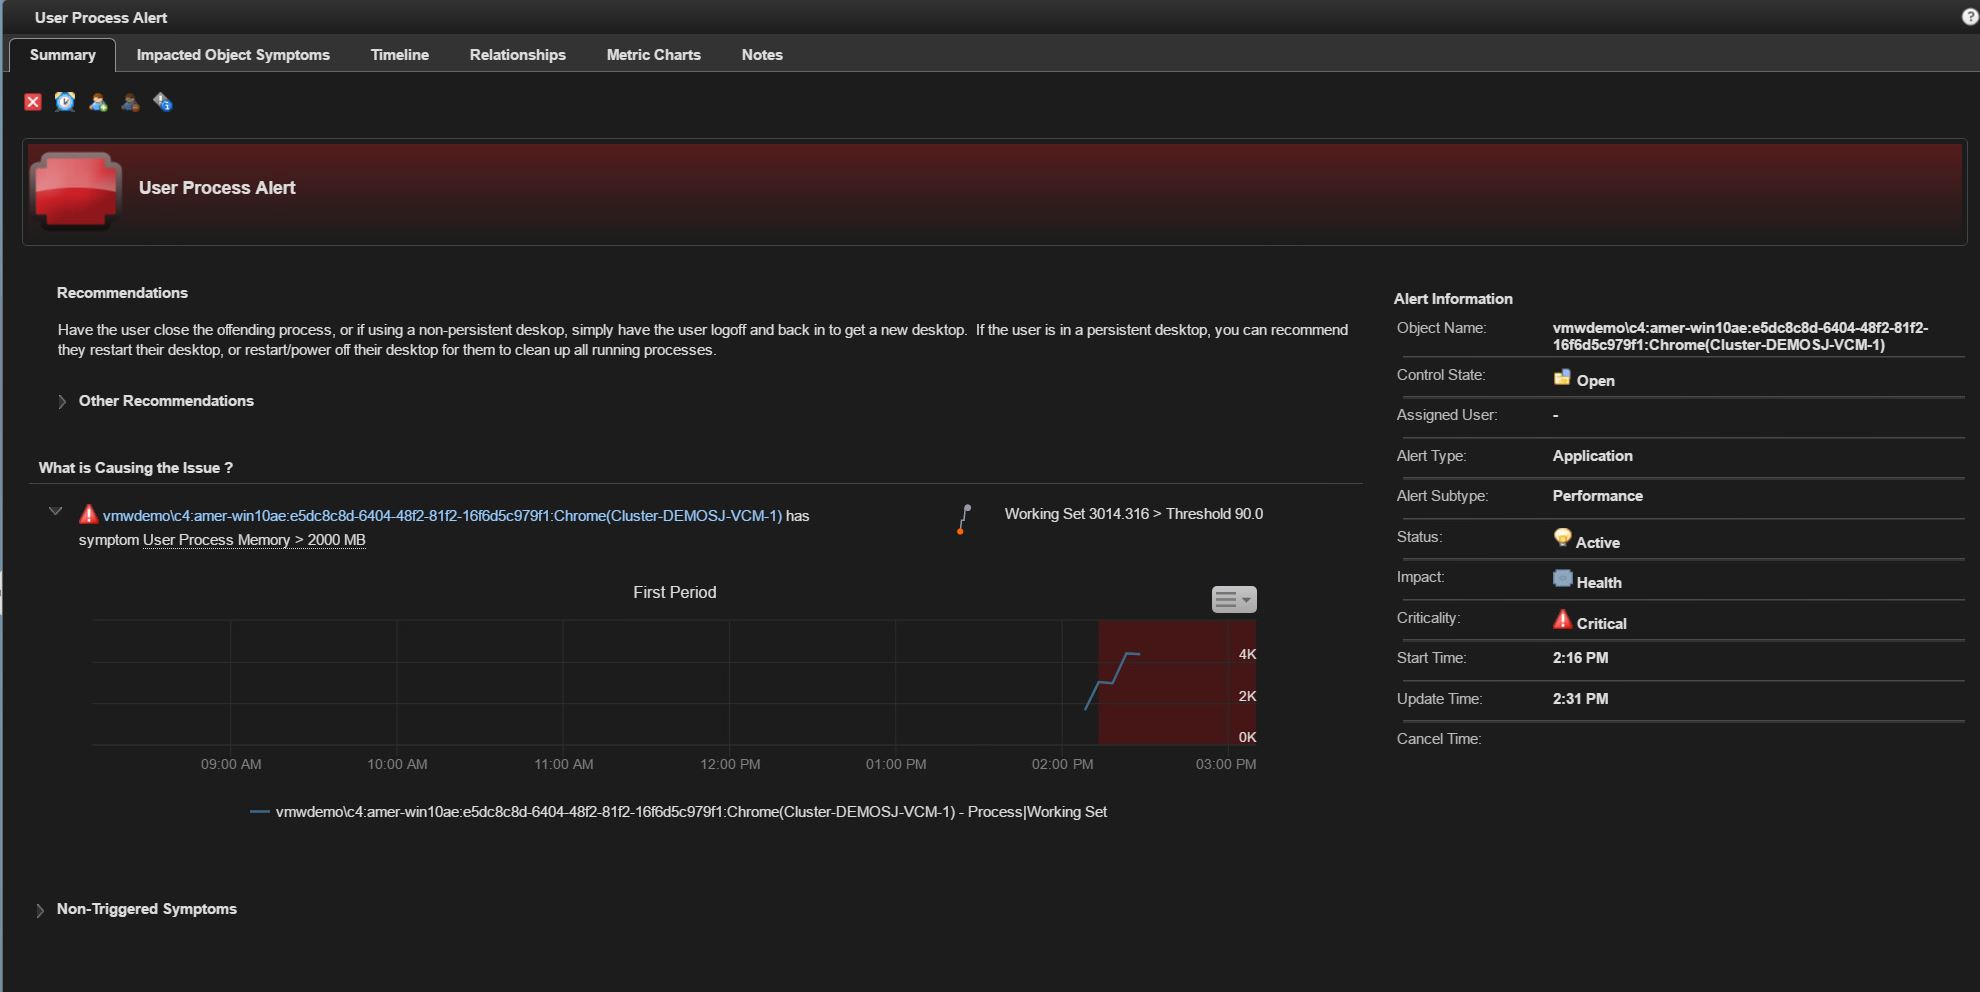
In the latest vROPs for Horizon 6.4, the ability to track user launched desktop applications was added. (See 6.4 release notes) This new addition gives customers the capability of providing reports of which users have launched specific windows applications over time.
A lesser known capability, is that this new feature also gives customers the ability to alert on these same processes when they have reached a certain CPU and Memory threshold. To take advantage of this feature, the vROPs administrator needs to perform the following steps:
Add the specific processes that you want to monitor to your vROPs for Horizon configuration. (Process Outline Click Here).
Create a new alert, and the define the appropriate CPU and Memory symptom thresholds that you want to track.
To import my sample Alert and customize it for your environment, follow these steps:
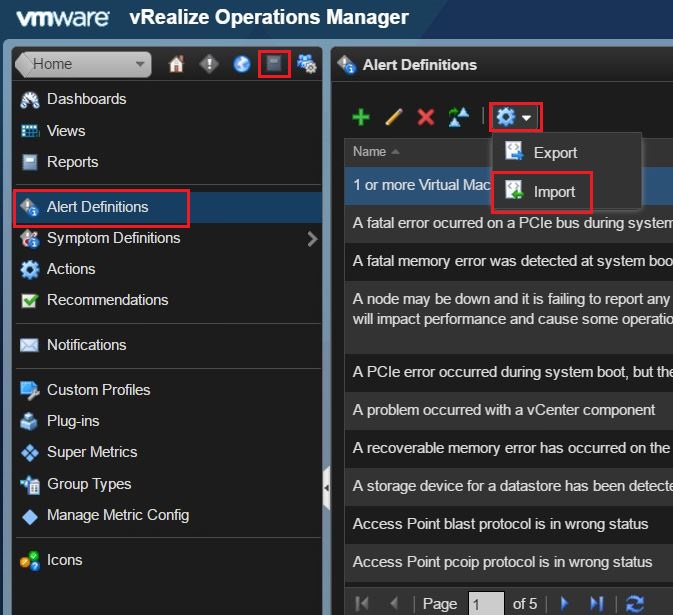
Navigate to Content-> Alert Definitions, and click Import.
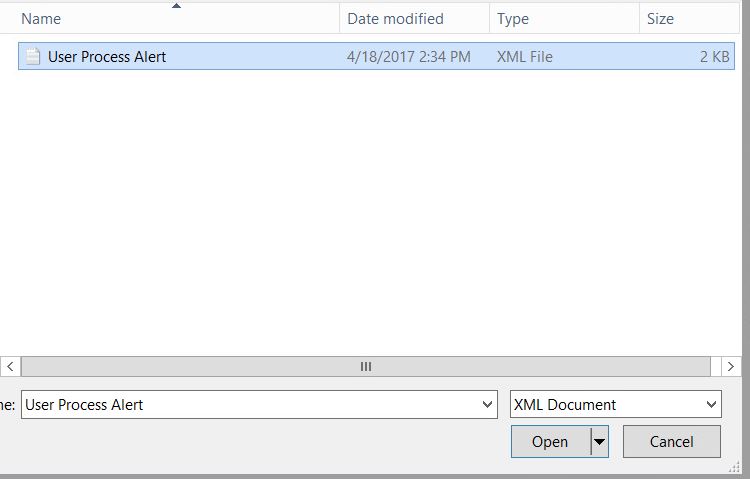
Click Browse and select the User Process Alert.xml file previously downloaded, and click Open to import.
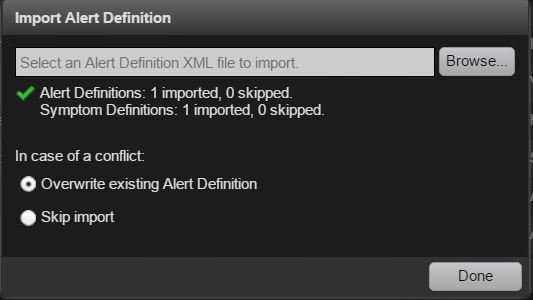
Confirm that the Alert Definition was imported successfully. If the alert was skipped for some reason, you can re-attempt the process and select the “Overwrite existing Alert Definition” option before clicking Browse and opening the file.
Click Done to finish the import process.
Congratulations! You now have visibility into in-guest processes, and how they are impacting the users of your Horizon View environment.
**This content is now included out-of-box in the vROPs for Horizon Adapter installation .pak file and dashboards download file available at: downloads.vmware.com
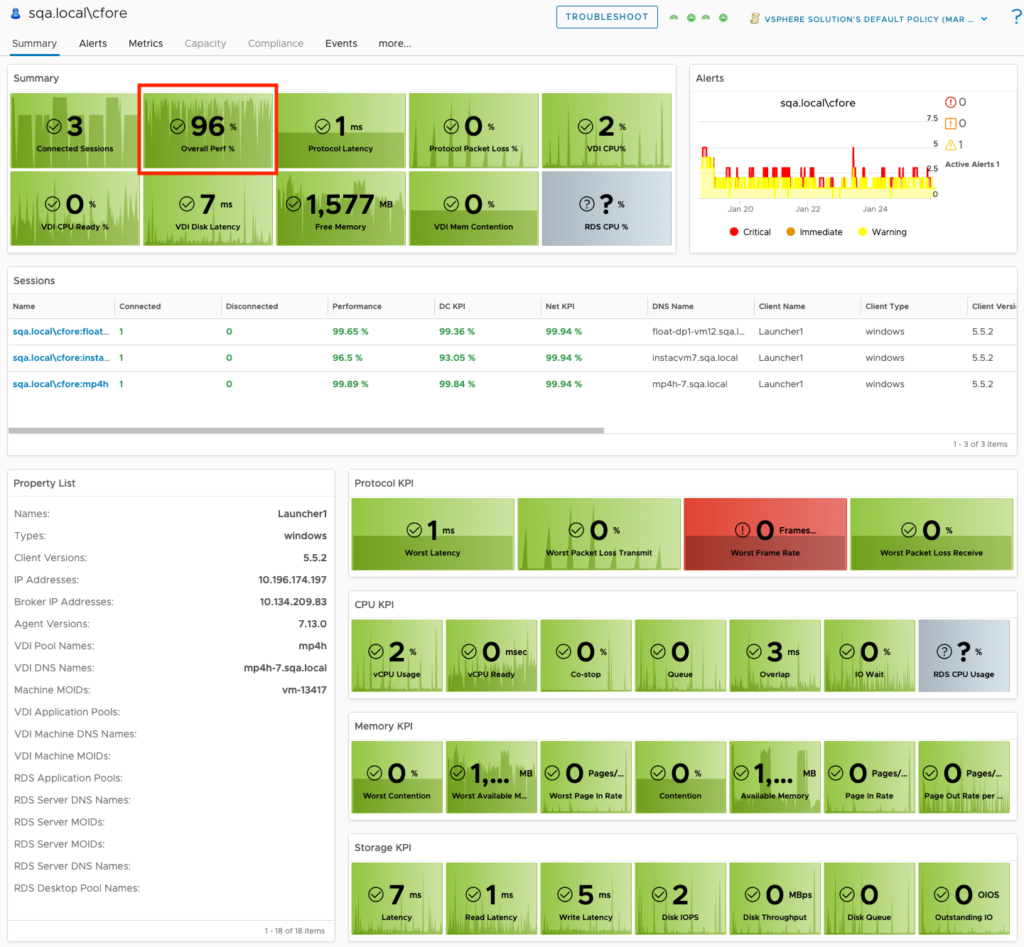
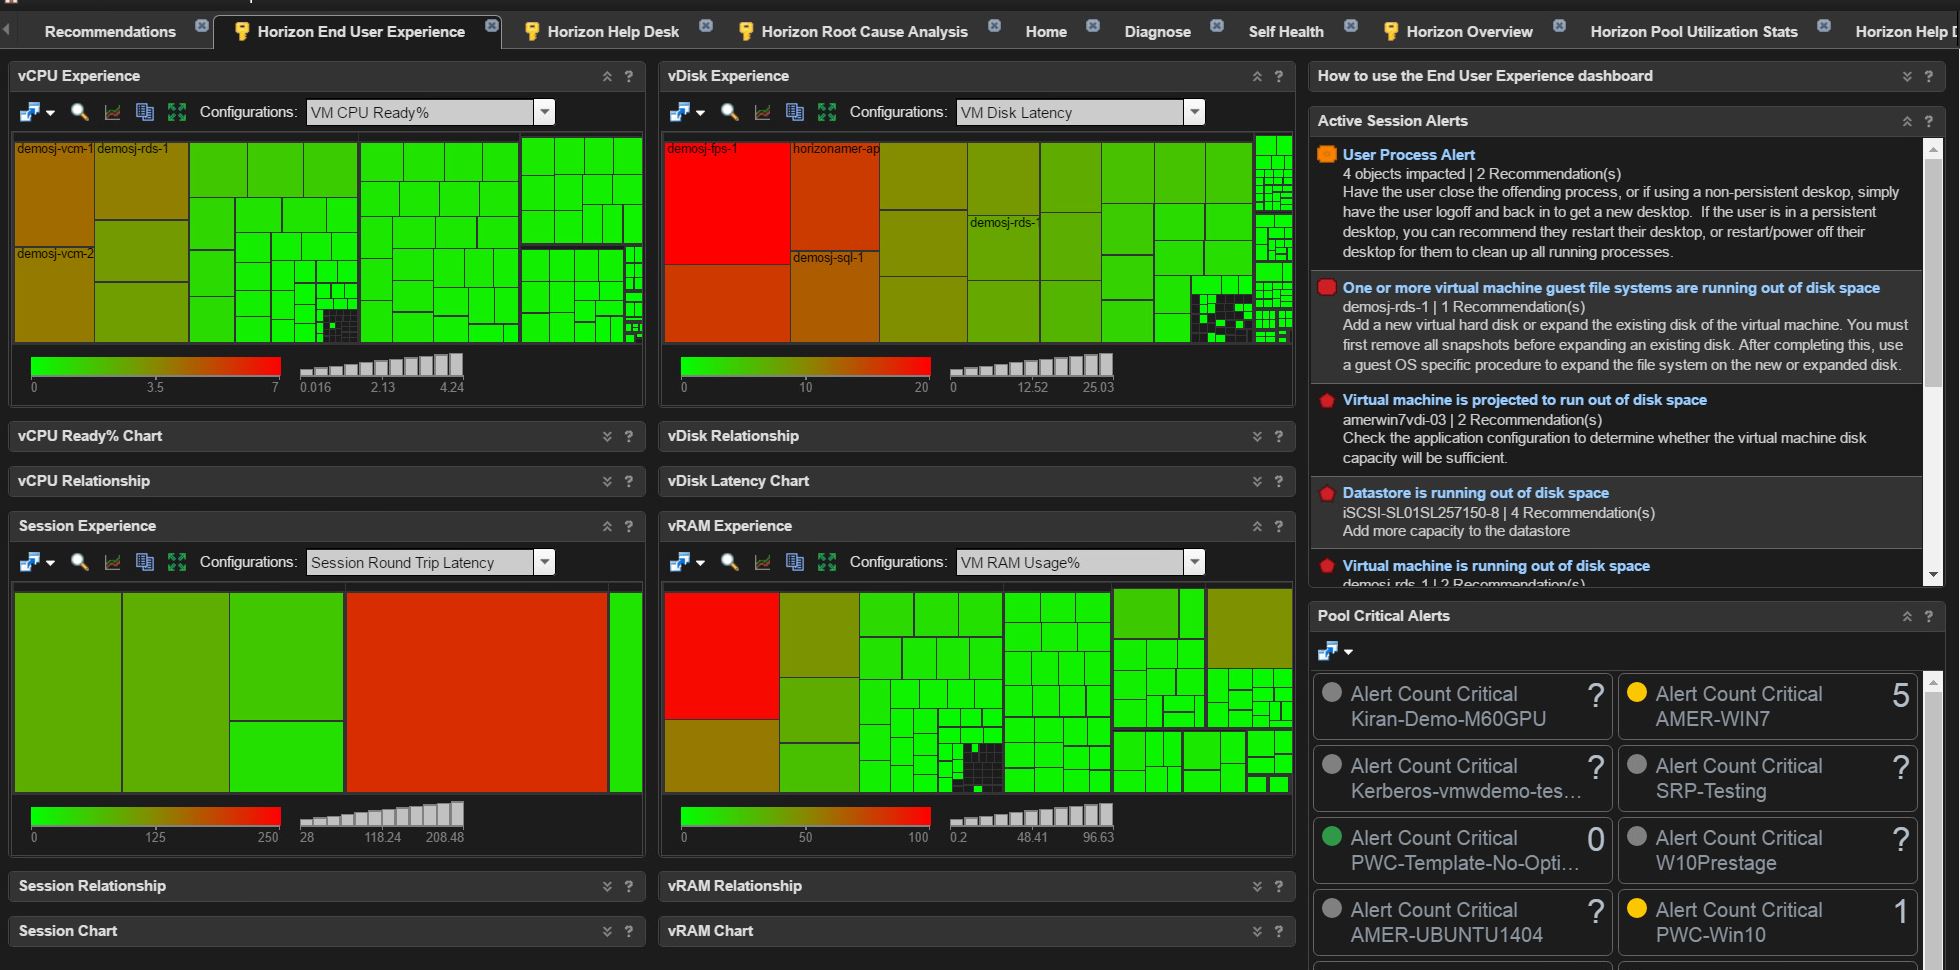
The latest vROPs for Horizon custom content includes an updated End User Experience and Help Desk dashboard, with Blast Session Metrics and Alerts, Horizon Client External IP address, as well as new Navigate to “Horizon Root Cause Analysis Dashboard” functionality.
End User Experience Dashboard:
To use the root cause analysis dashboard, select any object from a heat map or relationship chart on the End User Experience dashboard, then select the Navigate to “Horizon Root Cause Analysis” option to begin troubleshooting.
New Blast Session Metrics and Root Cause functionality.
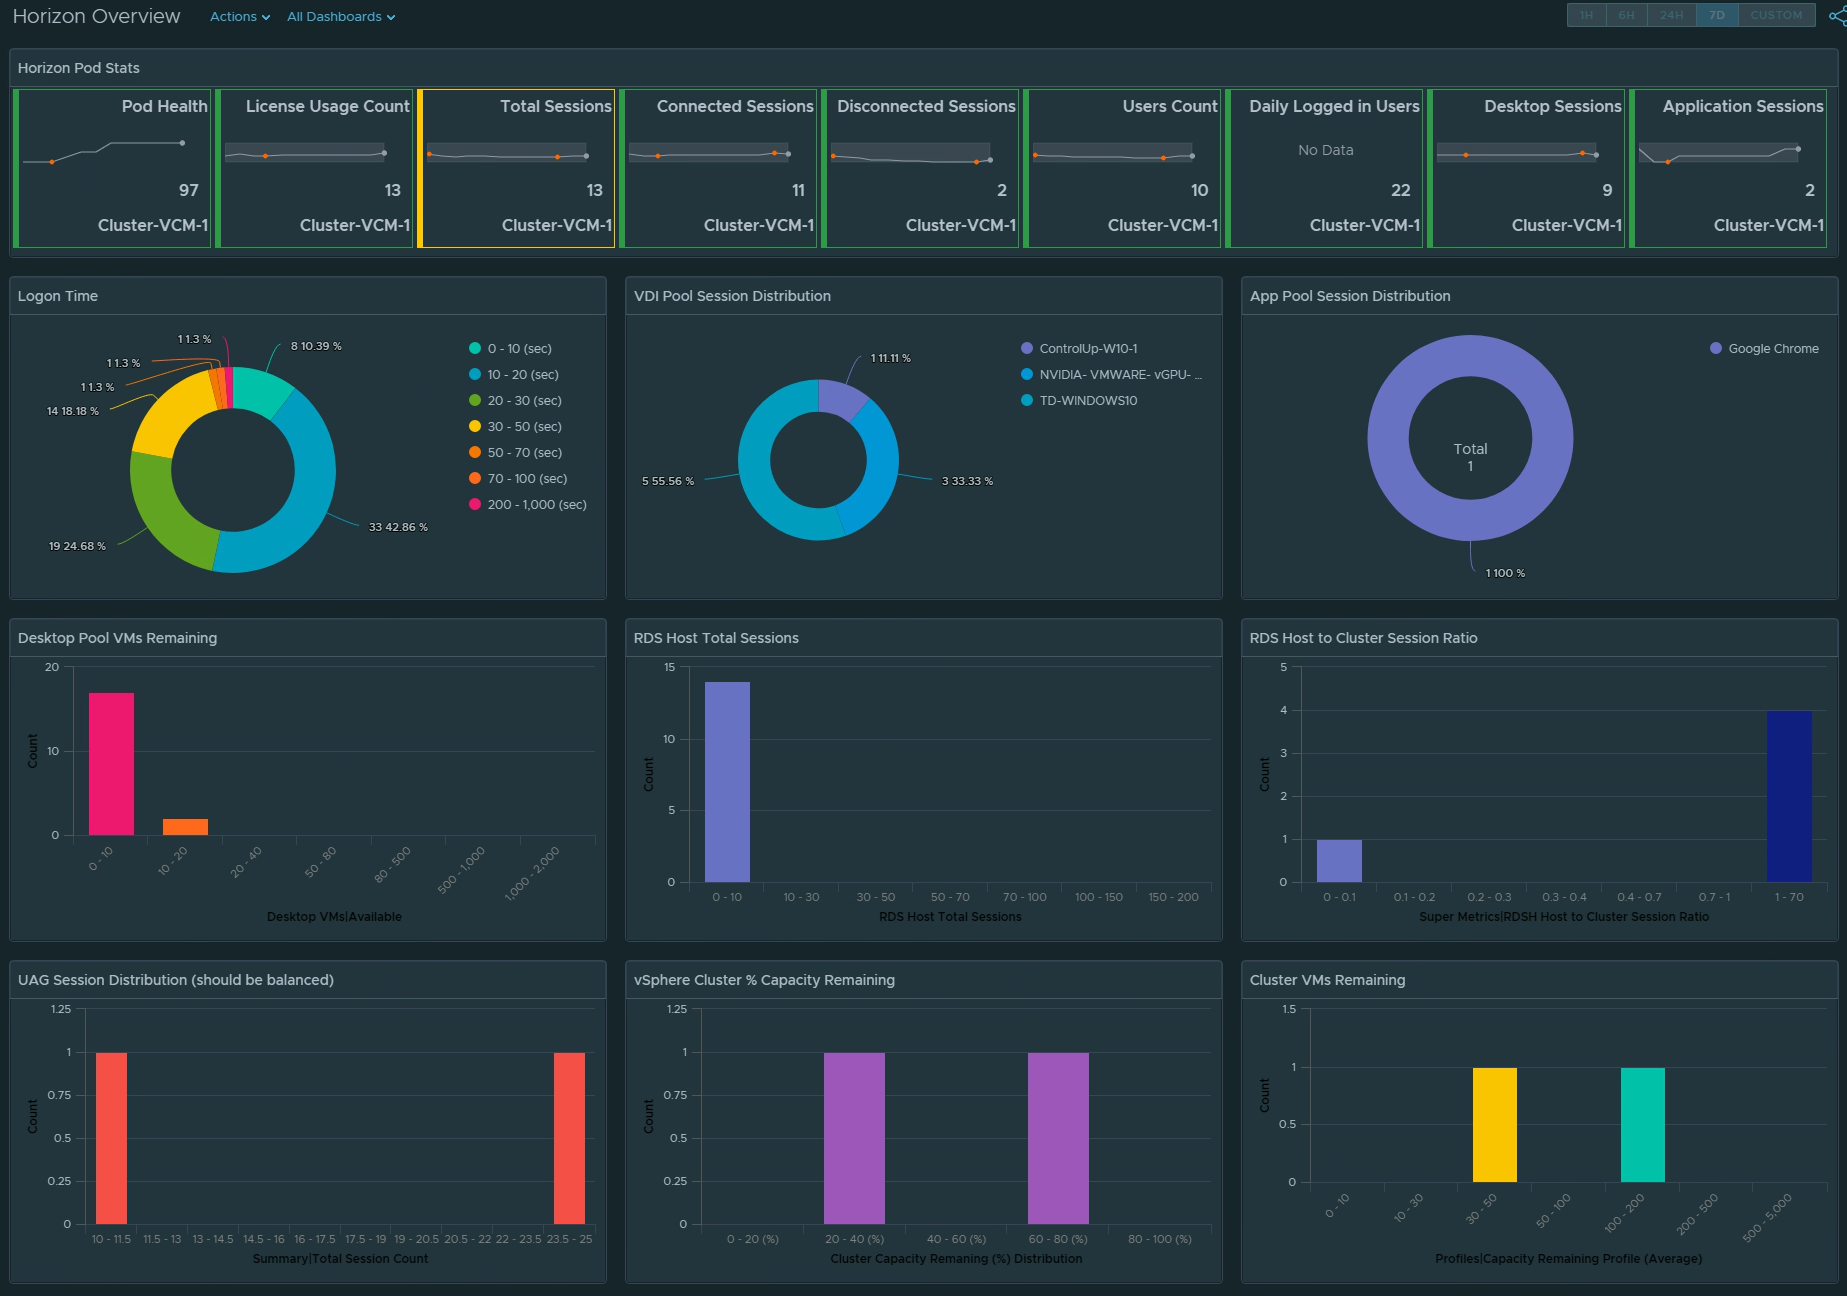
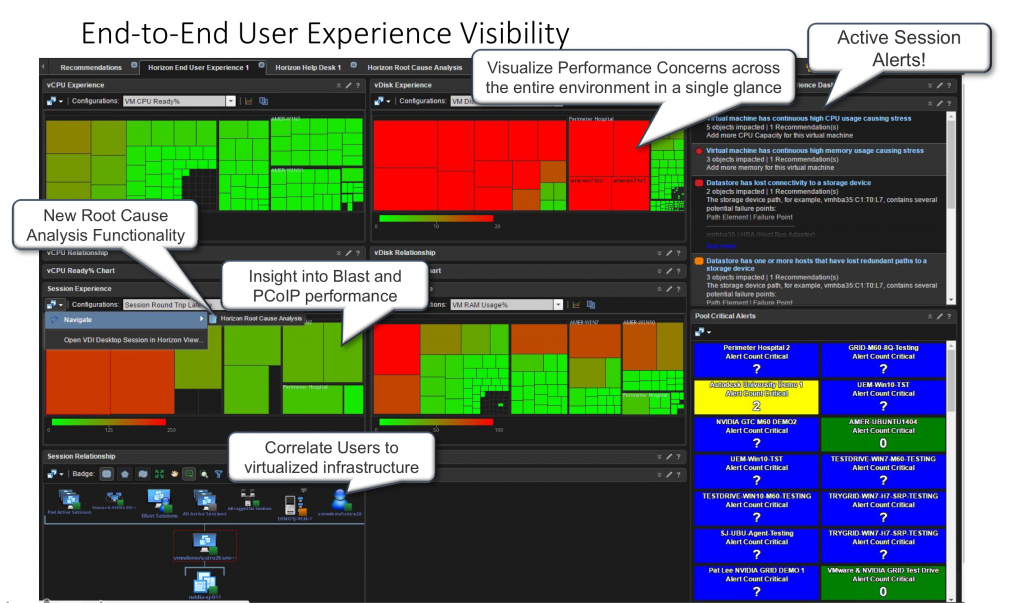
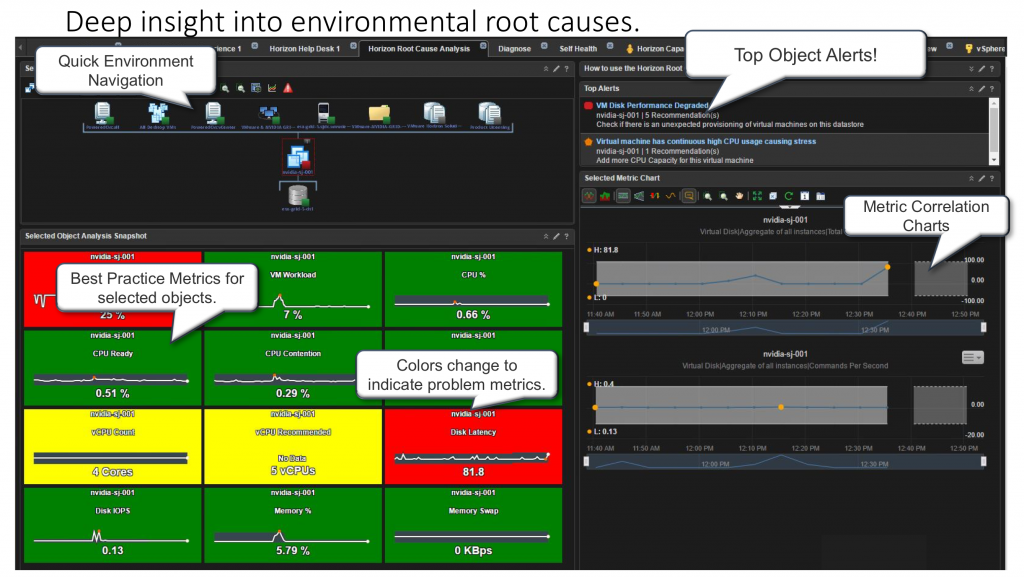
Horizon Root Cause Analysis:
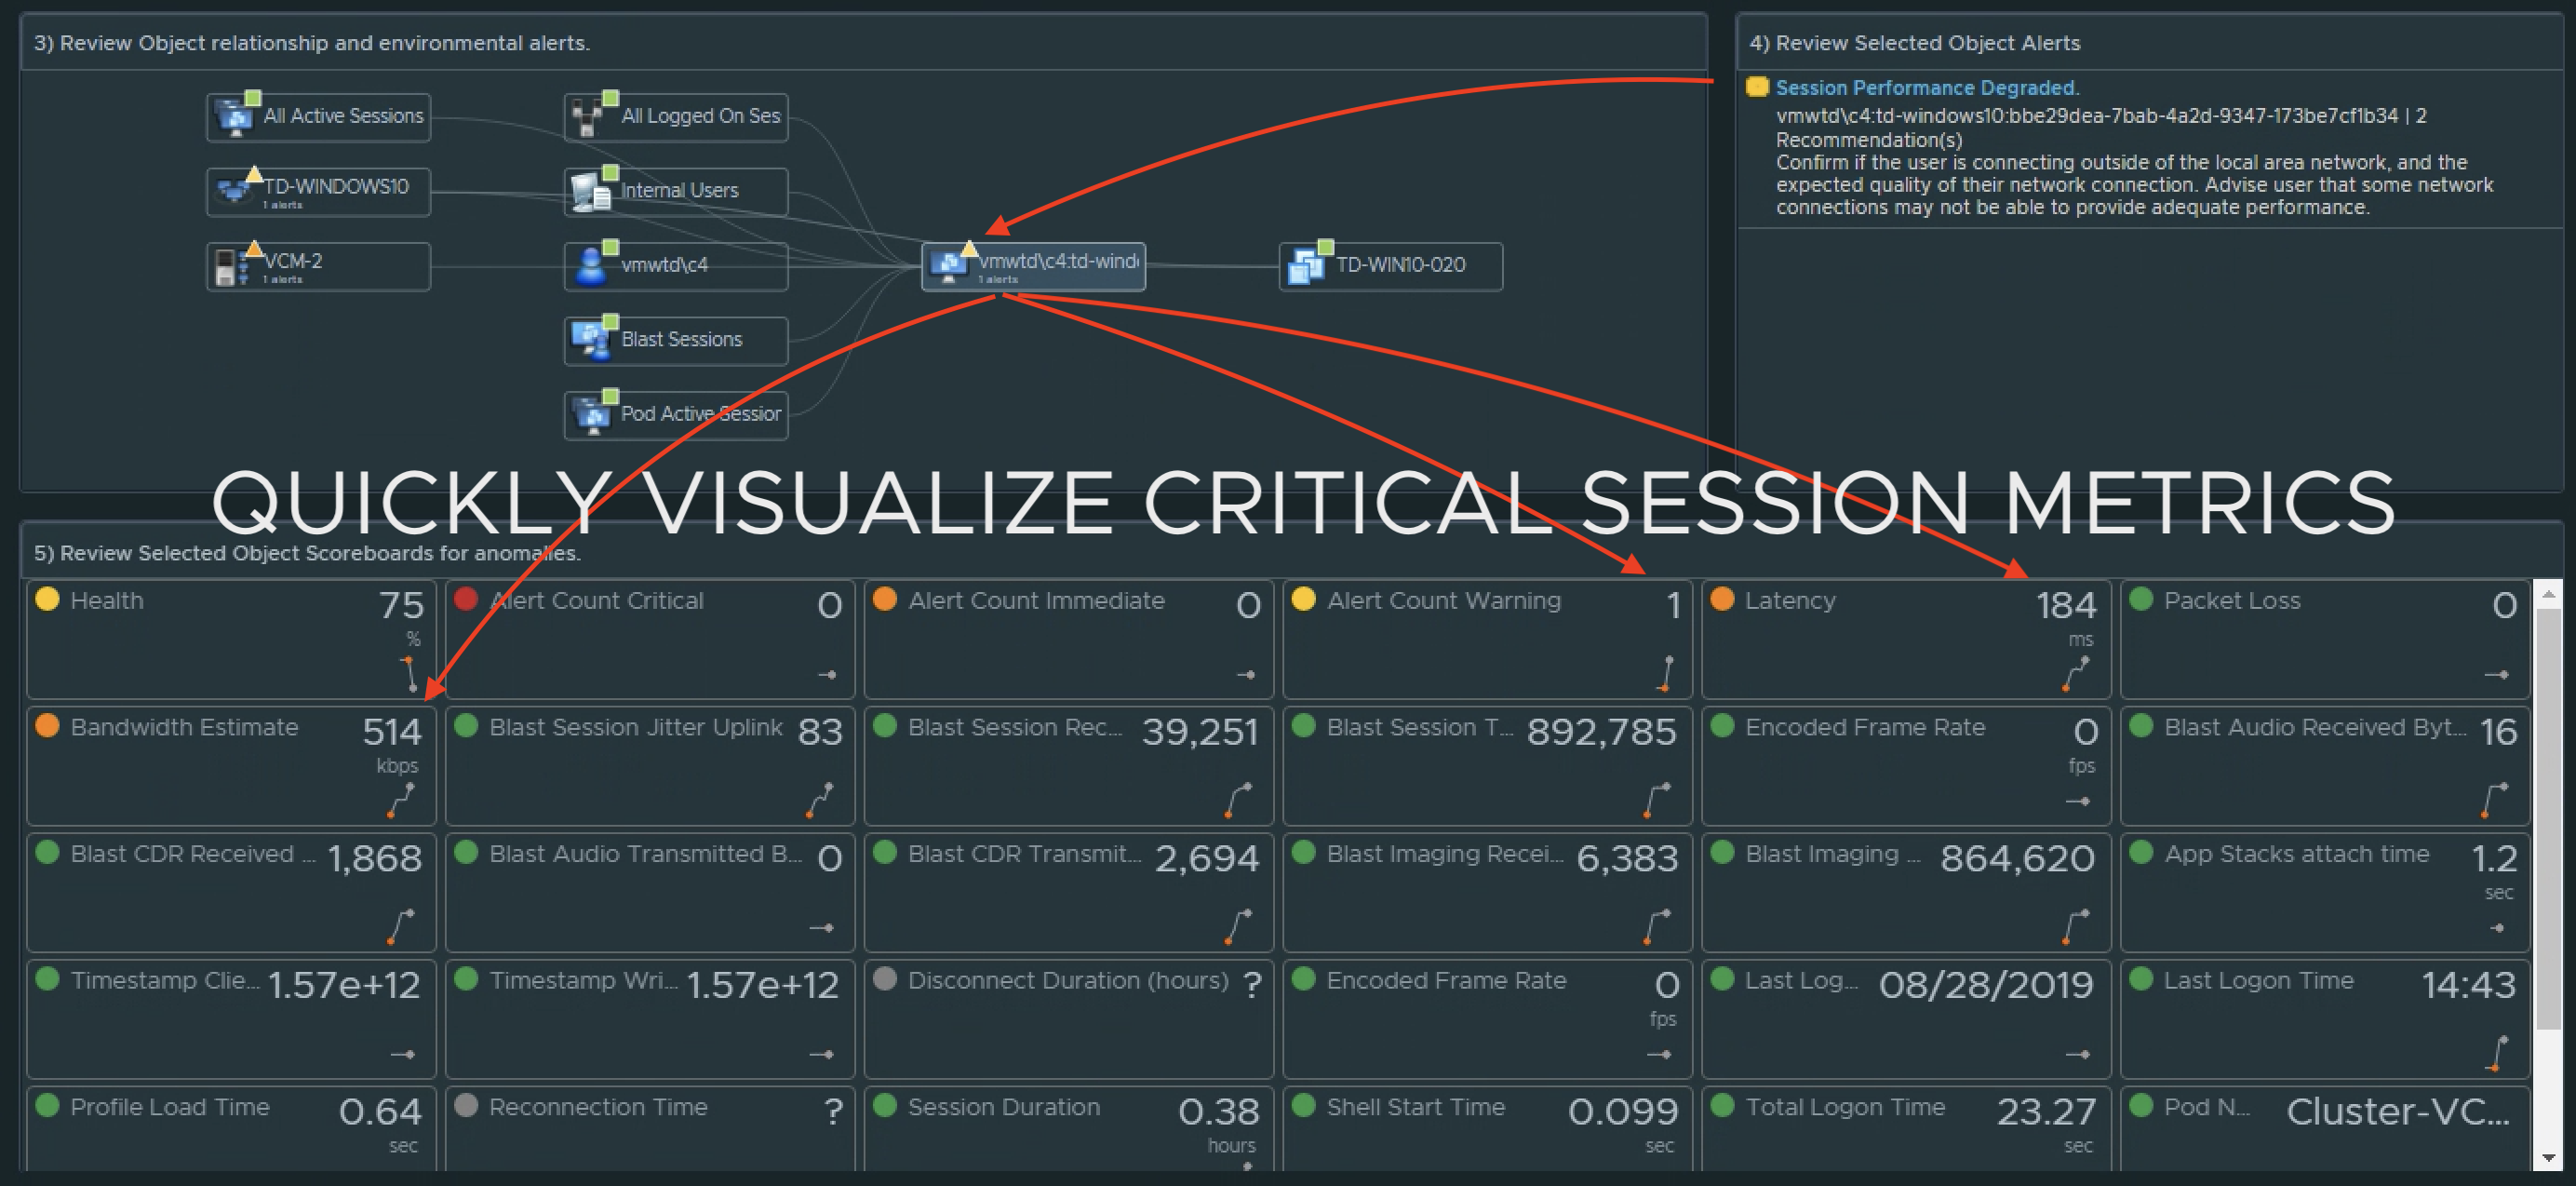
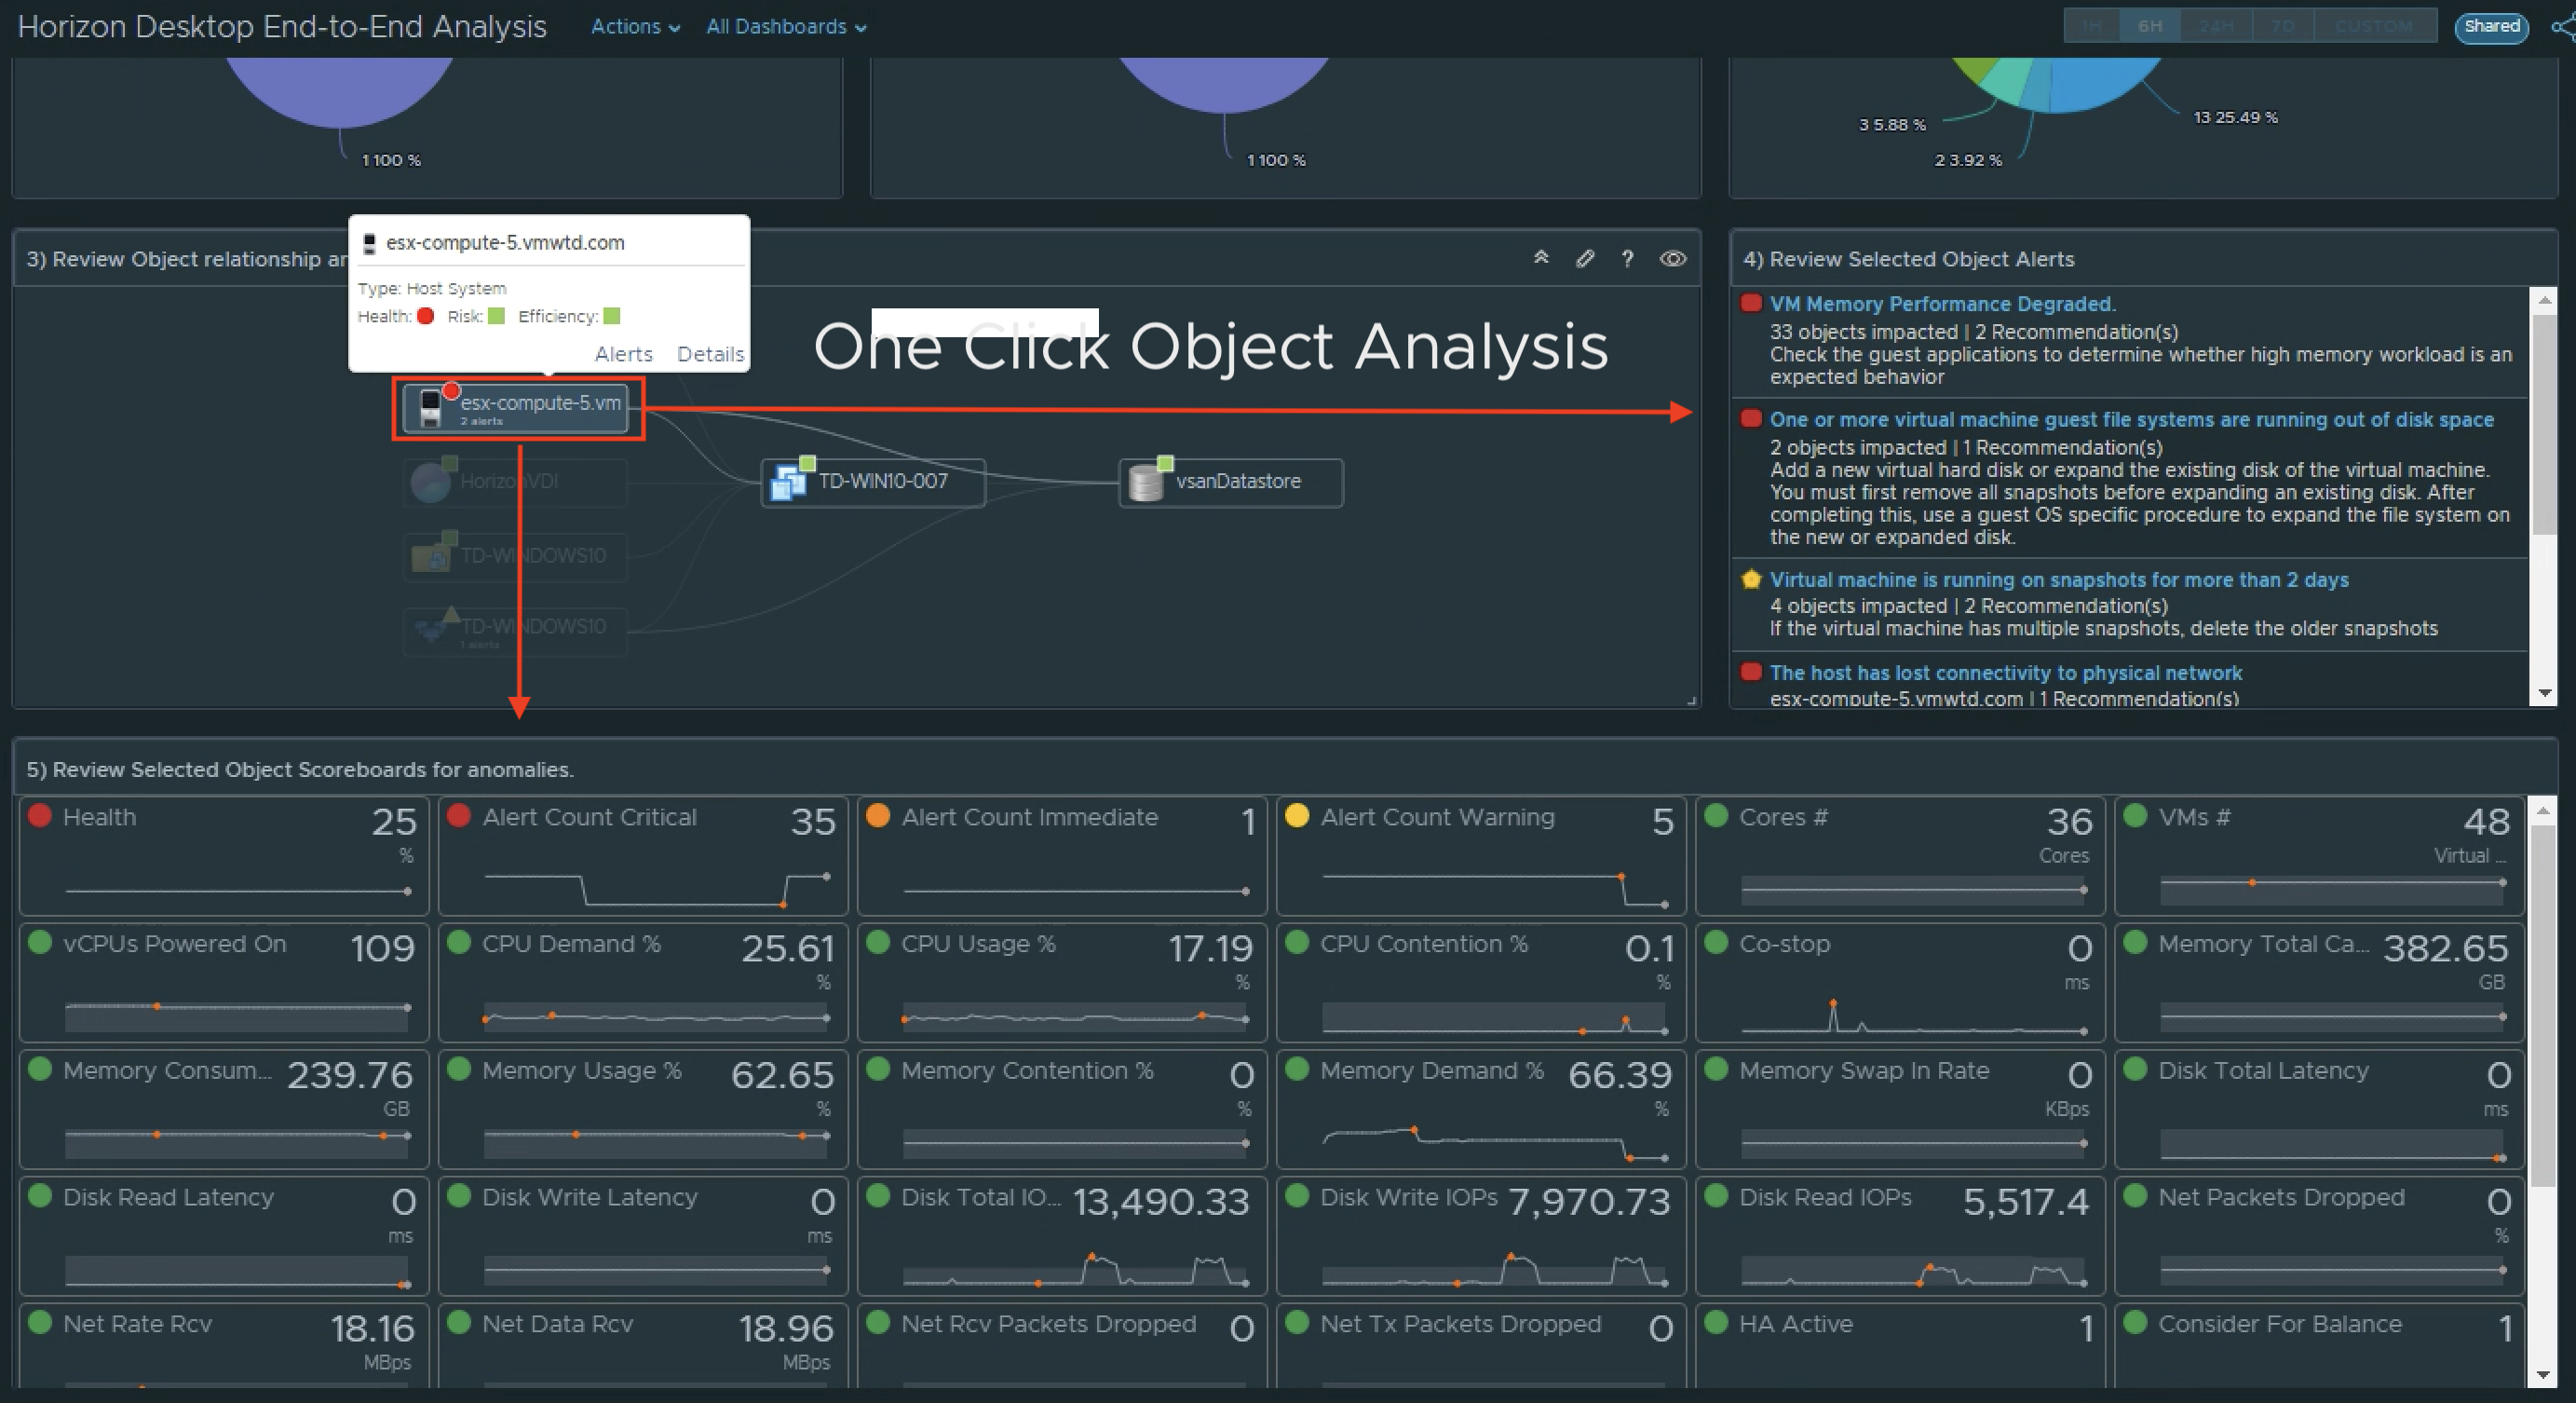
The Horizon Root Cause Analysis Dashboard allows you to quickly switch between correlated environmental objects, and see the best practice metrics and alerts on the selected item. Colors will change to indicate any problem metric, or simply provide visibility into metrics of “interest”.
Select the object you want additional information on, and the best practice metrics will be viewed in the Scoreboard below, as well as any alerts on the selected object. You can also click a Scoreboard metric to add it to the Selected Metric Chart widget, as well as switch objects, and continue to build out the metric chart with various environmental objects to put together a cross-environment “picture” for analysis.
New Root Cause Analysis Dashboard
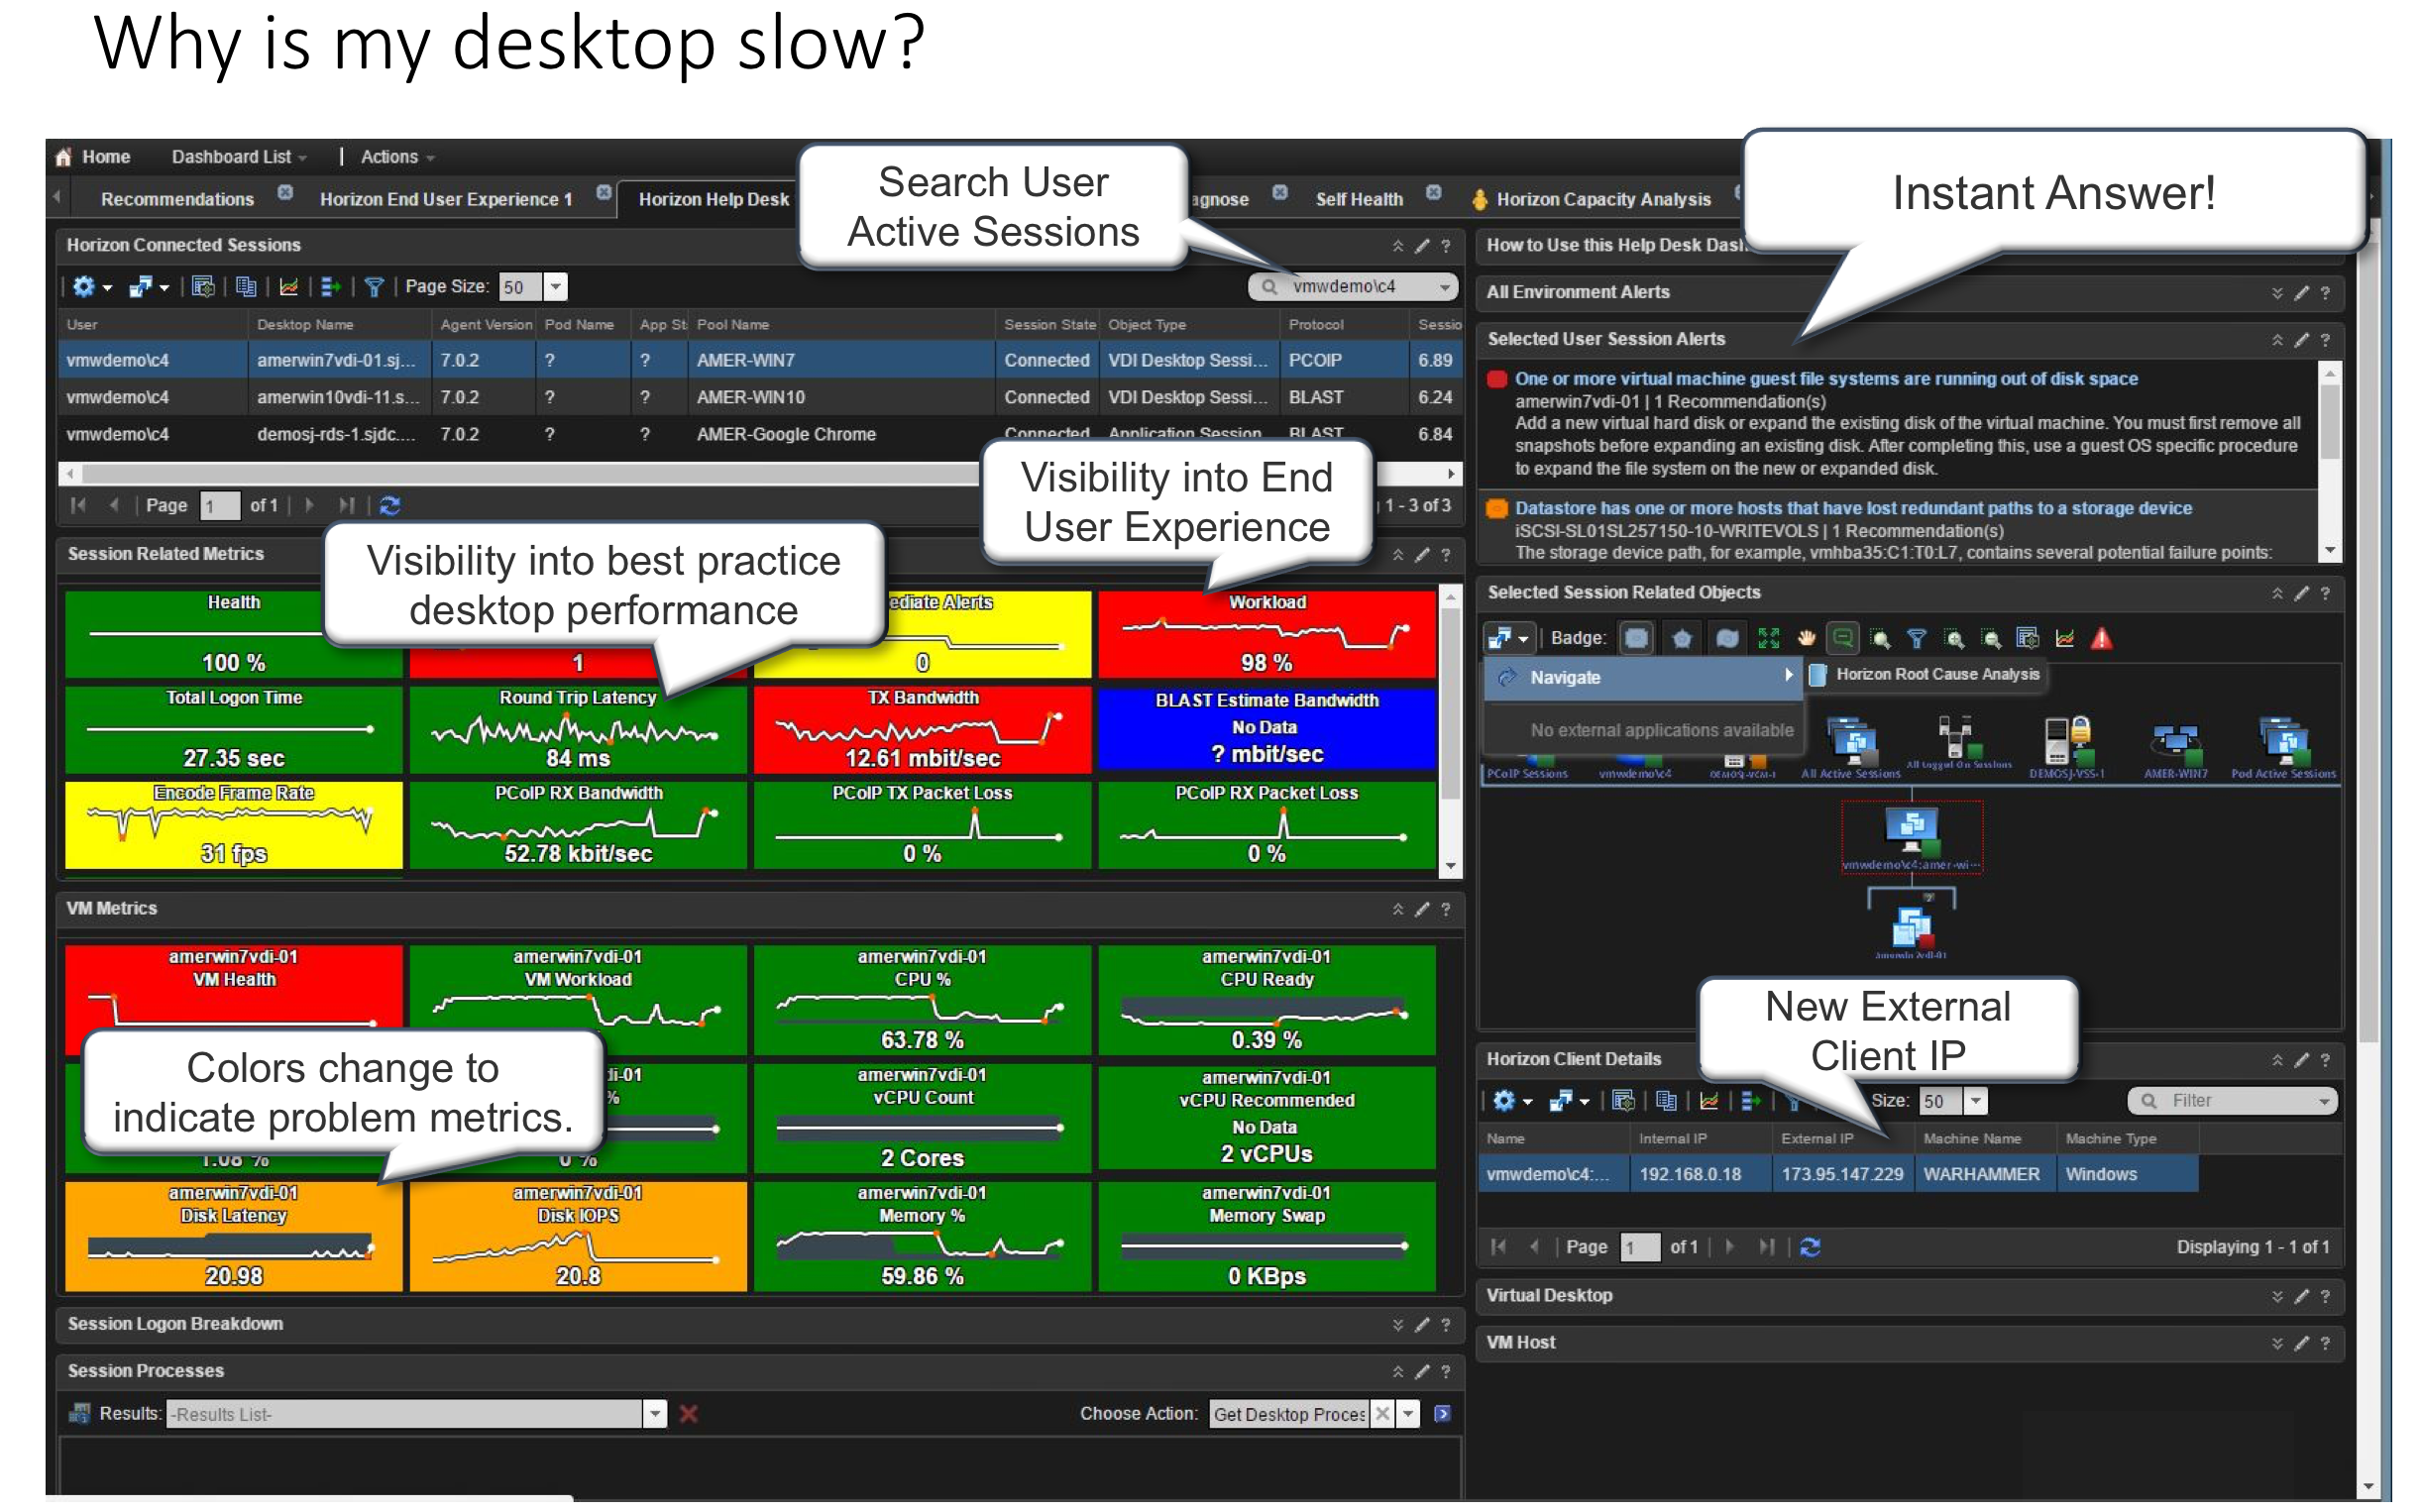
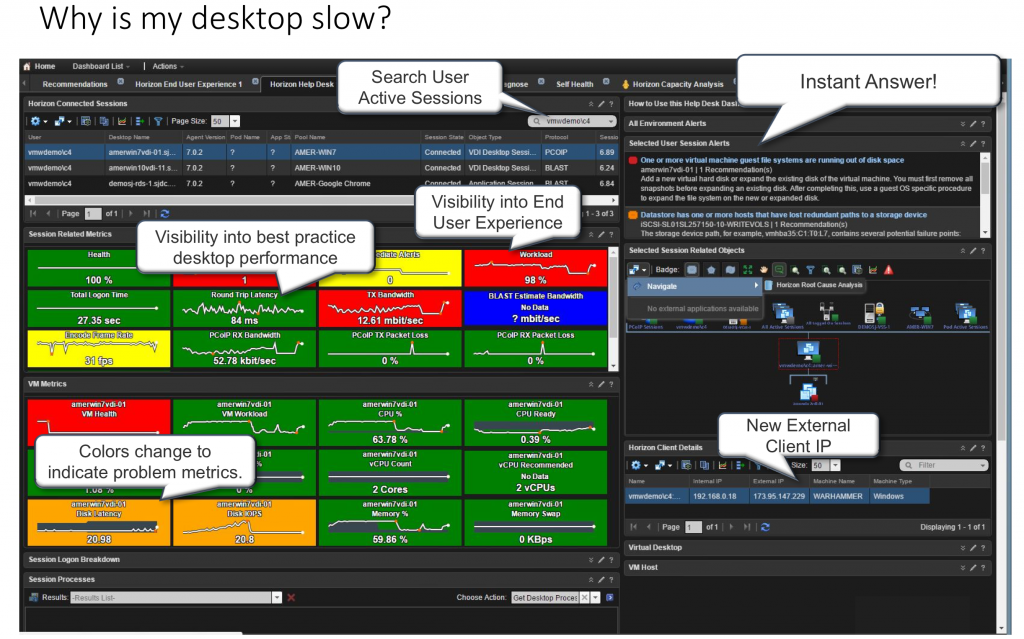
Horizon Help Desk Dashboard:
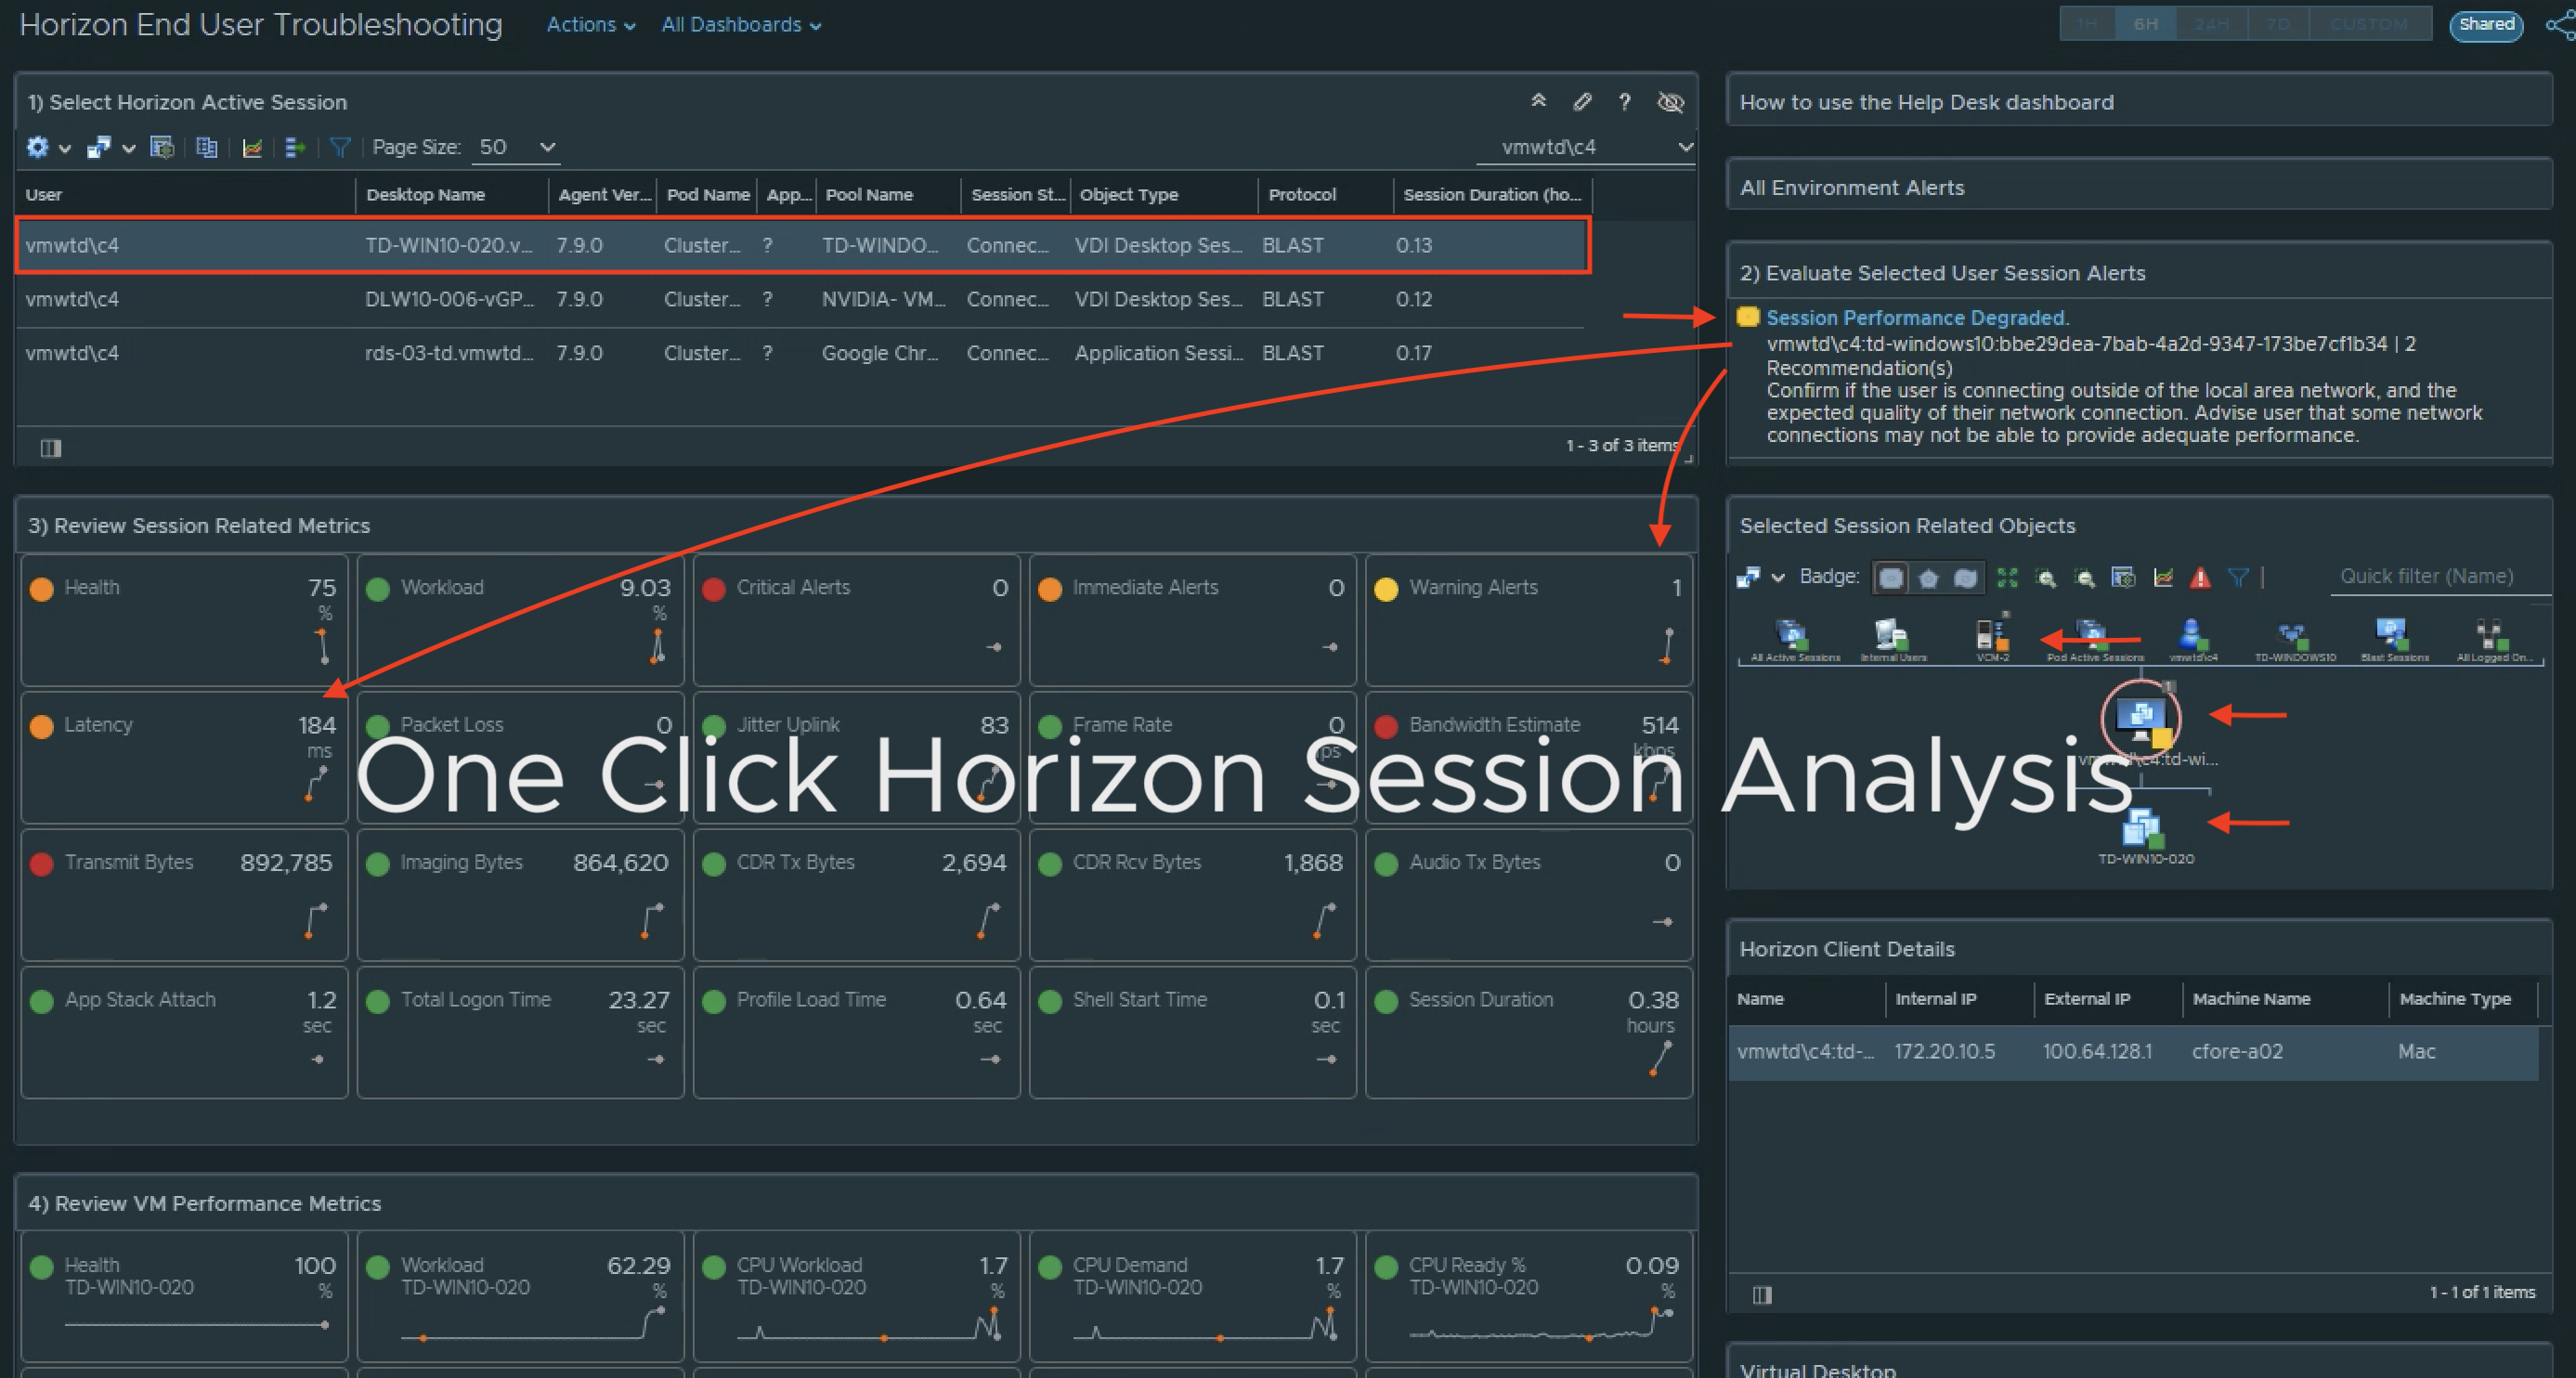
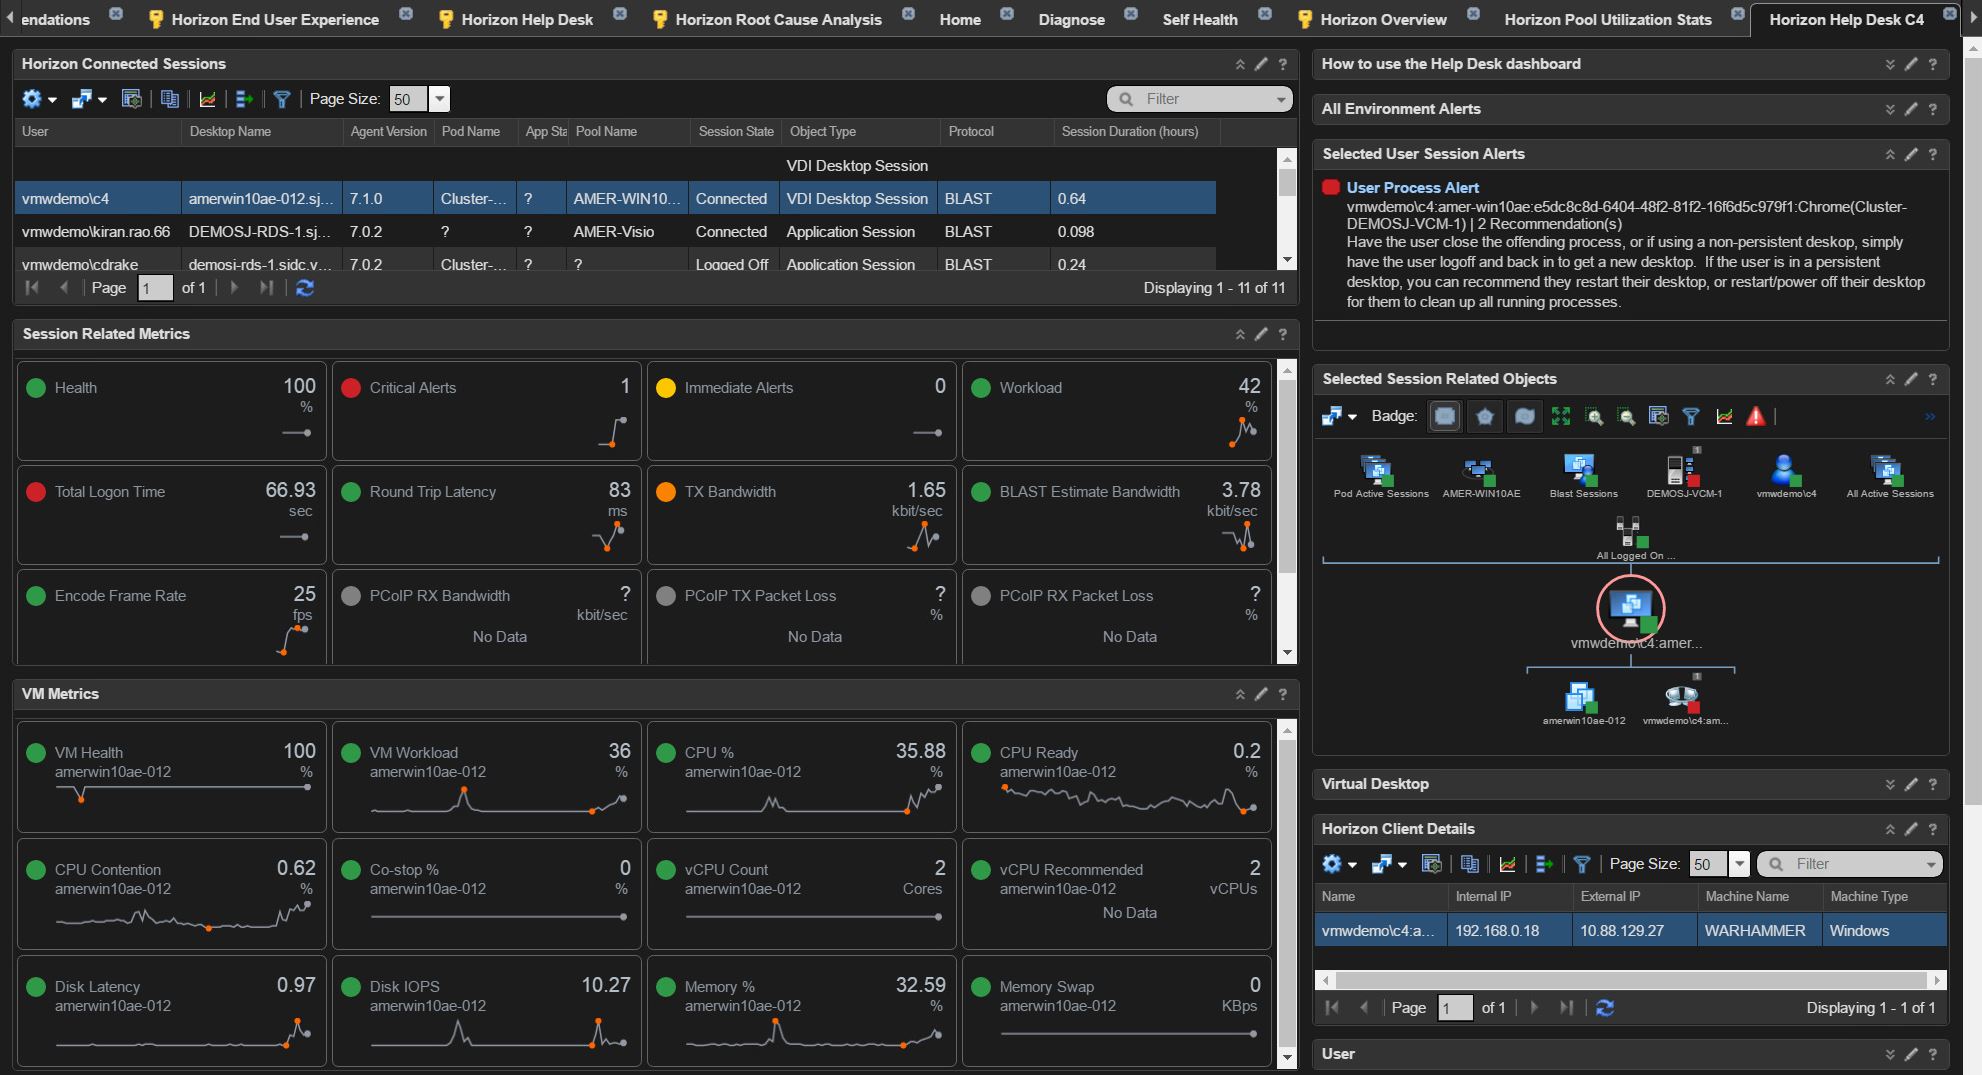
The latest Help Desk Dashboard includes Blast Session metrics and alerts, as well as an updated Horizon Client Details widget to include the External/Internal IP of the users client connecting to the environment. The navigate to “Horizon Root Cause Analysis” Dashboard functionality is available on the user session and related objects widgets.
Updated Metric Config to drive the latest Scoreboard content:
To leverage the latest Scoreboard content to see Blast Session metrics, a new metric config labeled “Session_Desktop_stats_v2.xml” is included in the latest content pack. All three dashboards included in the content pack leverage this metric config file to highlight and display key offending metrics for ease of troubleshooting. To add the new metric config, navigate to Content -> Manage Metric Config, click add new and use the exact name of “Session_Desktop_stats_v2.xml”. Then copy and paste the content of the included metric config, and click Save.
If the dashboard fails to load the content correctly, click the edit icon on the Scoreboard widgets and make sure they are pointing to the correct file name created above.
New Help Desk Dashboard with Blast Metrics and External/Internal IP visibility.
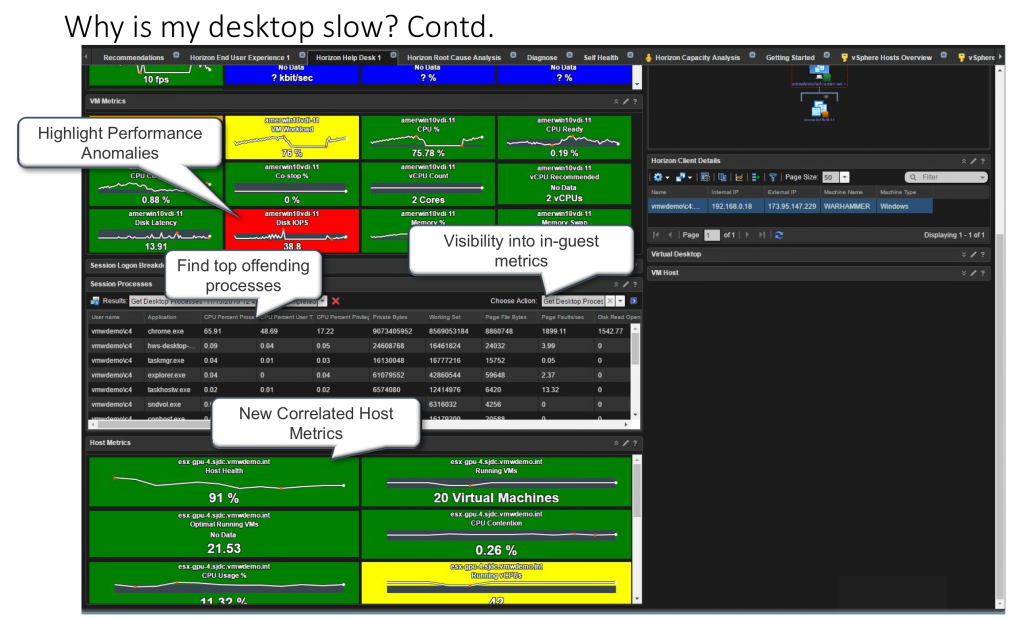
To reduce the number of clicks required for administration and add additional visibility to end-user environmental issues, a new Host Metrics scoreboard has also been added to the Help Desk dashboard. The scoreboard will show best practice metrics in green, and any metrics of concern or interest will change color (yellow, orange, red) depending on the latest reported value.
See correlated best practice host metrics without additional navigation.
New Session Alert:
In addition to the new dashboard content, Blast and PCoIP session metrics have been added to a new single alert named “Session Protocol Performance Degraded”. This replaces the existing PCoIP Performance Degraded degraded alert. This will need to be imported under the Content -> Alerts menu.
New How To Widgets available on each dashboard:
Each dashboard now contains a “How to use…” widget that provides a brief description how to quickly operationalize the dashboards. The widgets leverage a URL link back to this website to display the latest instructions on how to use each dashboard. If the widget doesn’t display the text correctly, make sure that the URL referenced in the edit widget screen is resolvable.
**Note that most of this content will be available out-of-box in the vROPs for Horizon 6.4 release due Dec 2016. Additional custom content will only be available from this website.
Click to Download latest vROPs for Horizon Content 8.3 **download removed
Getting More out of VMware vRealize Operations for Horizon training video:
In this training video you will learn how to quickly operationalize the vROPs for Horizon solution, and how it provides end-to-end visibility into issues plaguing your Horizon View users. Learn how to use the latest Help Desk dashboard to get instant insight into “Why their desktop is slow”.