When it comes to managing critical Horizon management servers such as Connection Servers, Unified Access Gateways, AV Managers, etc… It is imperative that you properly monitor their services for availability and that none of them are in a failed state, as well as make sure there are no connectivity issues on internal networks that the Horizon Client traffic traverses. By leveraging the Telegraf agent HTTP Health Check and PING Check functionality with Aria Operations, we can provide additional insight into the Health, performance, and availability of these services.
This video is meant to provide high-level overview of:
Why you should leverage Telegraf with the Management Pack for Horizon
How to install and configure the Telegraf agents.
How to validate your settings after deployment.
Review of the dashboards that leverage Telegraf metrics.
The latest release of the Management Pack for Horizon 2.7 is now available for download on the VMware Marketplace, as well for SaaS hosted customers in the Aria Operations Integration Repository. This post will cover the latest feature enhancements to the Management Pack and how best to leverage them.
Top Feature Enhancements
Added support for Horizon 2309
Updated Horizon Session Data Collection model
New Cost and Pricing Dashboards
Improved Deployment and Scale considerations documentation
As new editions of Horizon are released with updates to the APIs, there is usually a slight lag for supporting the new version until we are able to test and certify compatibility. That is why I highly recommend checking the interop guide to ensure that your specific version of Horizon matches the version(s) of the MP that has been tested and validated.
For Horizon 2309,only MP4H version 2.7 is supported due to the API changes mentioned above. As we move forward and continue our migration from the VLSI APIs to the REST APIs, our hope is that supporting future versions of Horizon will be much simpler and allow for near zero day support.
Updated Horizon Session Data Collection Model
When the MP4H was originally created there were certain Horizon Metrics that were inadvertently created as Properties. Because their values are numerical in nature and were prone to updating frequently, this triggered platform level alarms in terms of performance and scalability, as Aria Operations does not expect Property values to change frequently.
As of MP4H 2.7, Last Session Duration, Session Start Time, and Session Status will now appear as Metrics instead of Properties.
Additionally, we have added the ability to support Kiosk or multiple sessions from the same User ID in the same VDI Pool. Previously, if the same User ID logged into the same pool, only one User Session object was visible and it was not feasible to troubleshoot a single instance of that User ID in the pool. Moving forward, a new session “instance” will be created for each additional session with an incremental appended numerical value at the end. This new model will allow each session to have its own unique performance metrics and session properties, so that each session can be evaluated for performance issues.
New Horizon Costing and PricingDashboards
In MP4H 2.6, we added the ability to calculate Cost and Pricing metrics for Horizon Users, VDI Pools, and RDS Farms. With the new Cost and Pricing Dashboards we are able to provide additional Insight into Cost vs Pricing analysis for the entire Horizon Service.
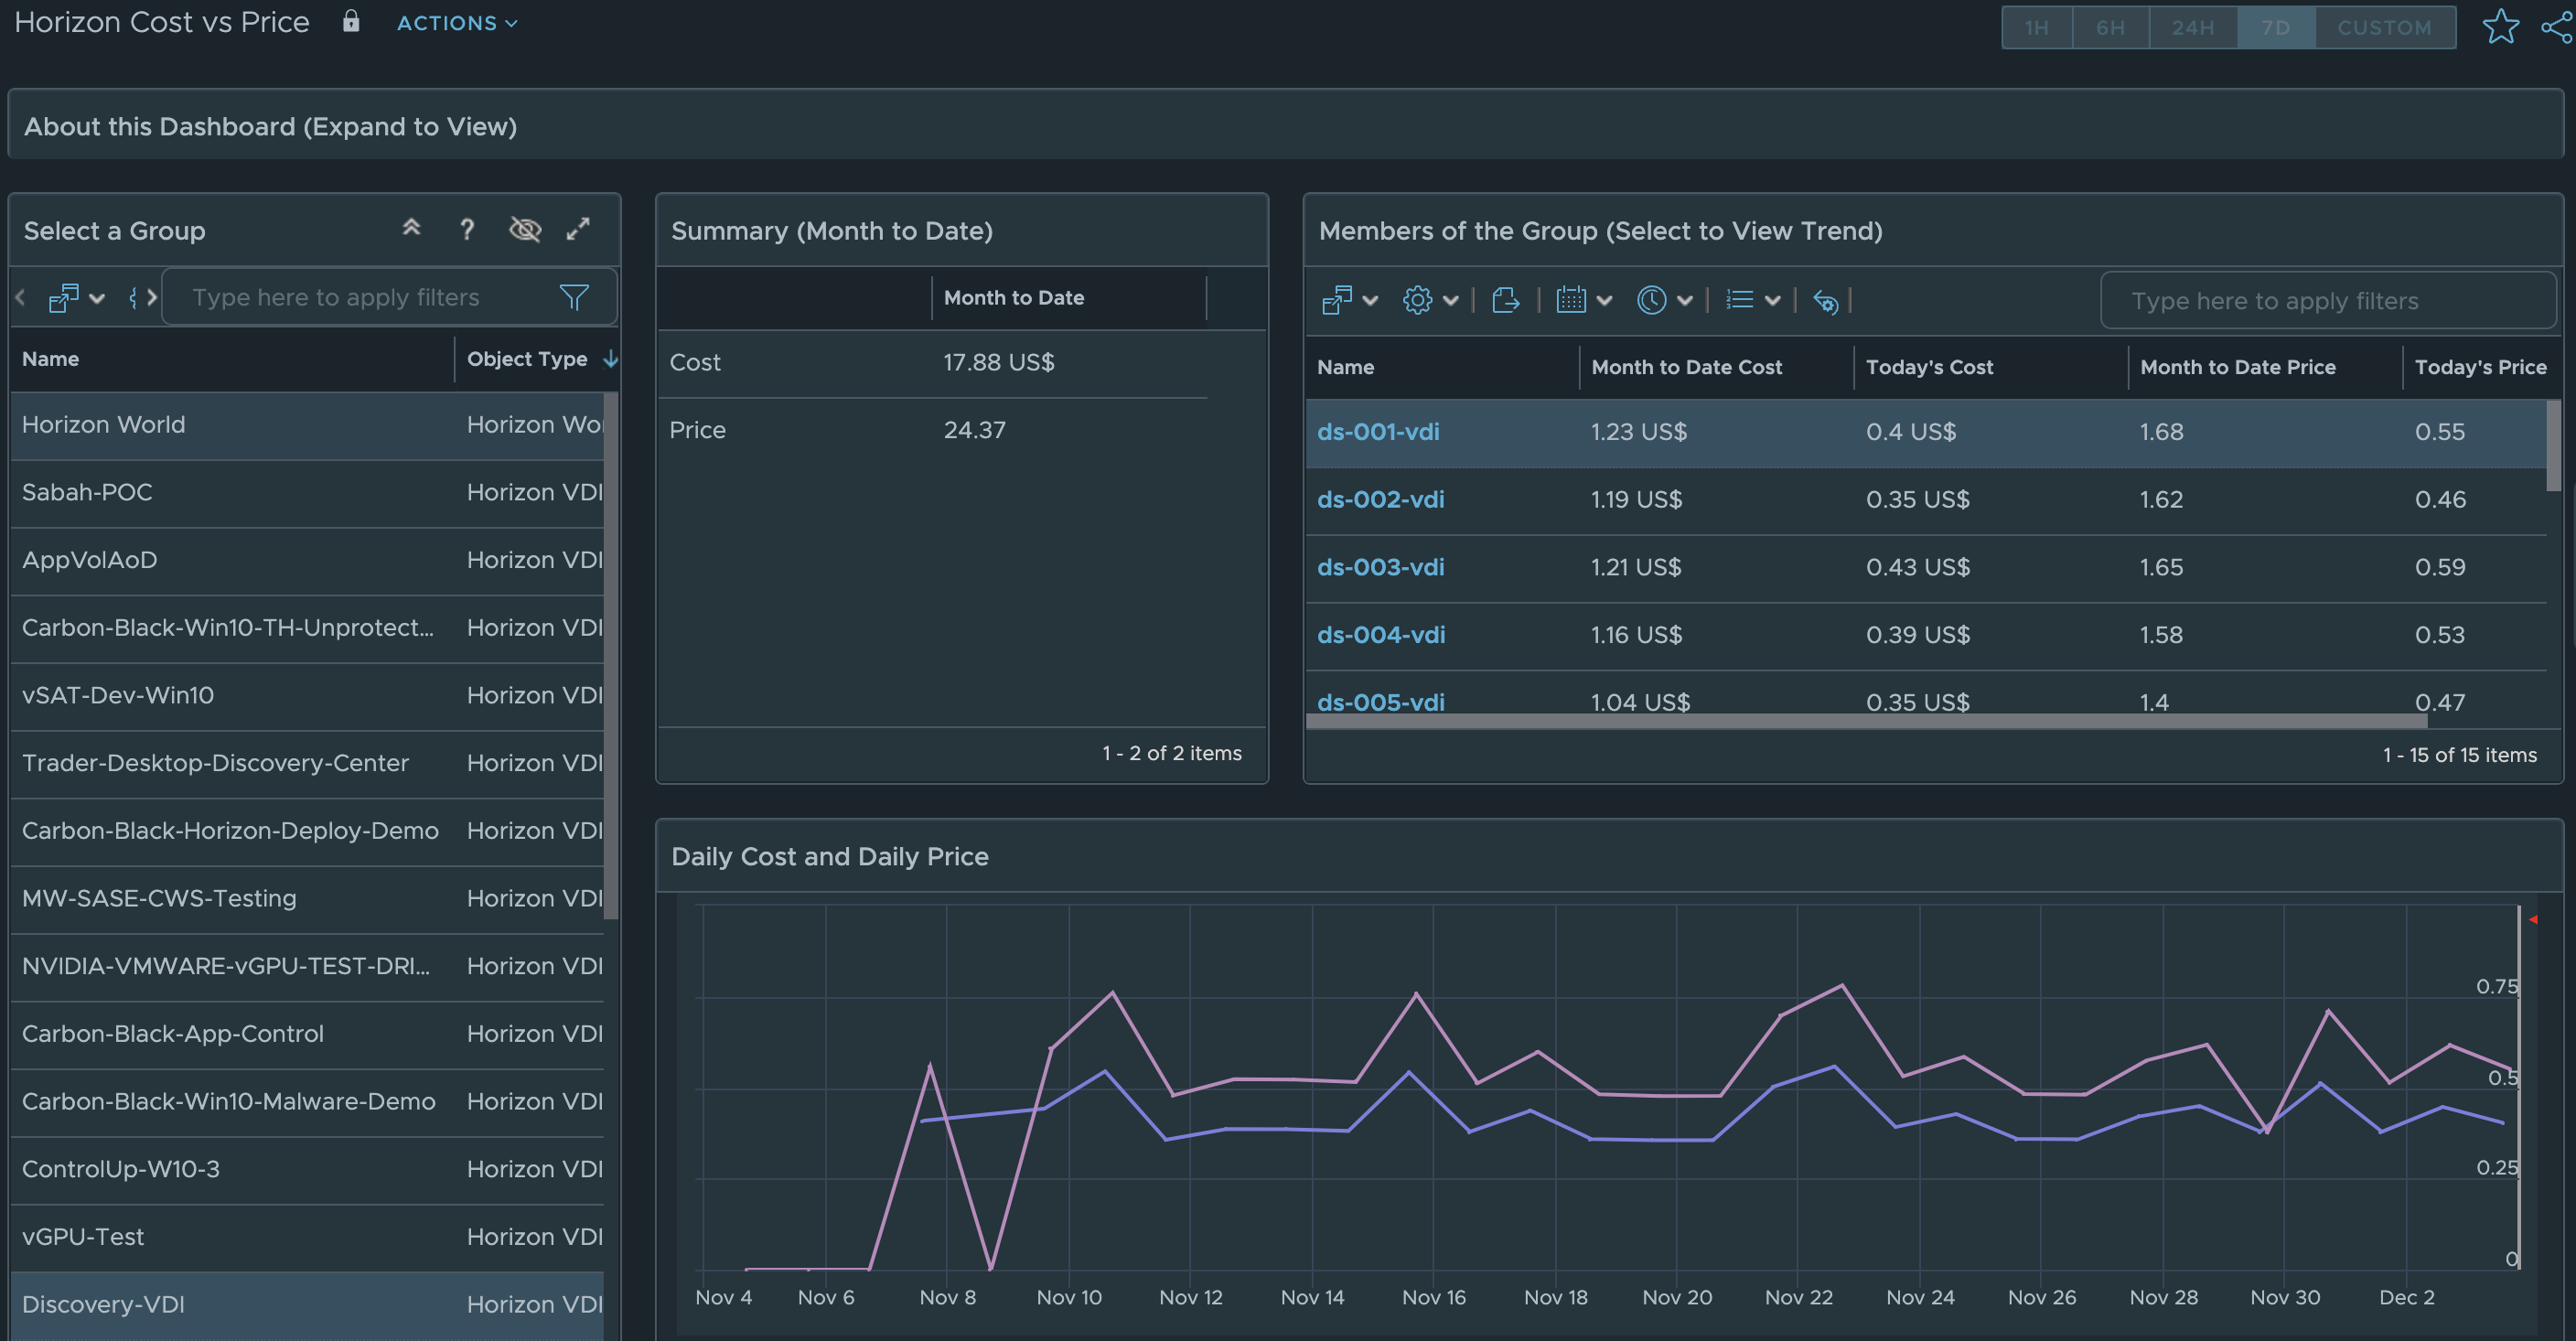
From the Horizon Cost vs Price dashboard, simply select the Horizon World object for the entire service, or select an individual VDI Pool or RDS Farm, to see the Cost vs Price analysis.
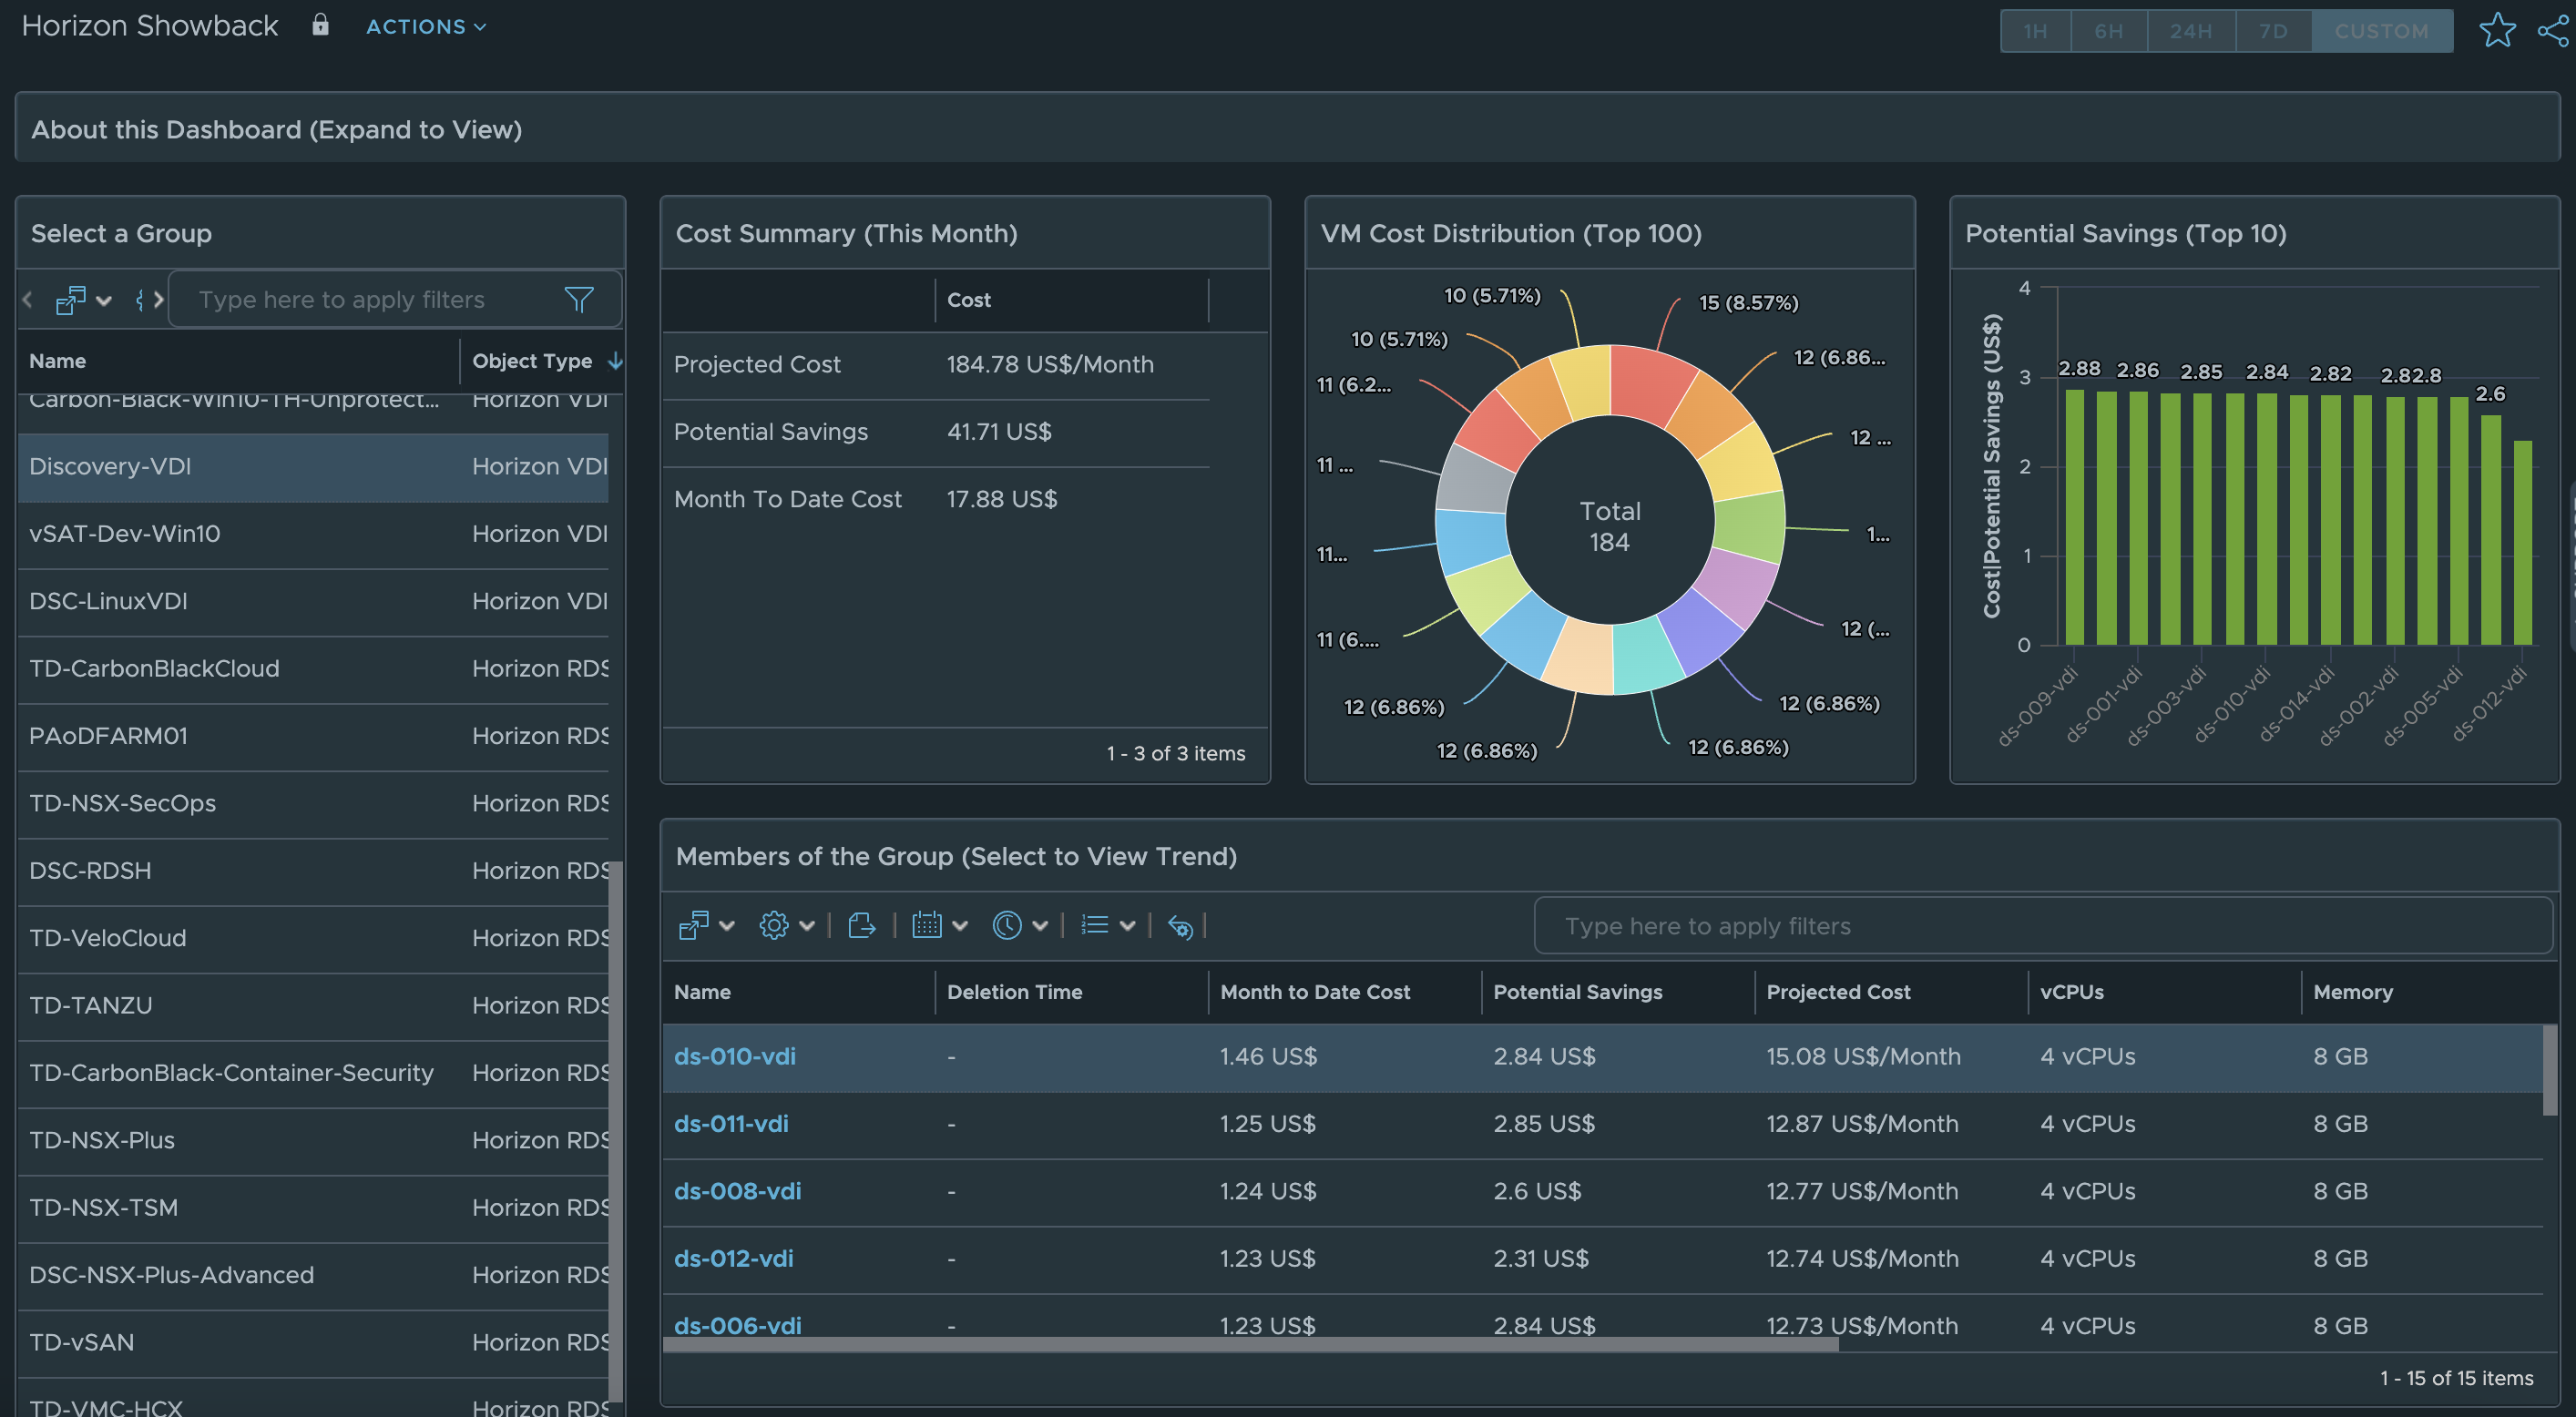
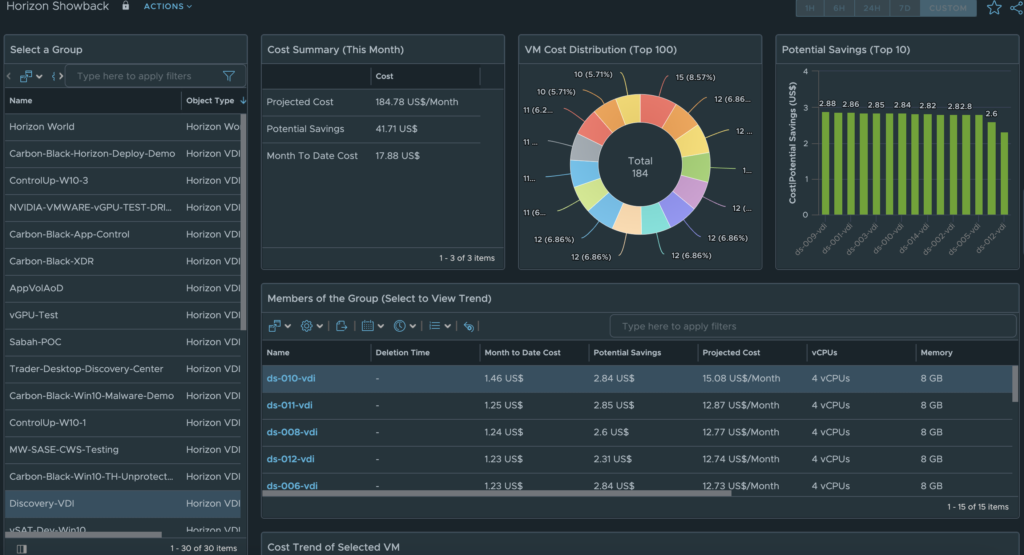
The Horizon Showback dashboard shows the actual Cost for the Horizon Service. As before, simply select the Horizon World, VDI Pool, or RDS Farm to see cost analysis for the selected object.
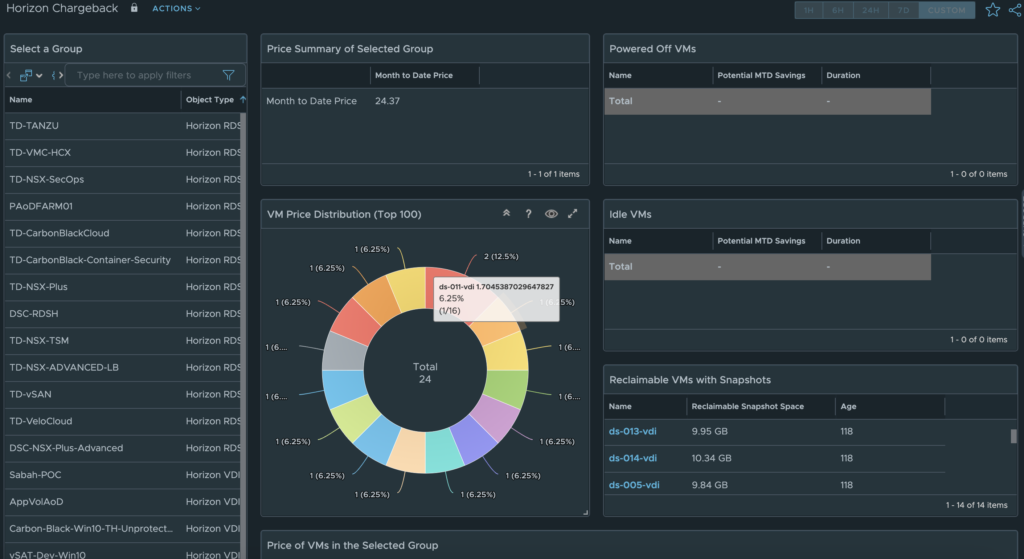
Finally, the Horizon Chargeback dashboard shows the Price (cost + service charges) for the entire Horizon Service (Horizon World object), or the selected VDI Pool/RDS Farm.
Improved Deployment and Scale considerations documentation
While the topics of deployment and scale considerations have discussed in previous blog posts, it was imperative that we included these topics in the product documentation, so that all customers can easily access them. The documentation can now be accessed in the link below.
With the latest release of the Management Pack for Horizon the priorities were to maintain compatibility with the latest release of Horizon, improve the Horizon VDI session data model to support kiosk use cases and ensure better platform performance, provide better insight into Horizon Cost and Pricing use cases, and provide easier access for all customers into critical documentation topics.
Stay tuned for more feature and content updates on the next release…
In the latest major release of the Management Pack for Horizon we are announcing a number of new features and content to improve end-to-end visibility of the Horizon service, scale, as well as new VDI Pool and RDS farm automations. This blog will focus on providing additional insight into what features were released and how they relate to providing additional value and insight for monitoring a Horizon deployment. To keep the blog from running too long, I’ve decided to break it into multiple parts.
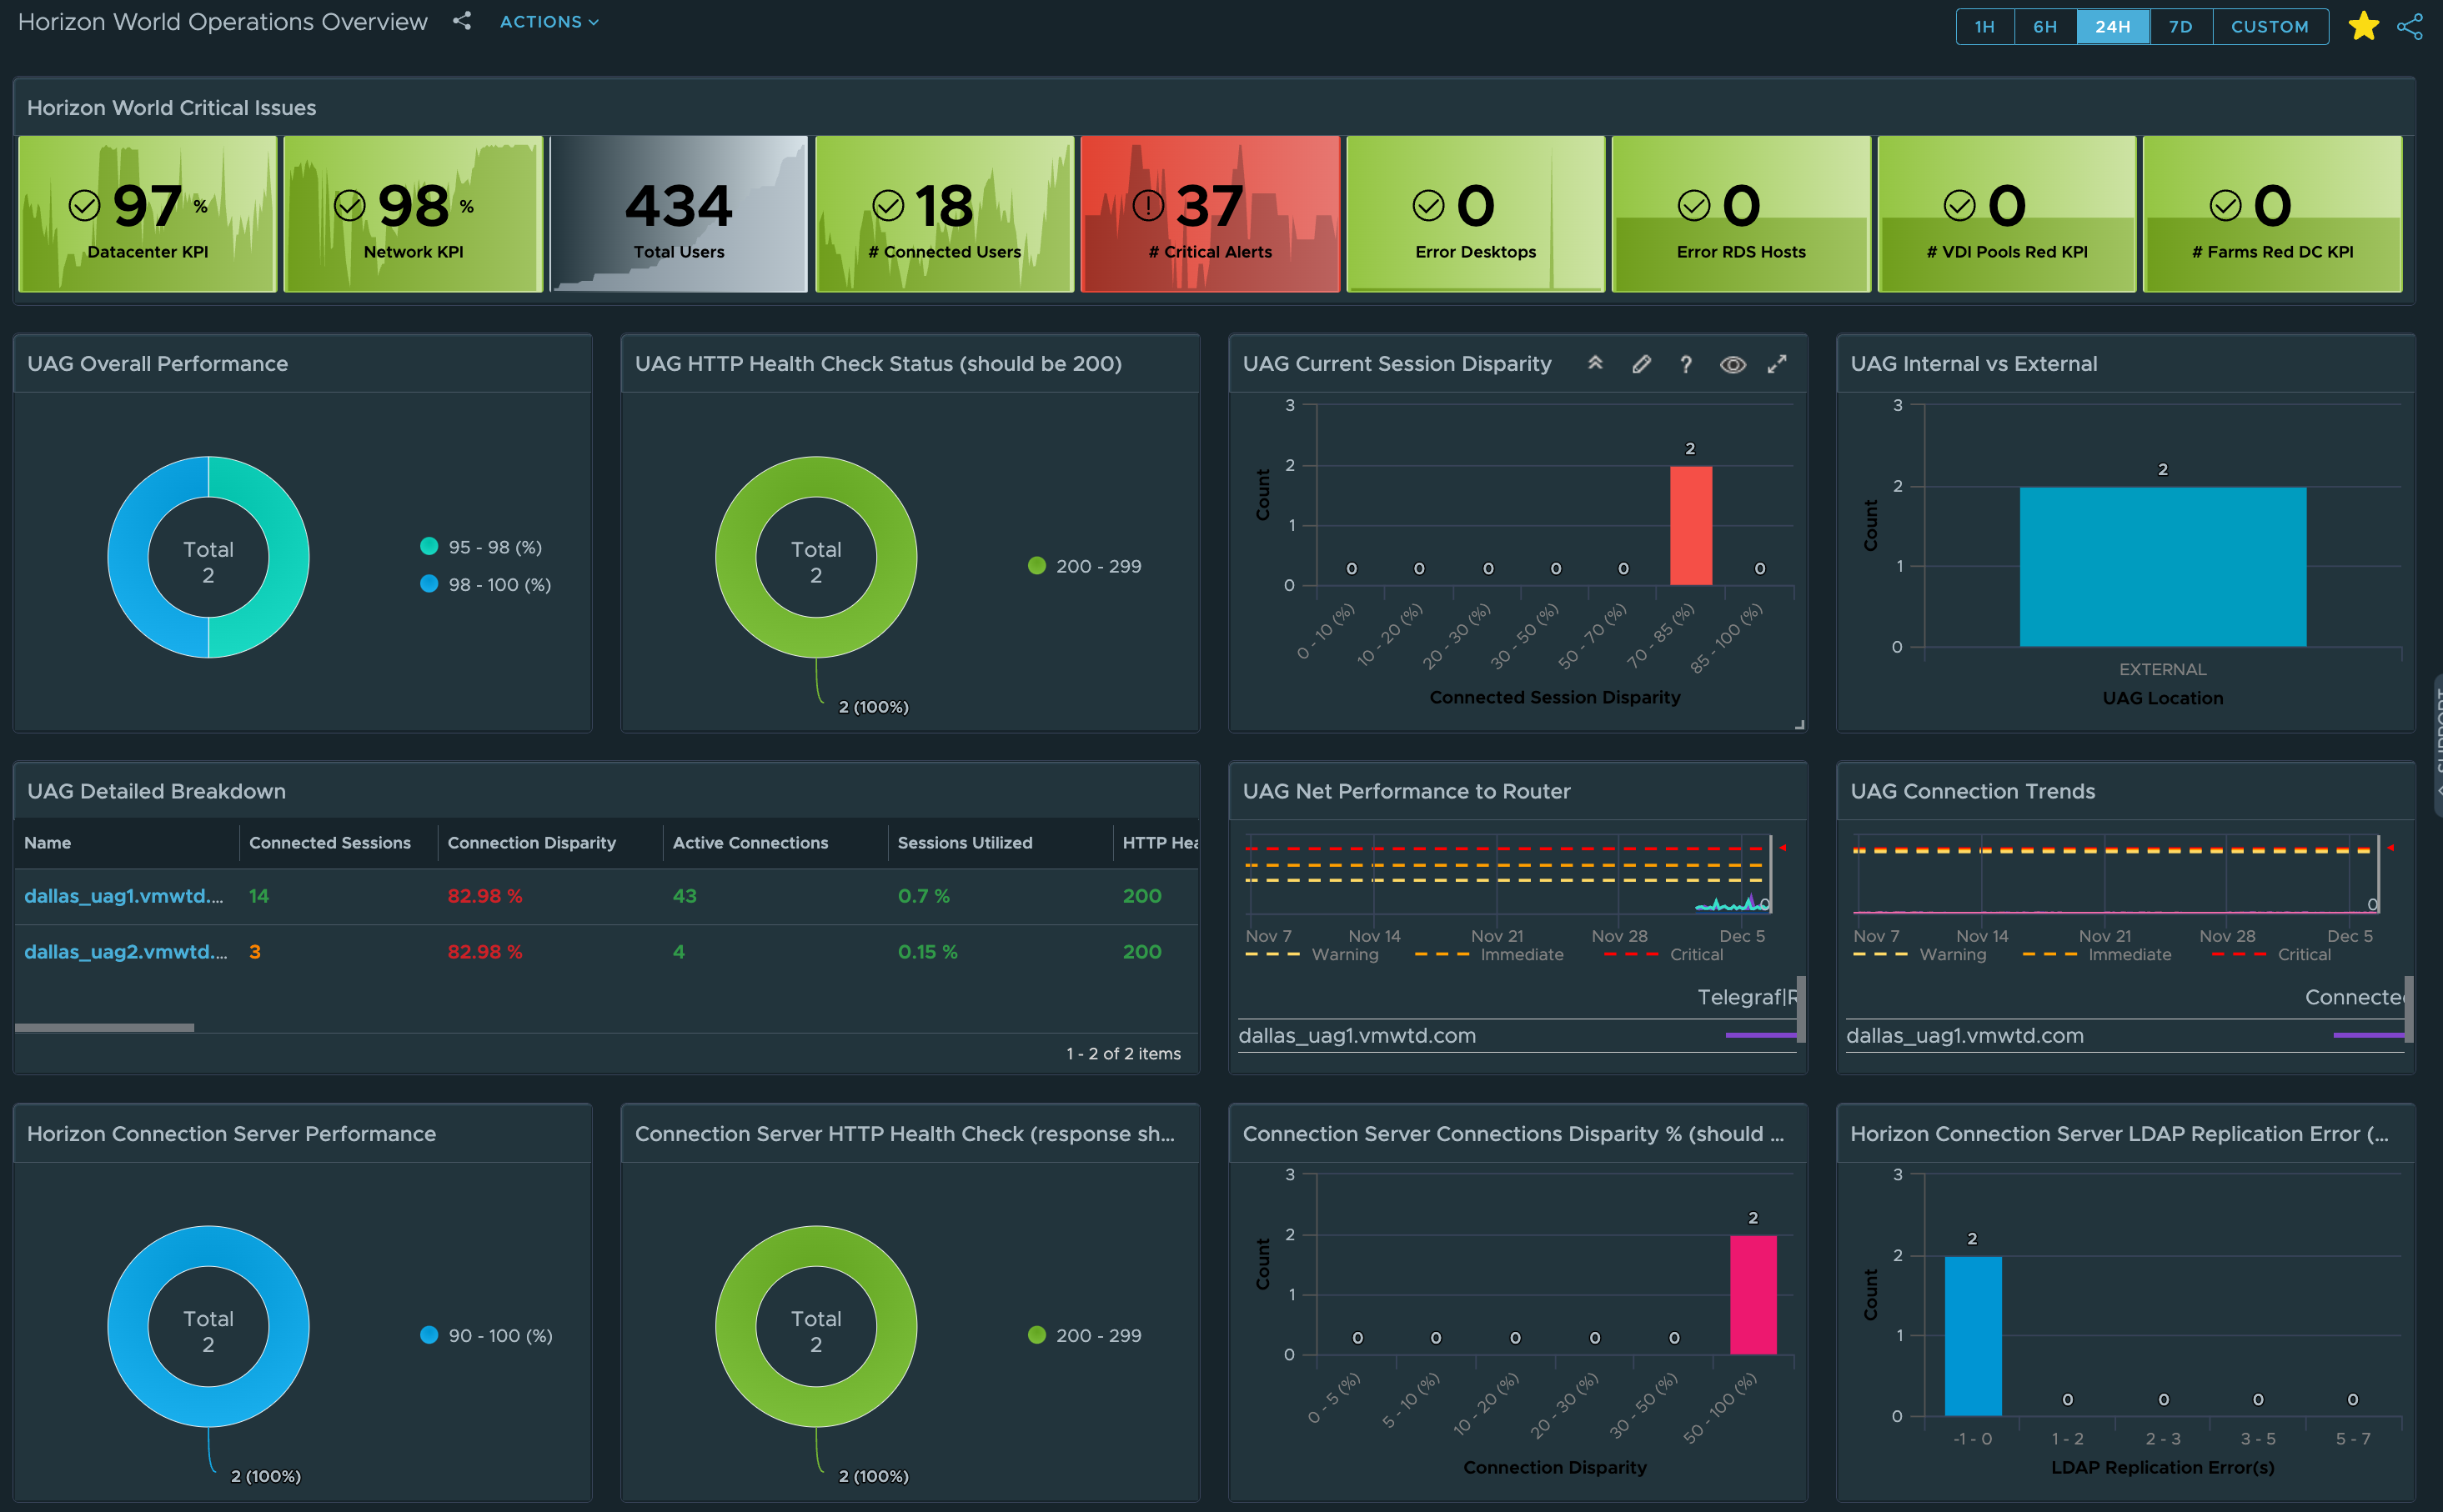
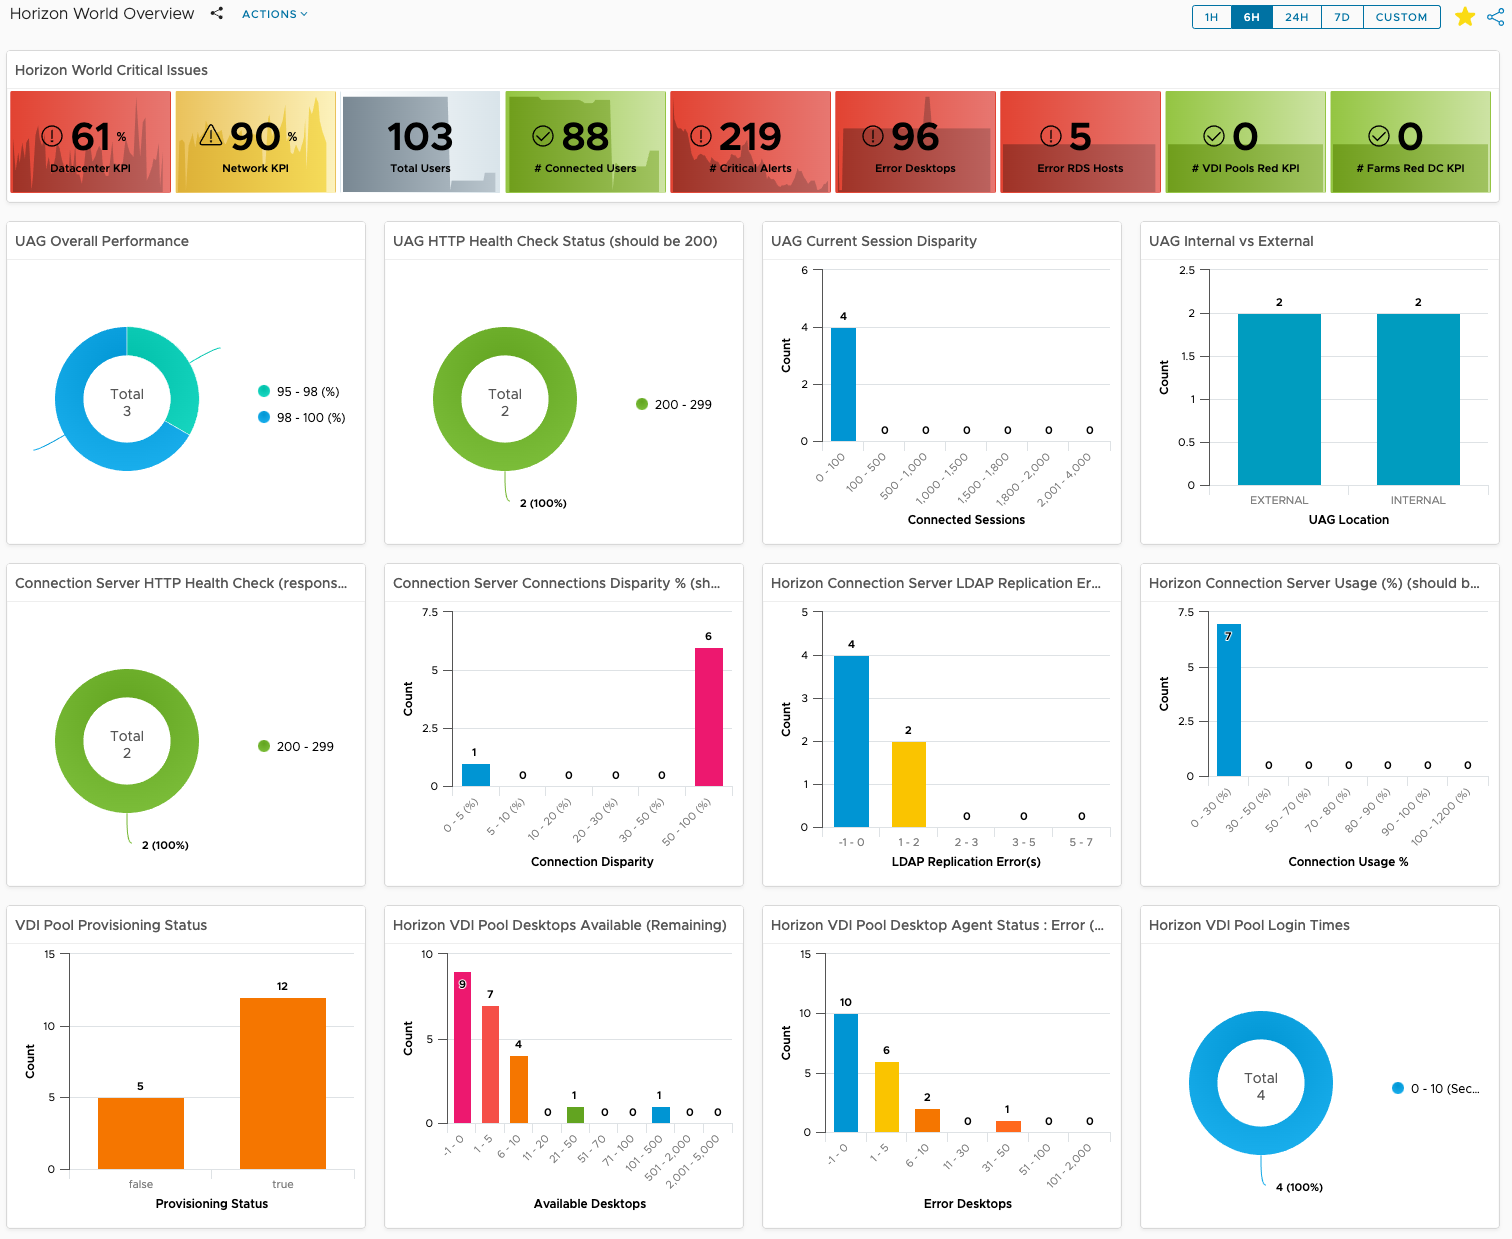
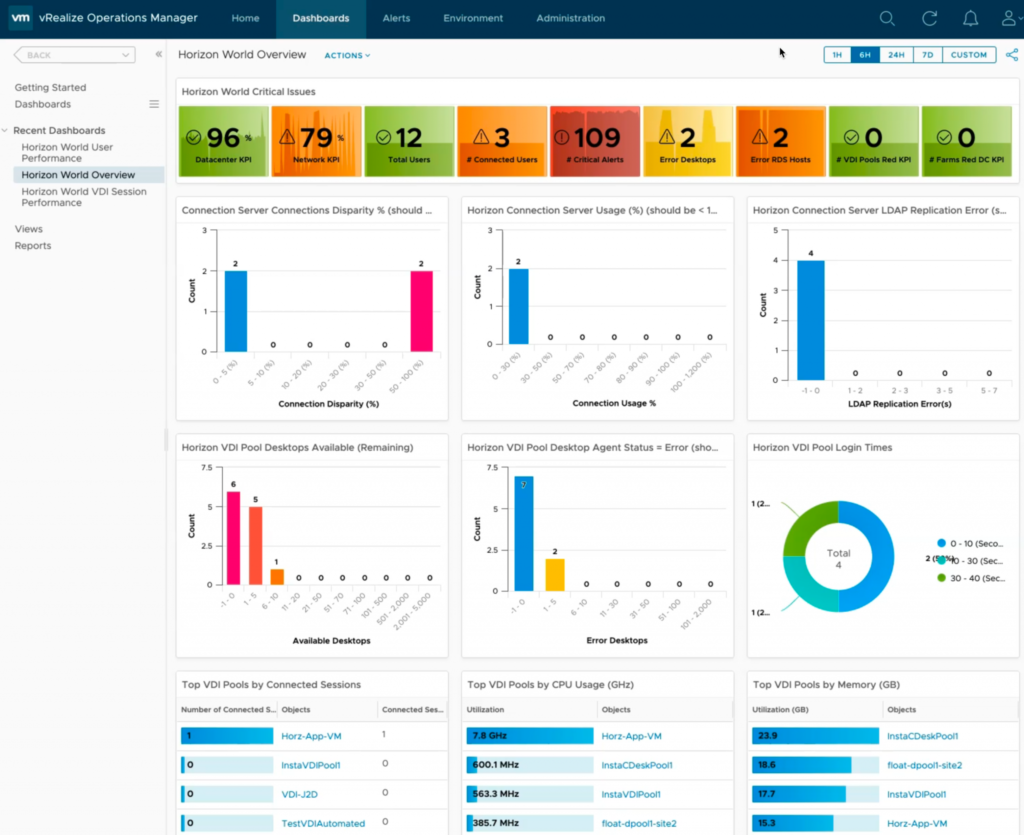
The new Horizon World Operations Overview dashboard is an upgrade/replacement of the previous Horizon World Overview dashboard. As the name suggests, this dashboard is highly focused on providing “operational” insight into the overall Horizon service in terms of performance, risk, availability, and compliance.
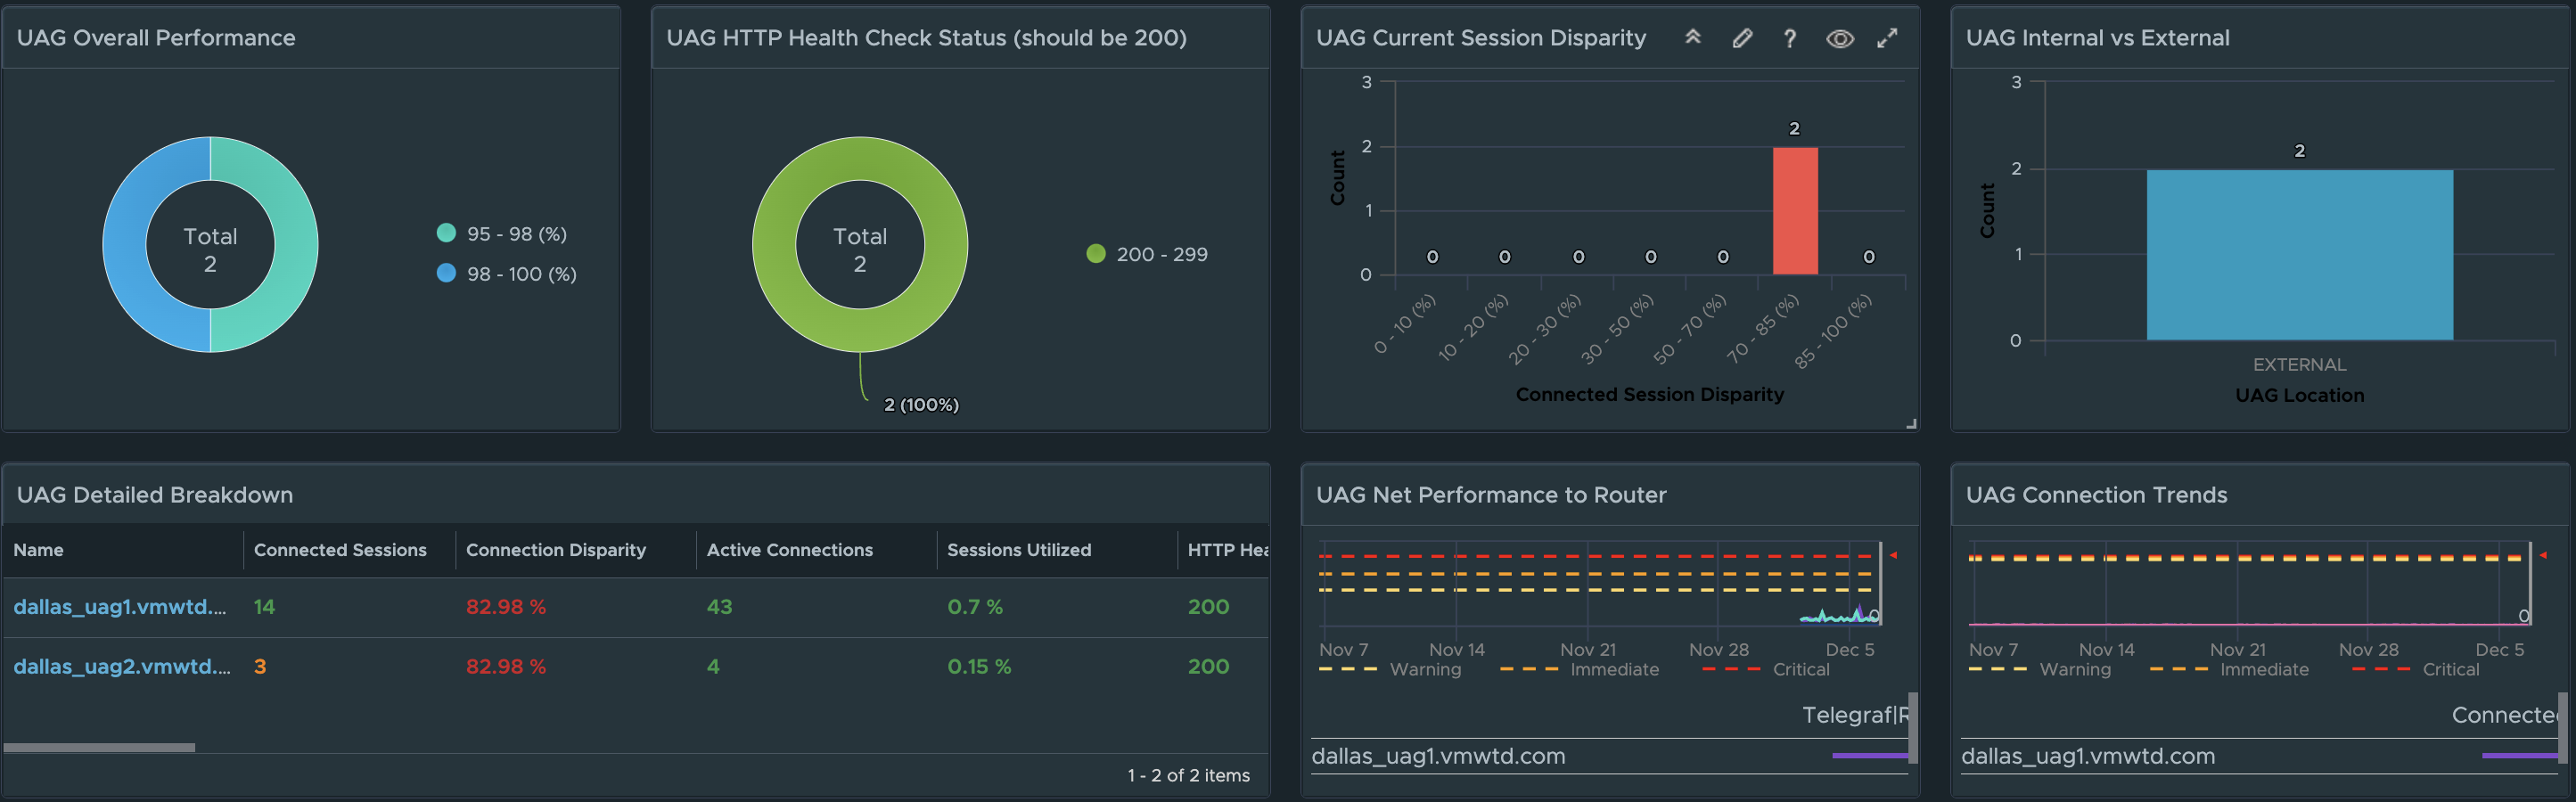
Unified Access Gateway Visibility
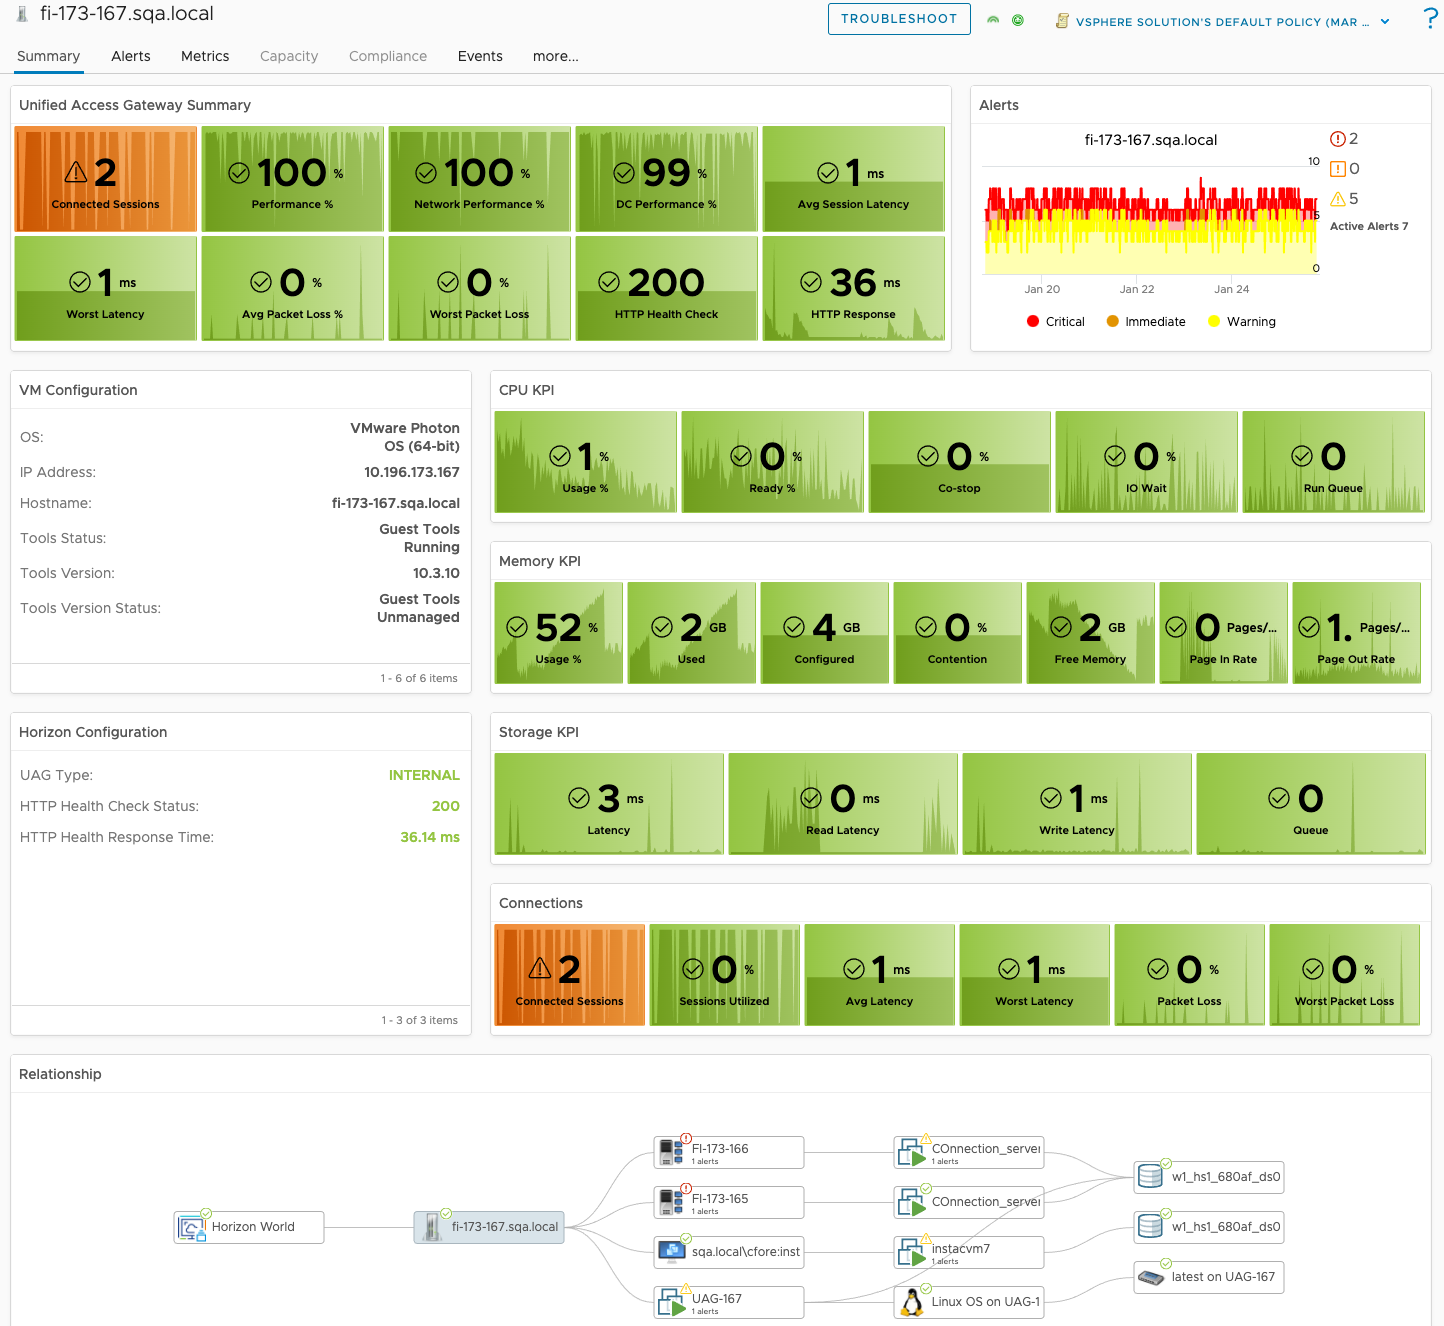
In the first image, we can see overall UAG and associated session performance, as well the the health of the Horizon service for the UAG. UAG session disparity shows “in-balance” on how Horizon sessions are being load balanced across the available UAG’s in a Horizon Pod. A detailed UAG List view has also been added to make it simpler to sort and list UAGs by their critical KPIs.
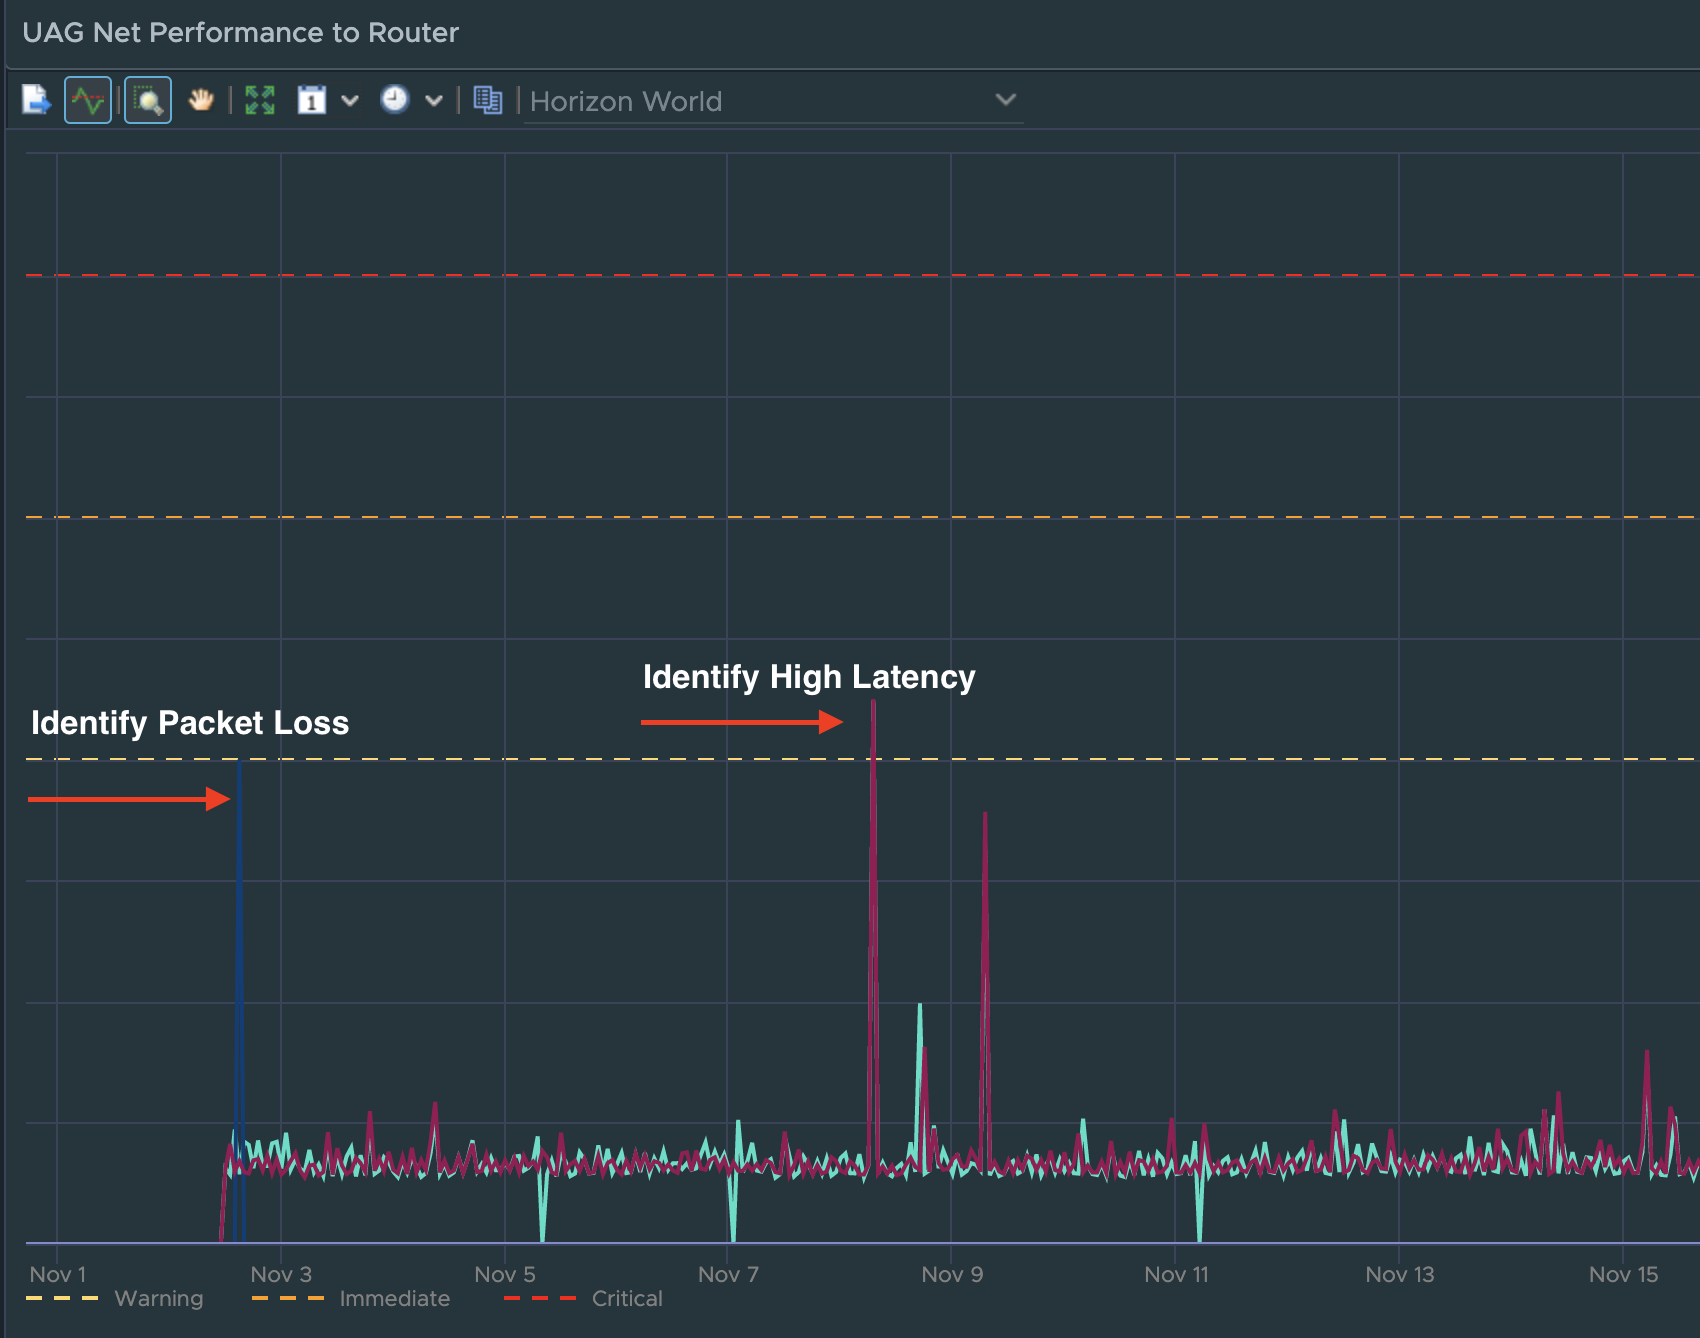
Taking advantage of the new UAG “Route Latency” and “Route Packet Loss” monitoring feature, from a single dashboard we can monitor overall performance and availability of designated routes across all UAGs. If a specific UAG experiences high latency or packet loss for a specified route, the provided chart will show the additional performance overhead the network route is having on the UAG’s connected sessions.
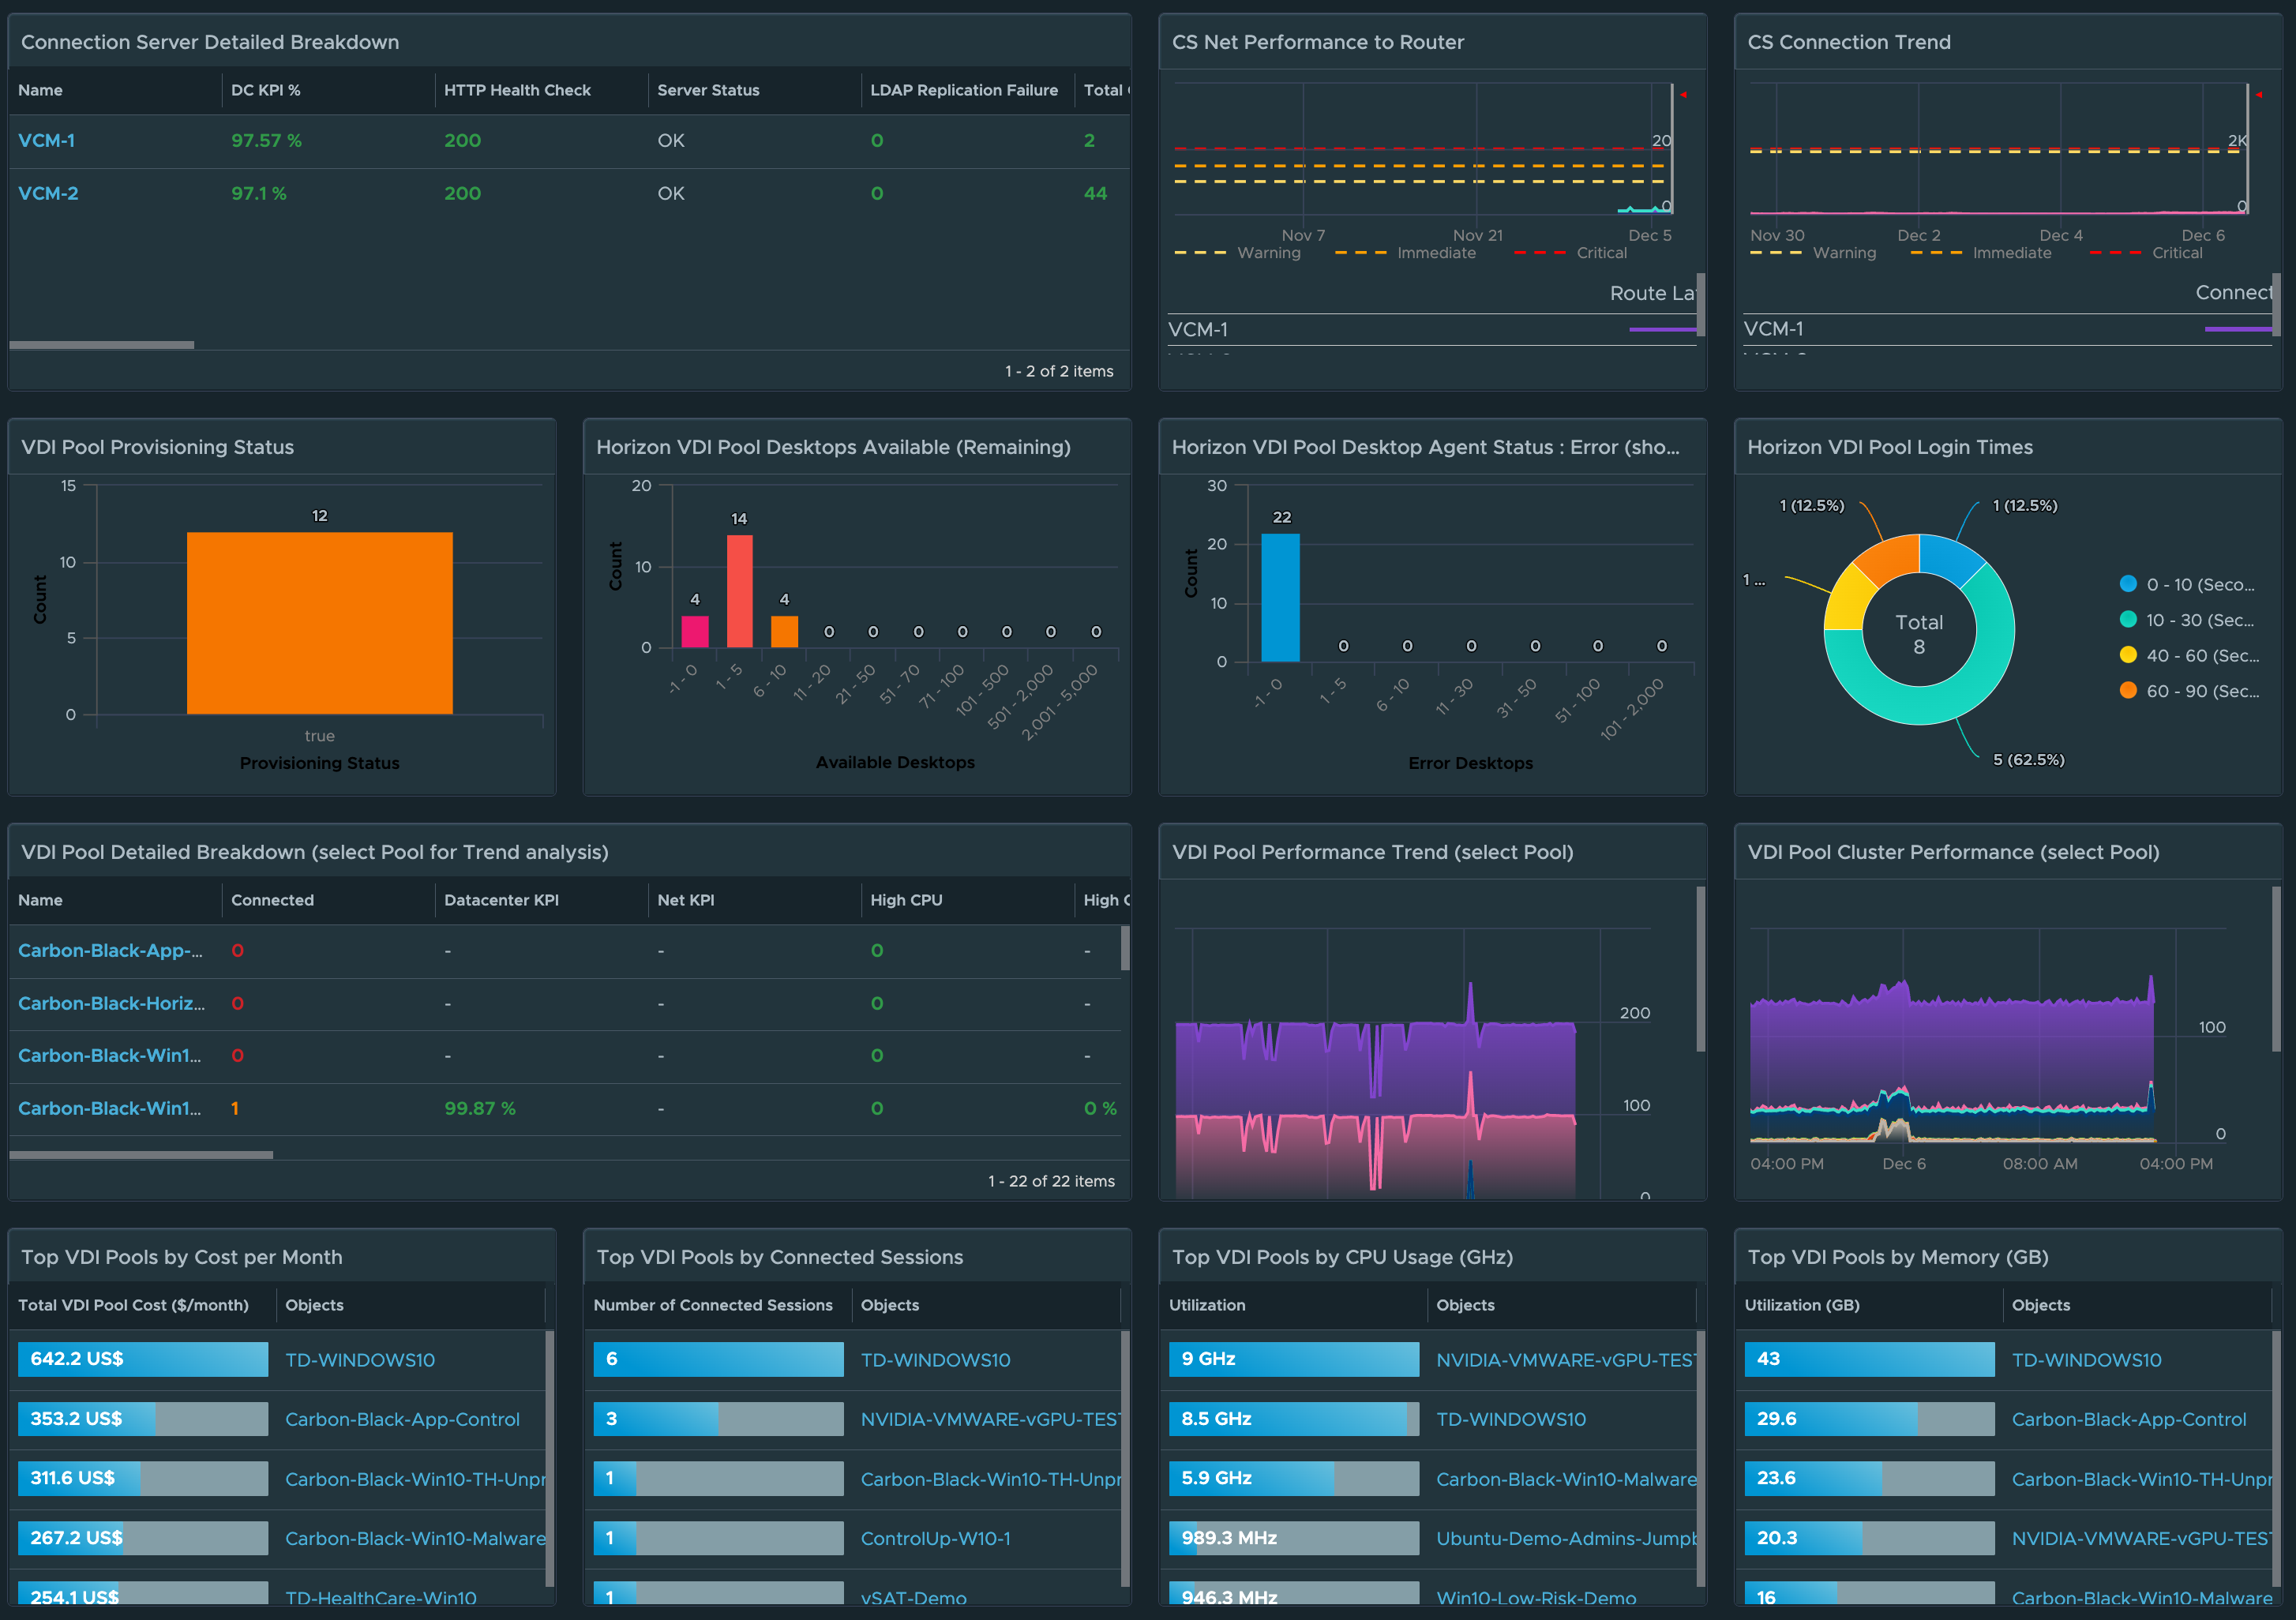
Connection Server Visibility
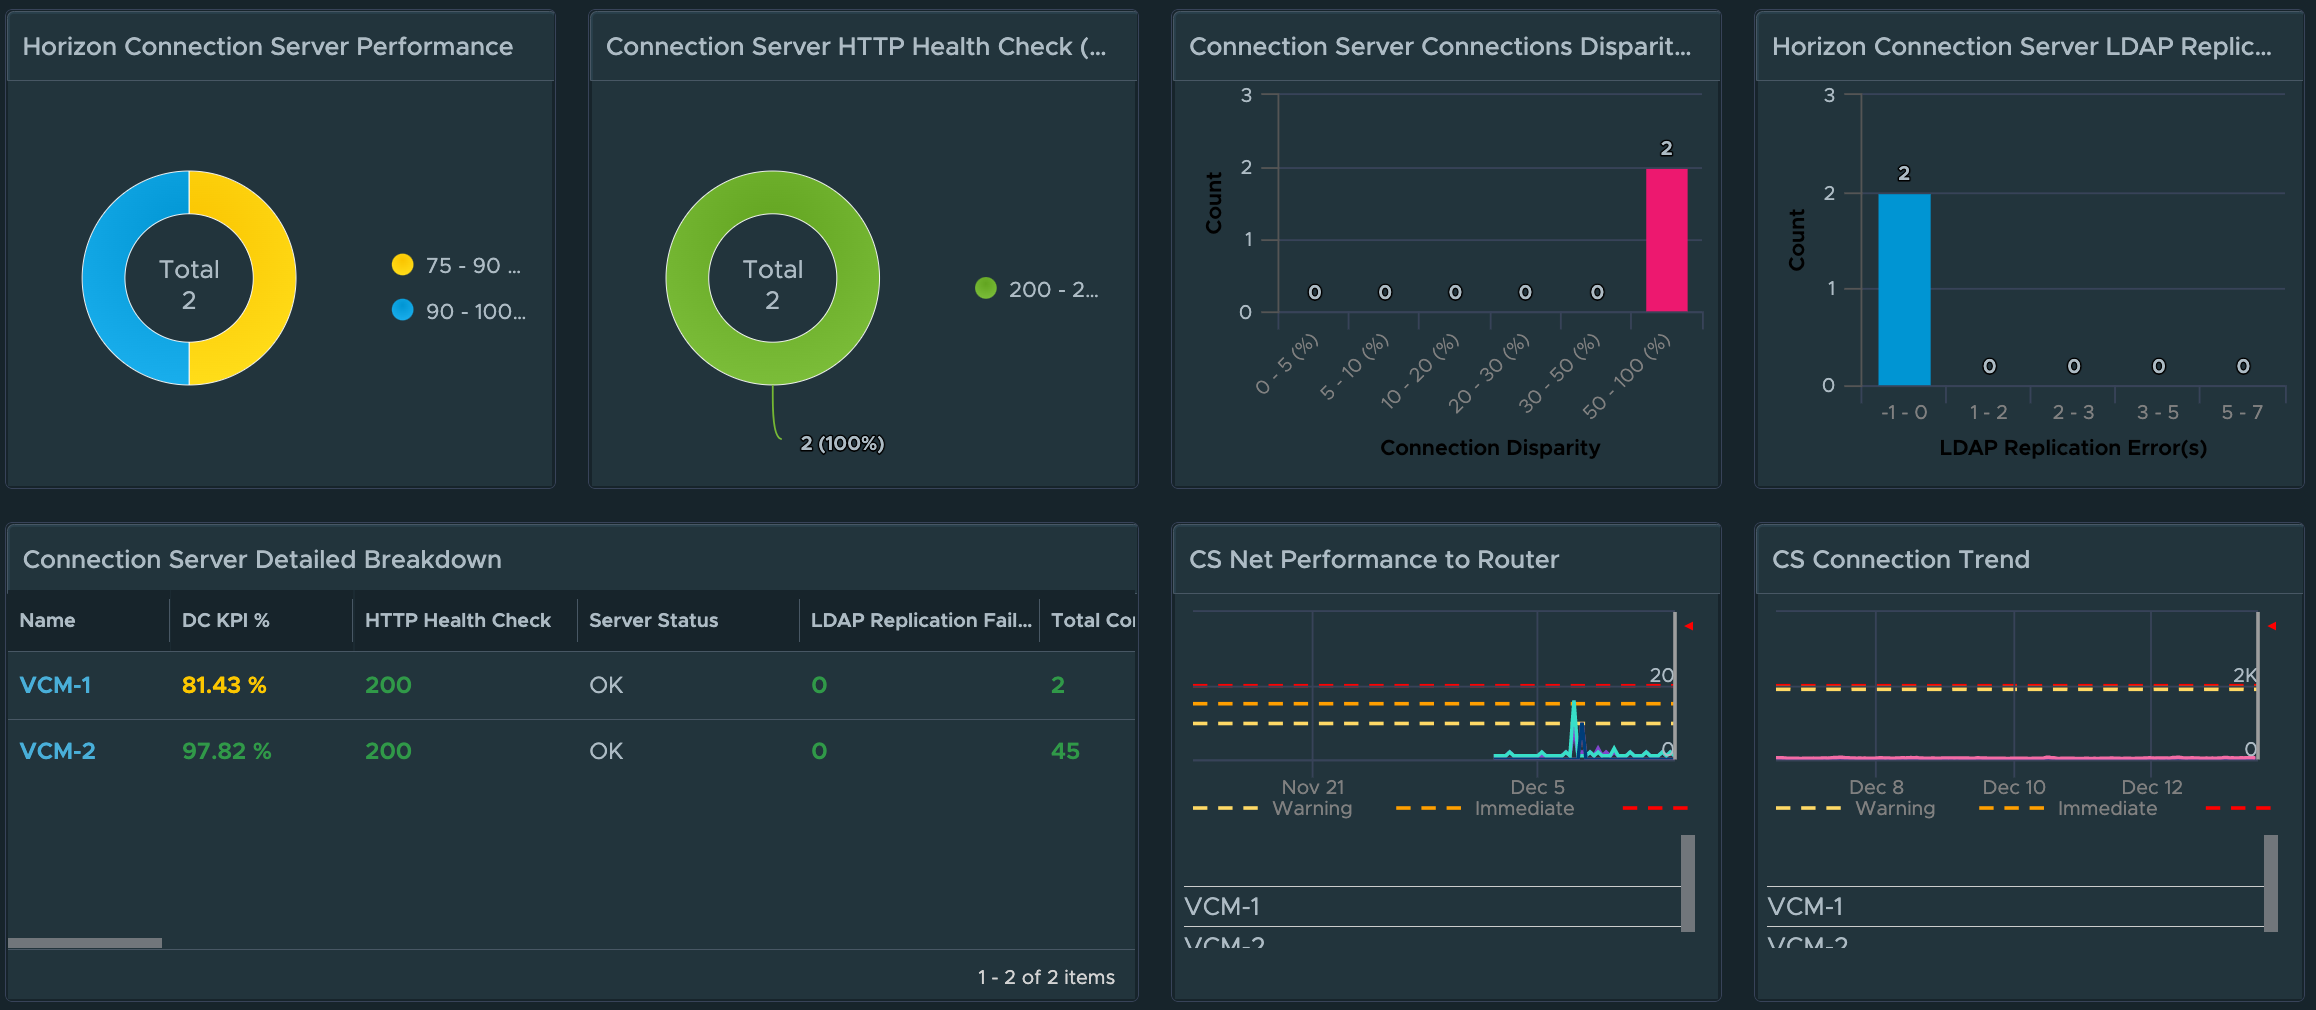
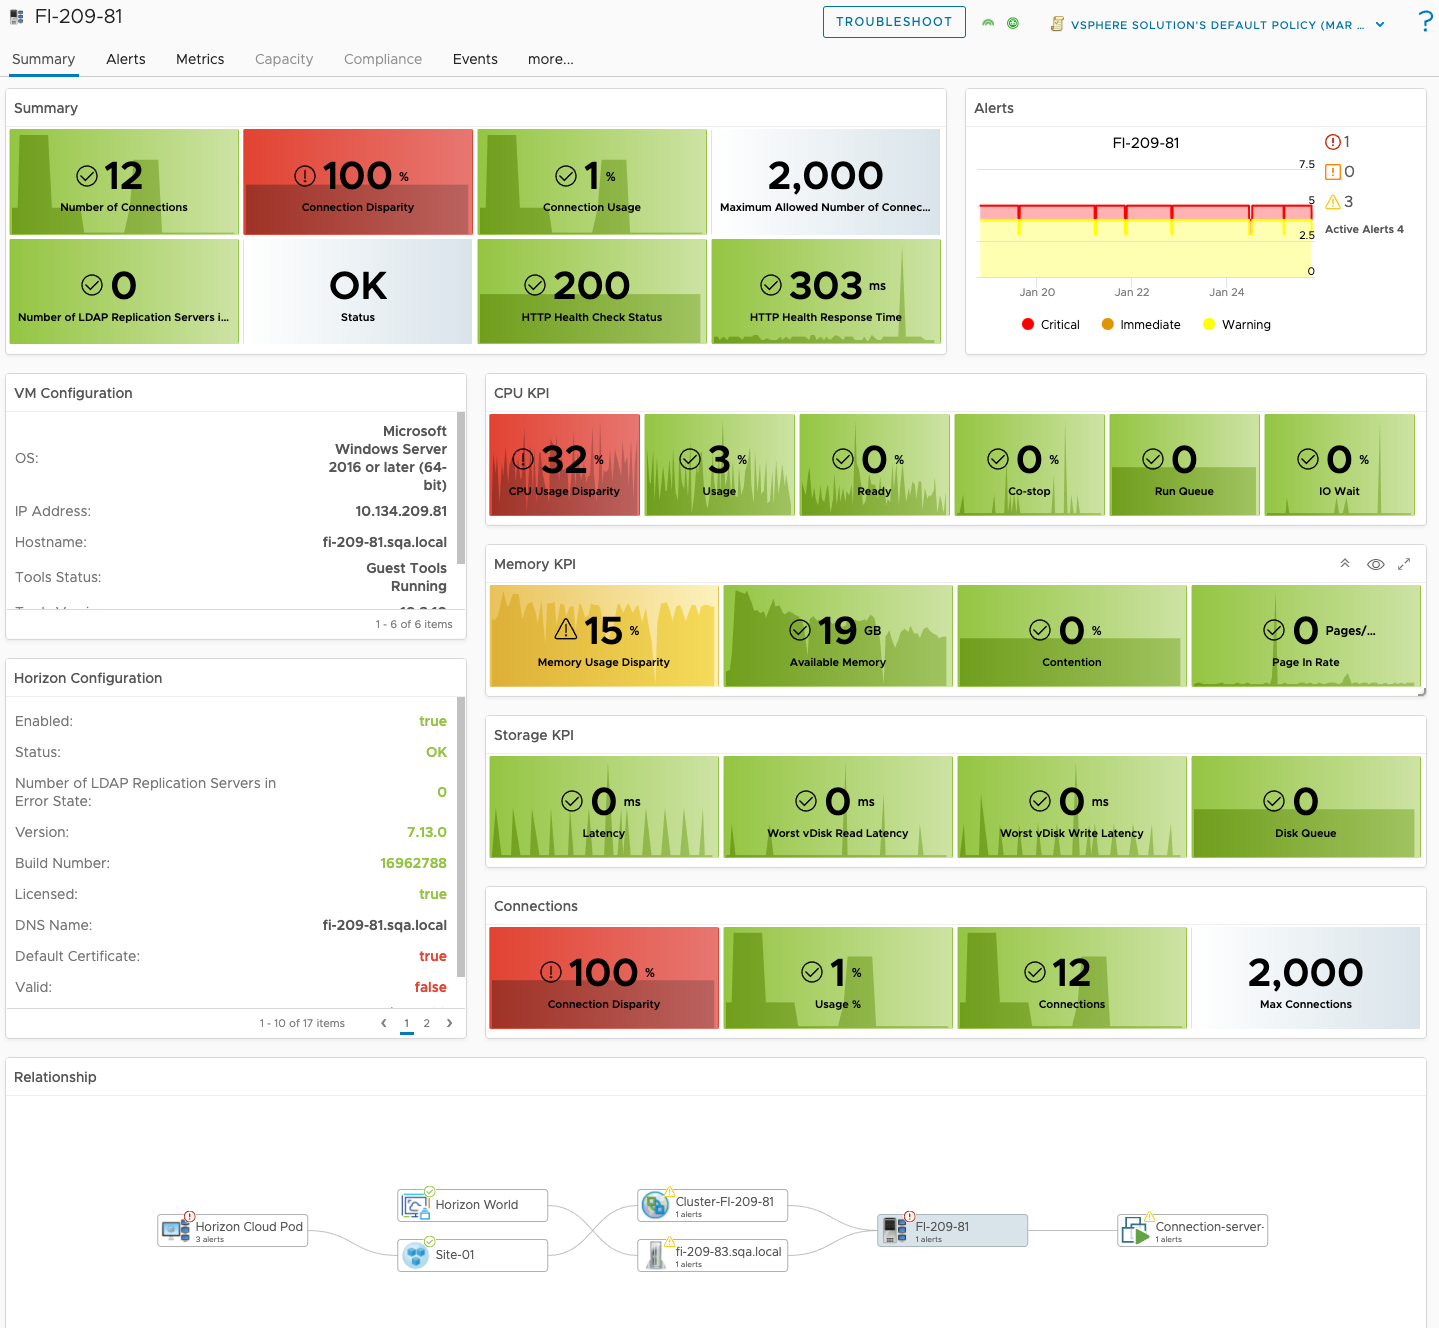
For the Horizon Connection Servers, in a single dashboard, we provide visibility to the overall performance, availability, and risk across to all Connection Servers in every Horizon Pod. In the dashboard image below, we have provided distributions to highlight which Connection Servers are having performance issues, failing their Horizon service “Health Checks”, have a large disparity in the number of Connections being serviced, as well as failing their LDAP replication.
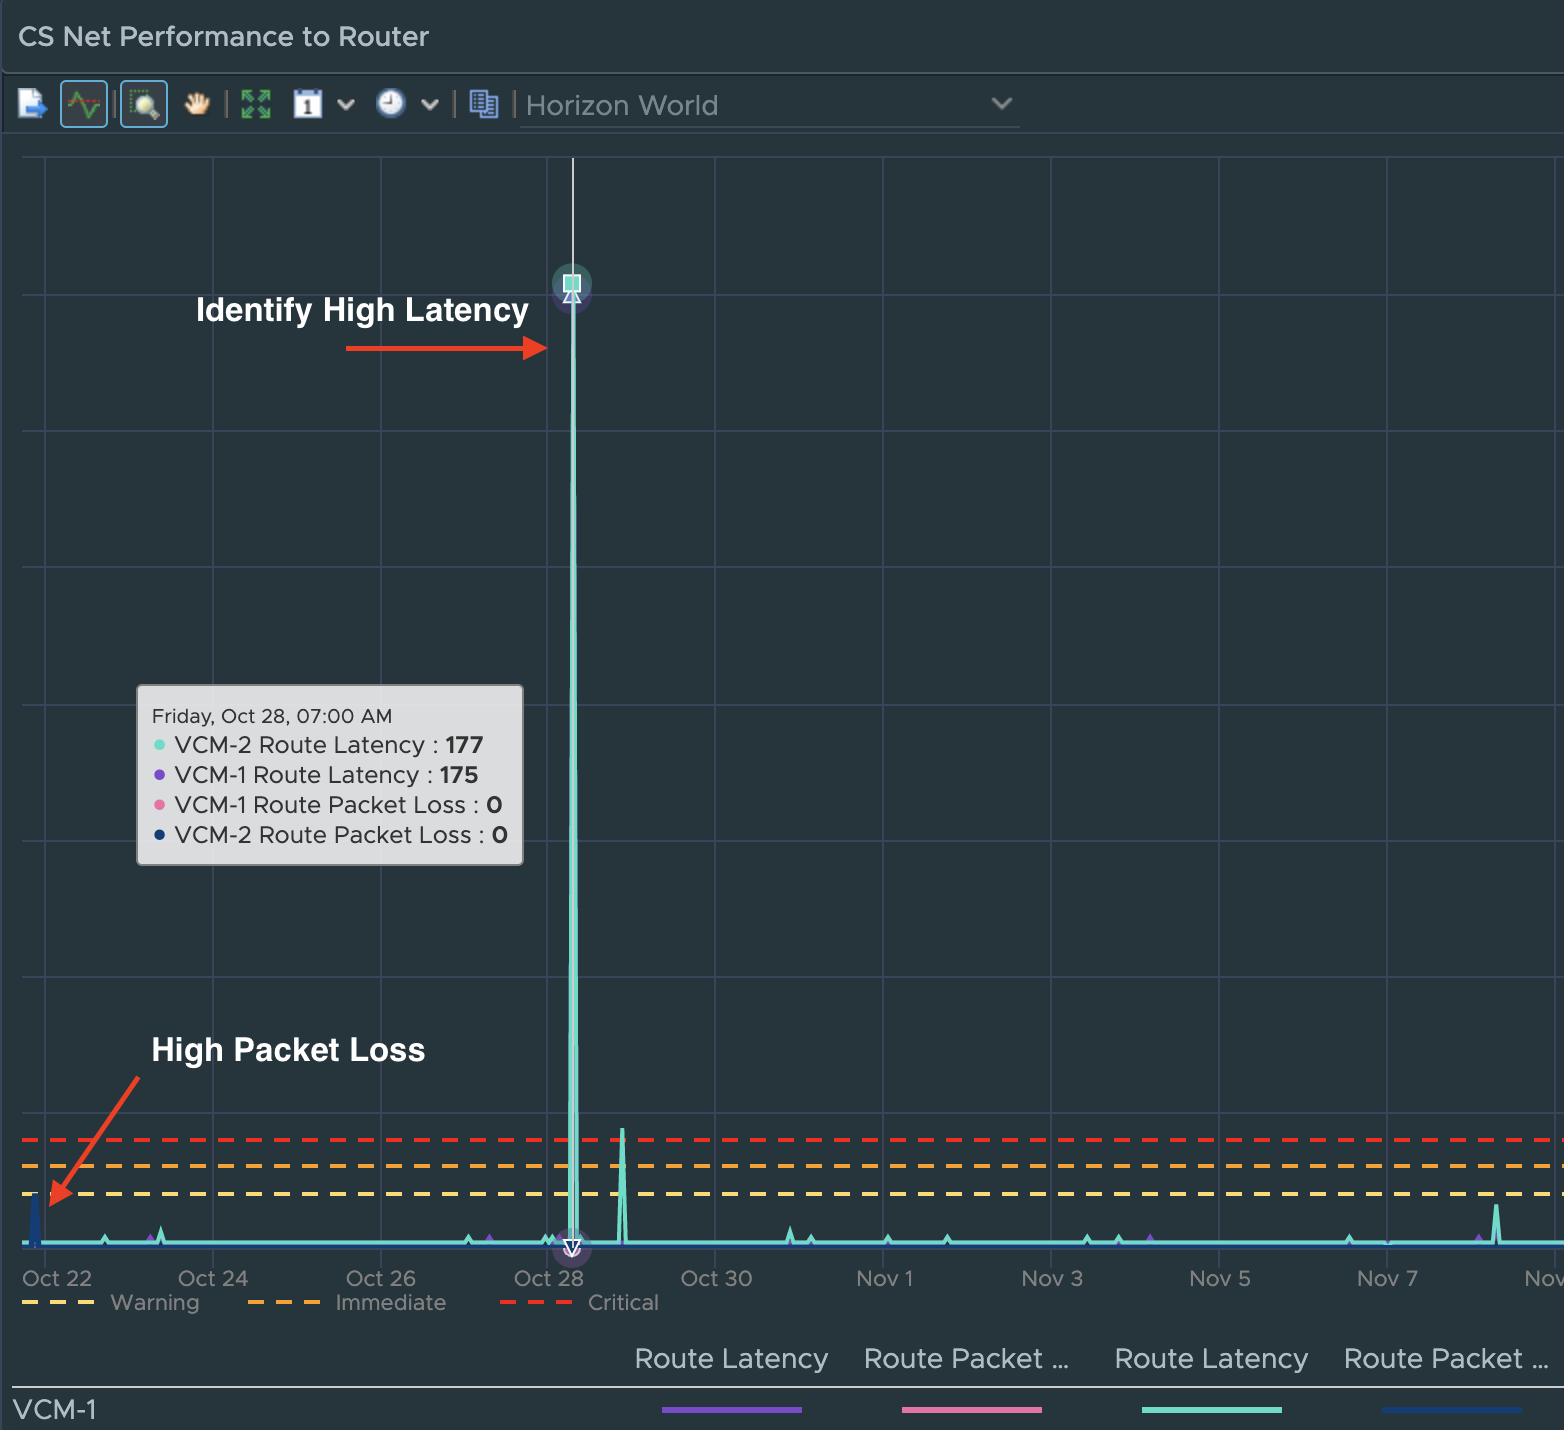
Similar to the UAG, we have added a new list of Connection Servers that can easily be sorted by critical KPI or property. We have also added a “CS Net Performance to Router” widget to quickly evaluate the overall performance and availability of the designated route to the CS’s in the Horizon Pod.
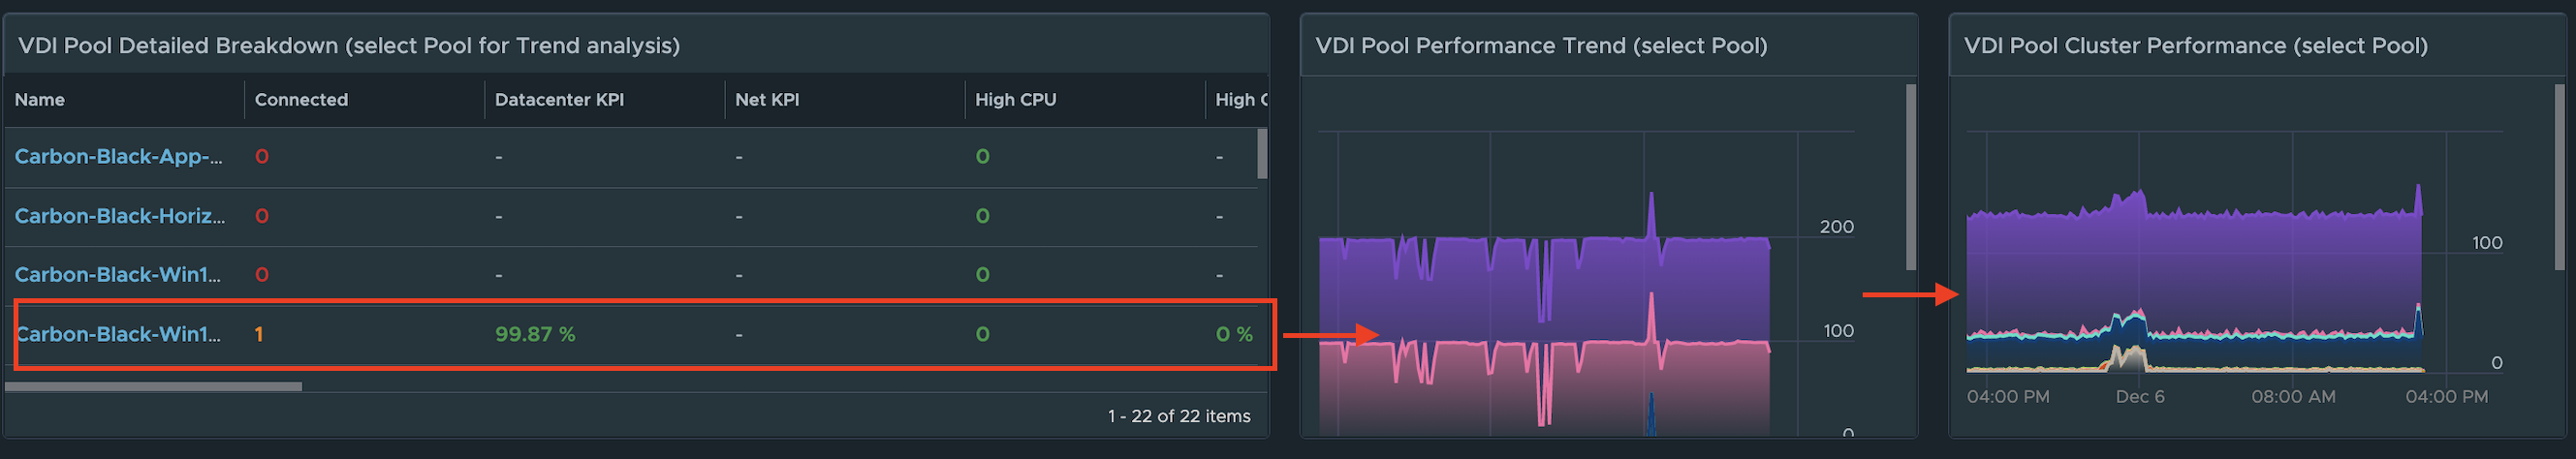
VDI Pool Visibility
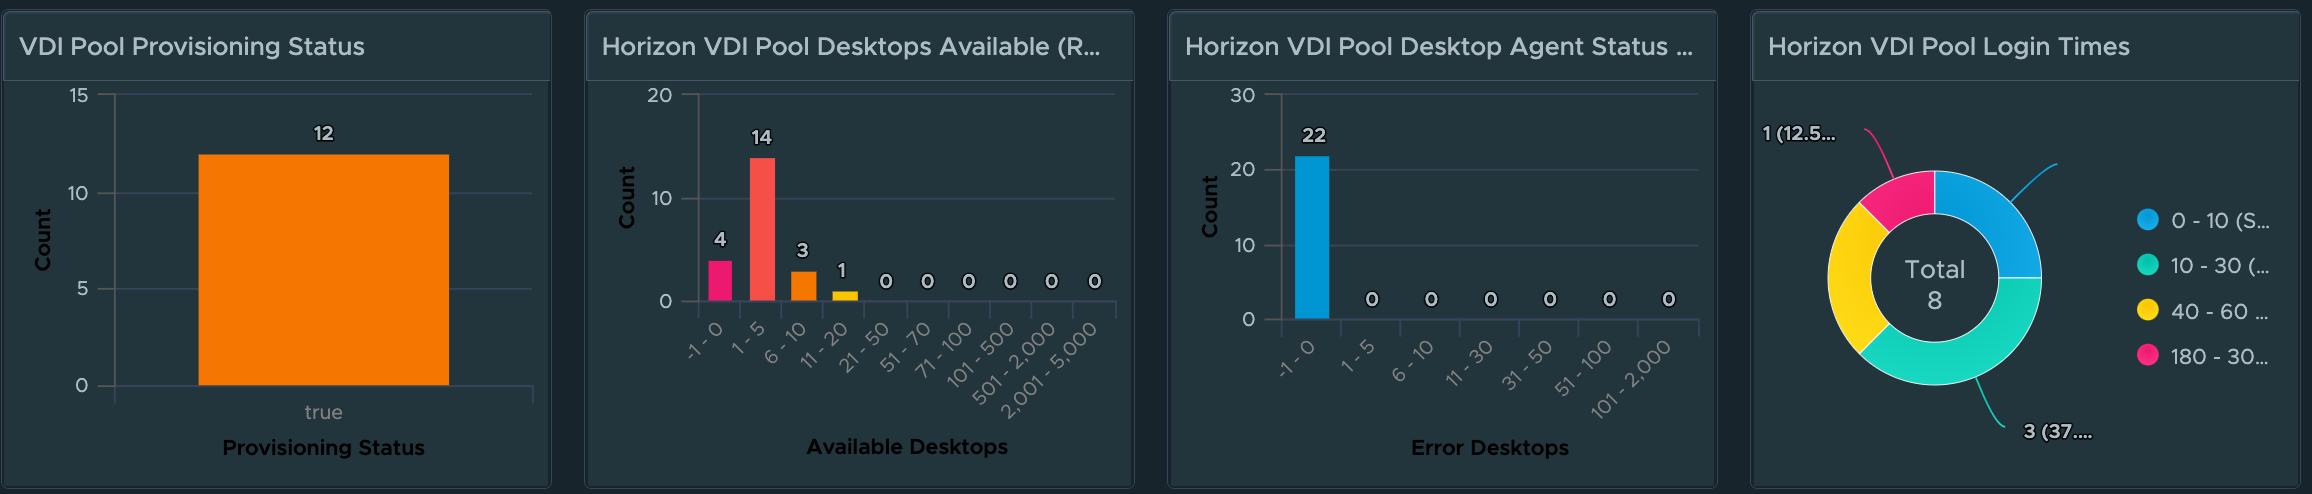
For Horizon VDI Pools, we provide insight into pools which have provisioning errors, low on available capacity, have desktops in an “error” state, and which pools have the worst login times.
A detailed list view has been added so that Pools can be sorted or filtered by their critical KPIs and Properties. We have also made the Pool list view interactive, so that selecting an individual pool provides additional insights into the meaningful performance KPIs impacting the Pool, as well as the meaningful KPIs from the from the supporting vSphere Cluster.
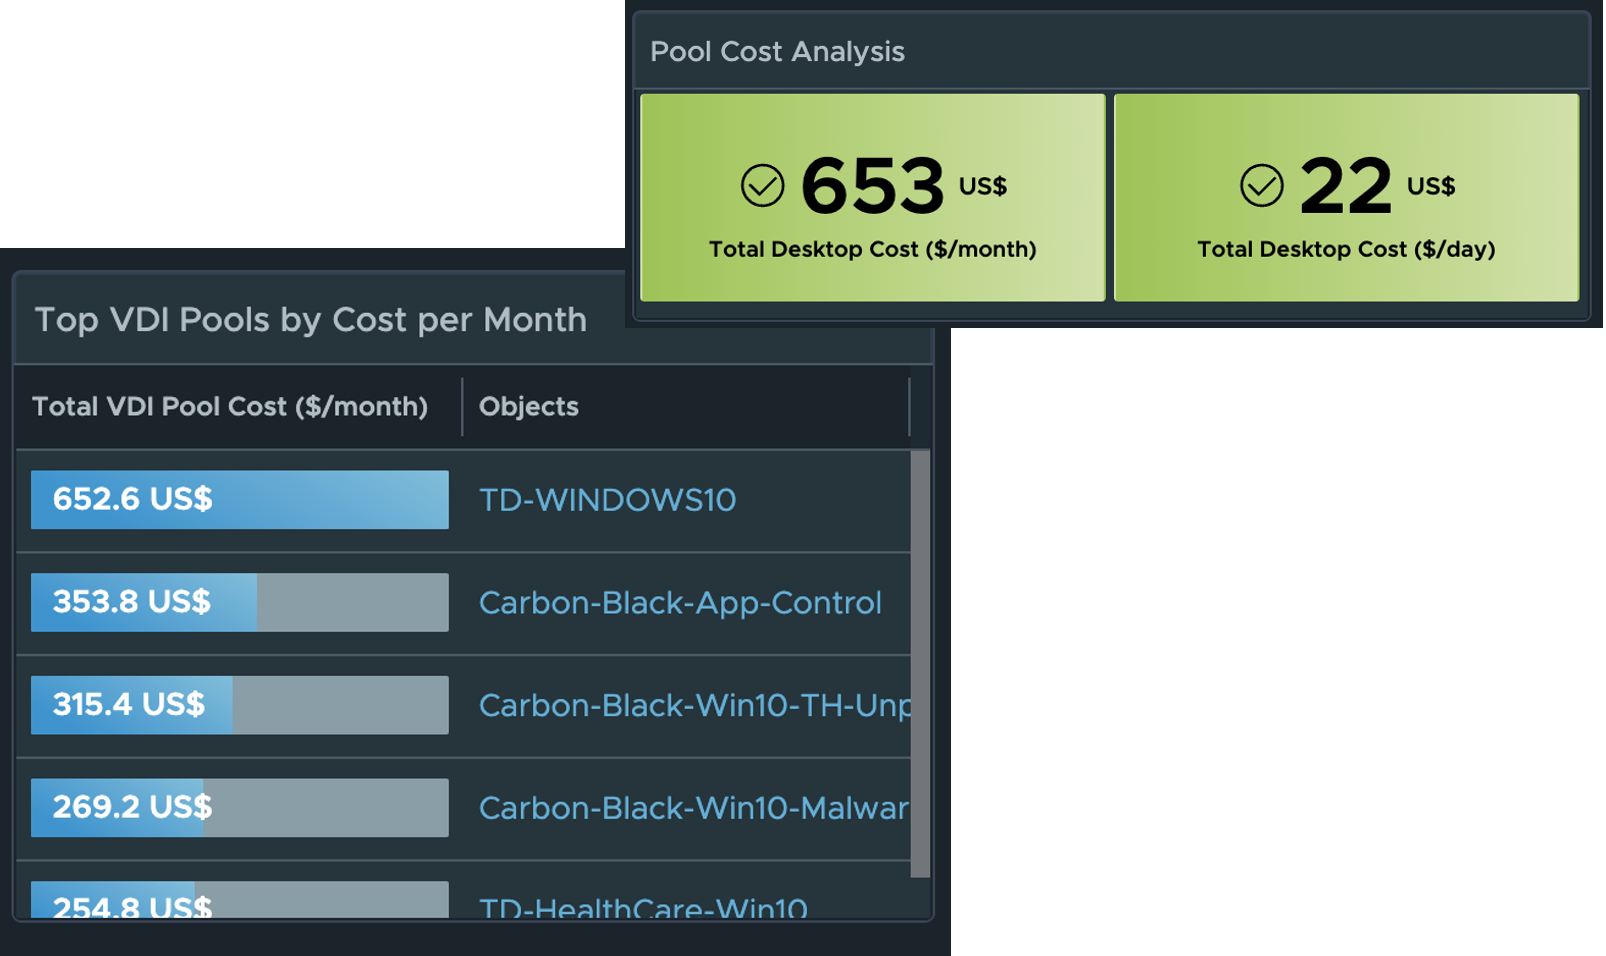
Leveraging the vROPs Costing engine, we are now able to provide the estimated cost per VDI Pool and per desktop based on the compute required for the virtual desktops.
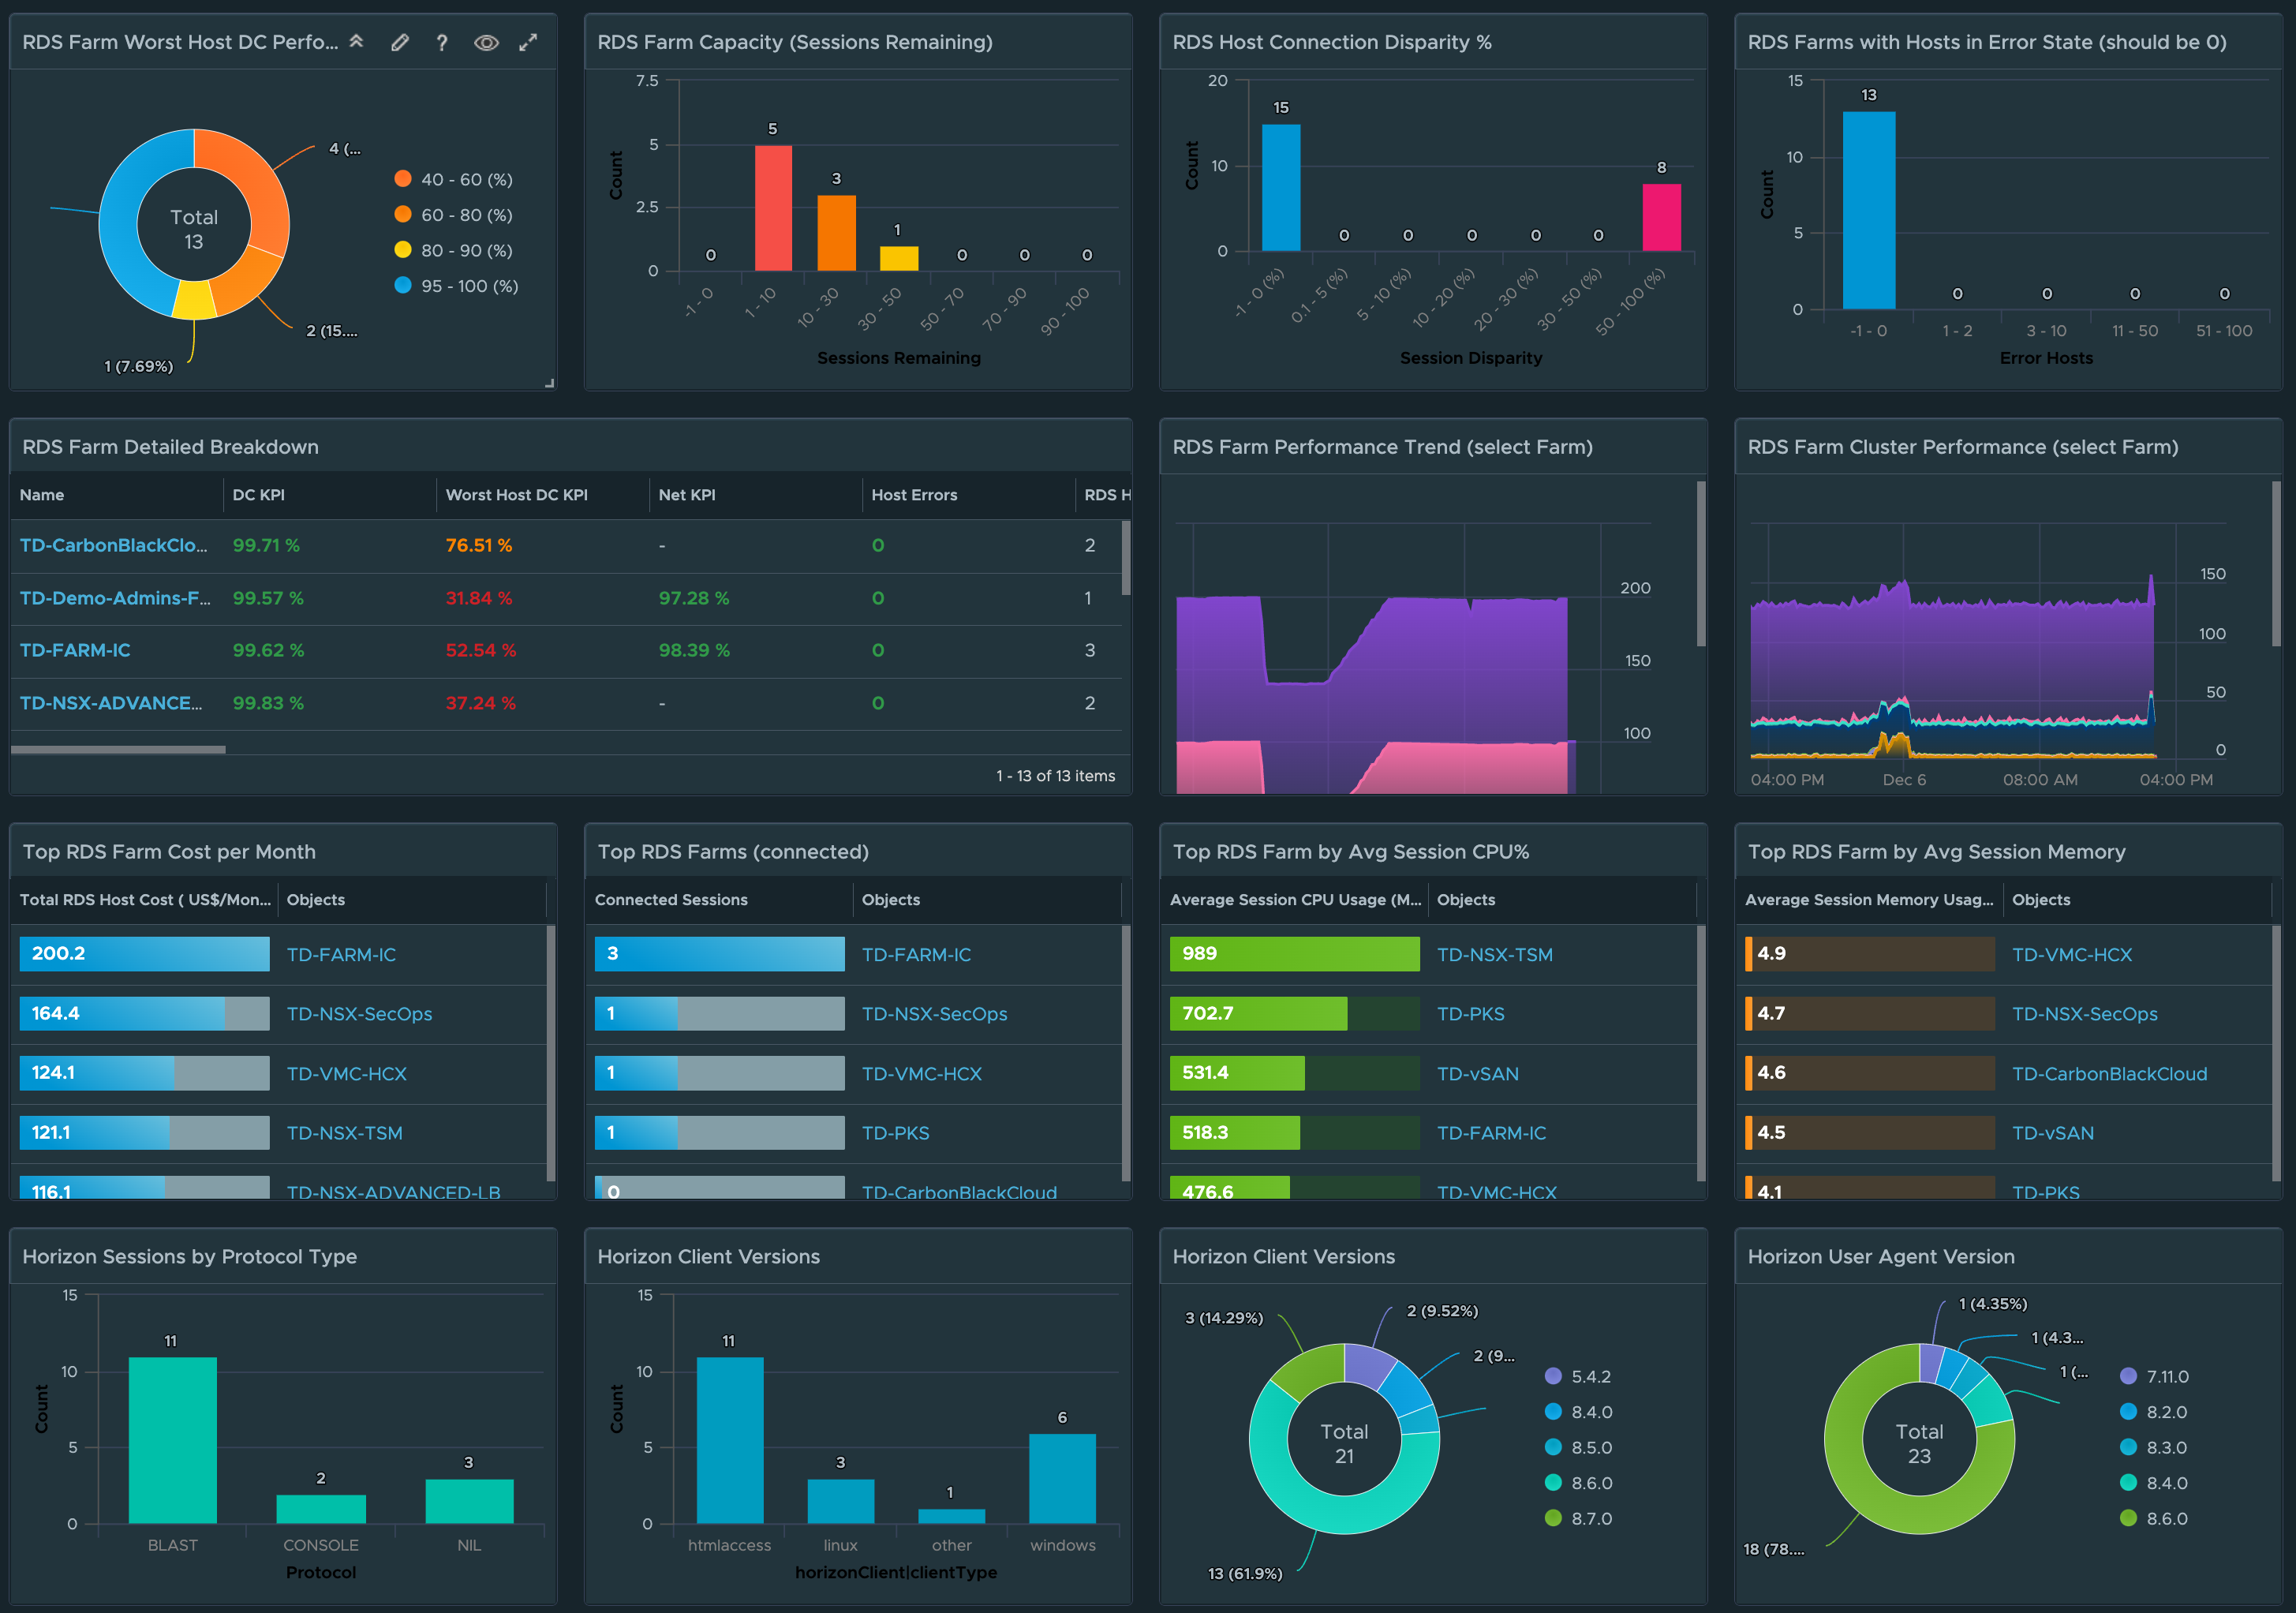
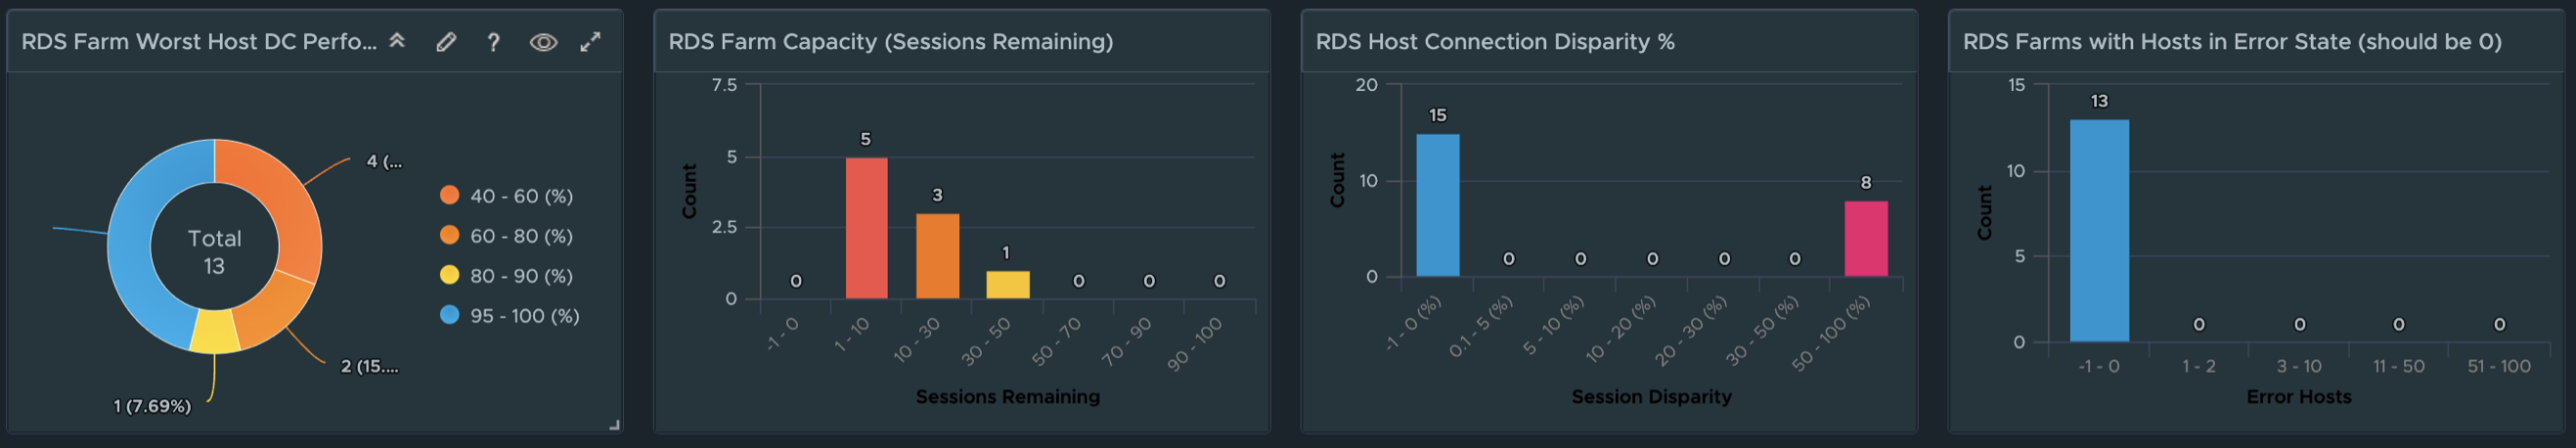
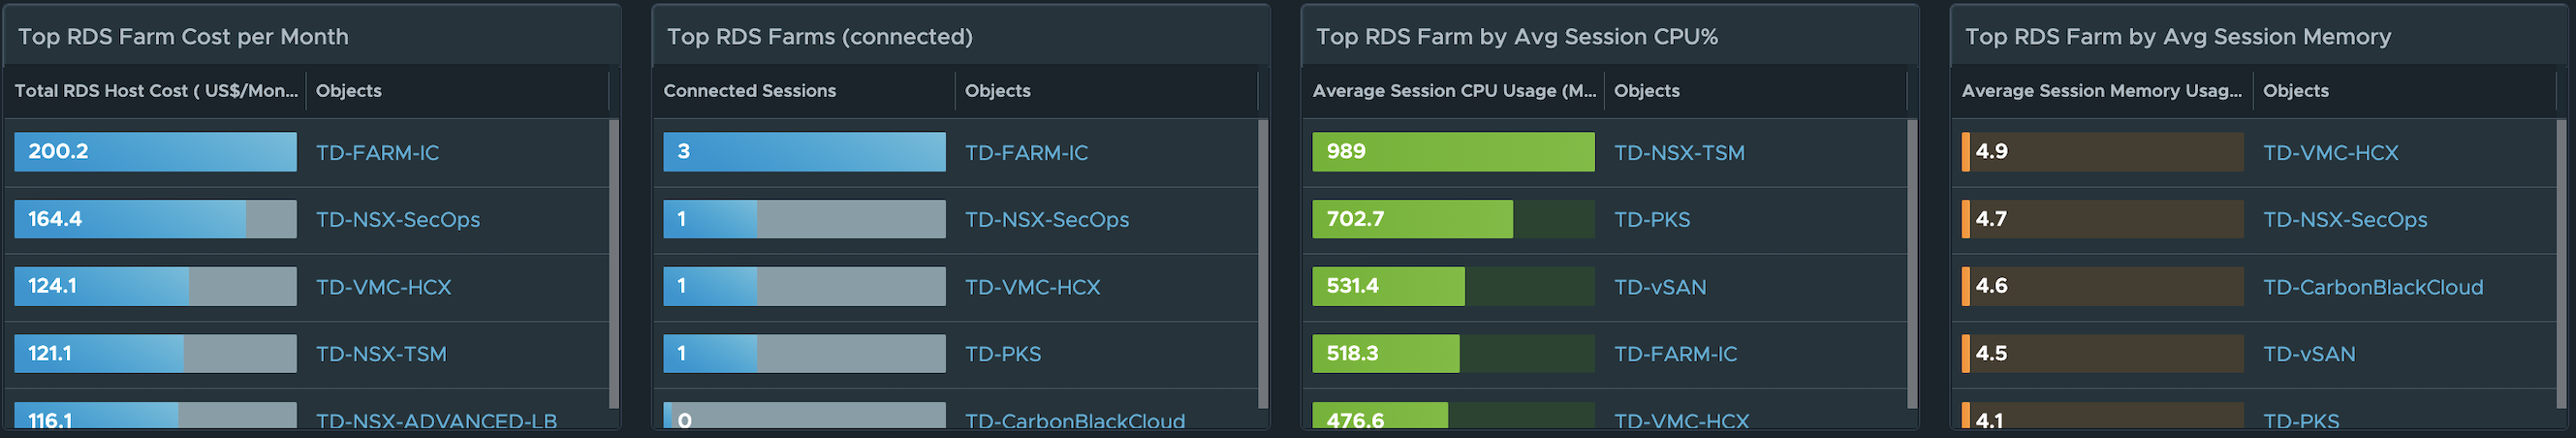
RDS Farm Visibility
For RDS Farms, we provide insight into RDS Farms that have RDS Hosts with performance issues, estimated Farm Session capacity remaining based on actual compute, RDS Hosts that have large disparity of Connected Sessions, and RDS Farms with Hosts in an Error state.
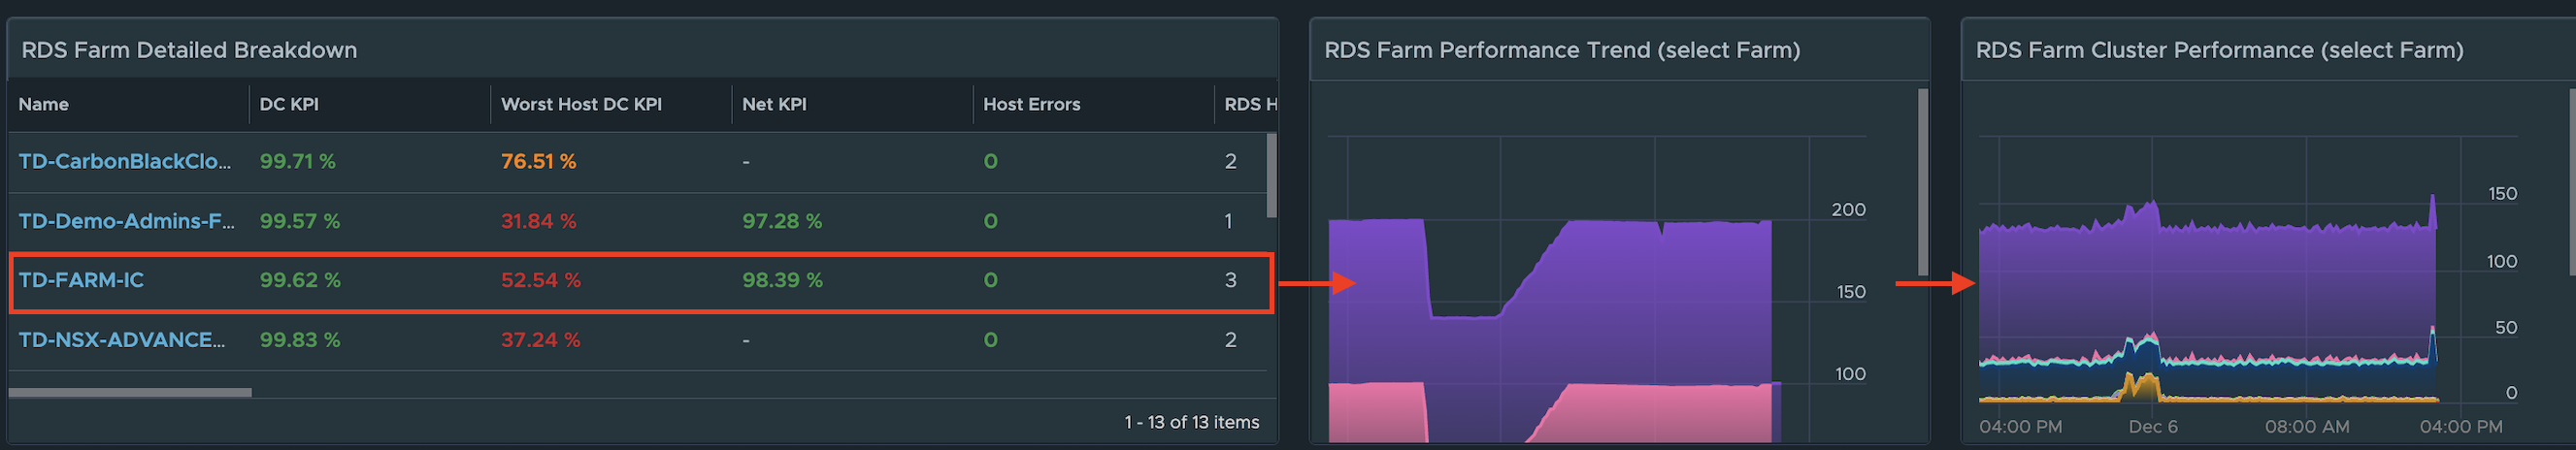
We have also added a RDS Host list view to make it easier to sort by Farm critical KPI or property. Selecting a RDS Farm will provide a stacked trend chart of the KPIs and the supporting vSphere Cluster performance KPIs.
RDS Farm cost analysis metrics are also provided based on the compute required for the RDS hosts, as well as the computed CPU and Memory required per session.
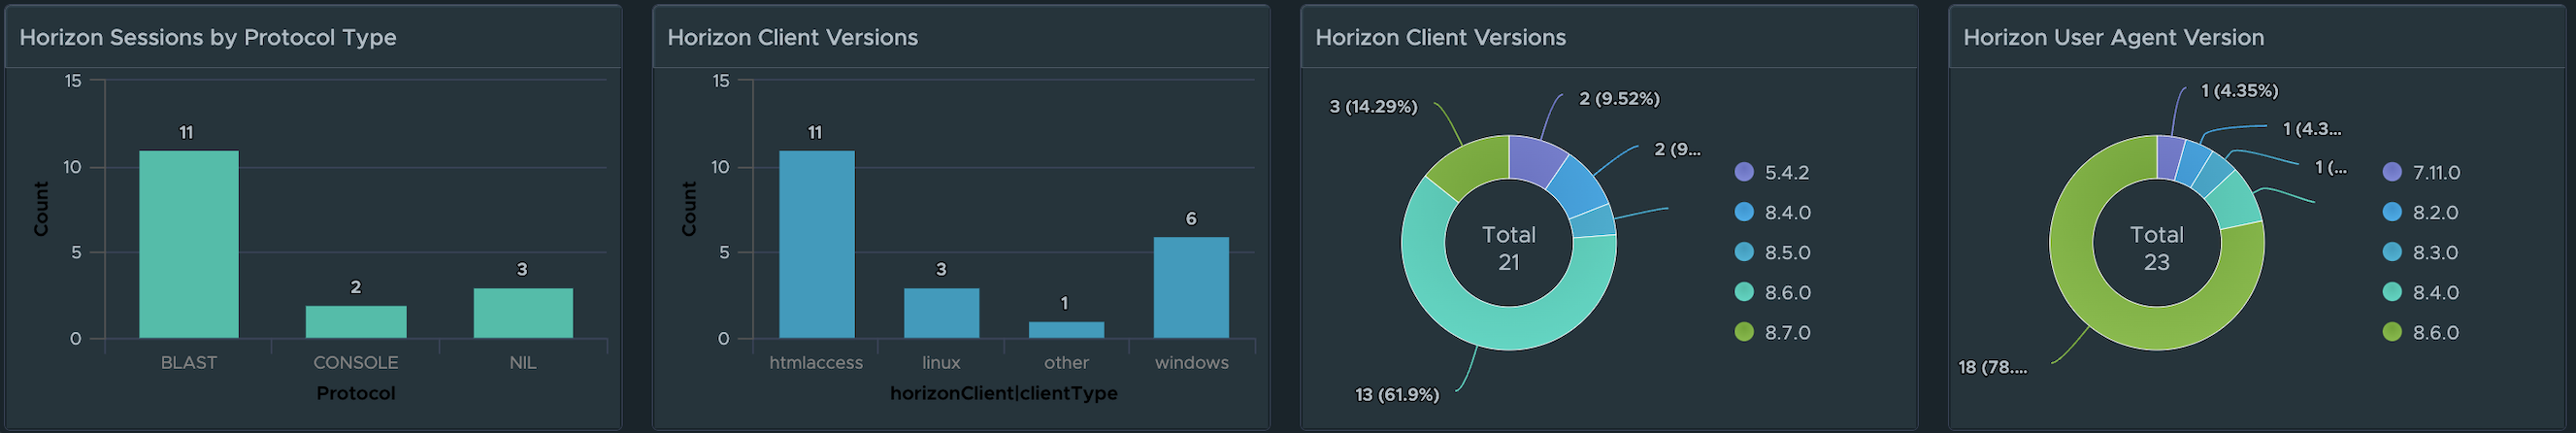
Horizon Client and Agent Compliance
For Horizon Client and Agent Compliance, distribution views are provided to show a break down of the various protocol types, Client Type, Client Version, and Horizon Agent versions currently in use. These views can quickly identify users with old Client Versions or Desktop agents that need to be upgraded in the Horizon environment.
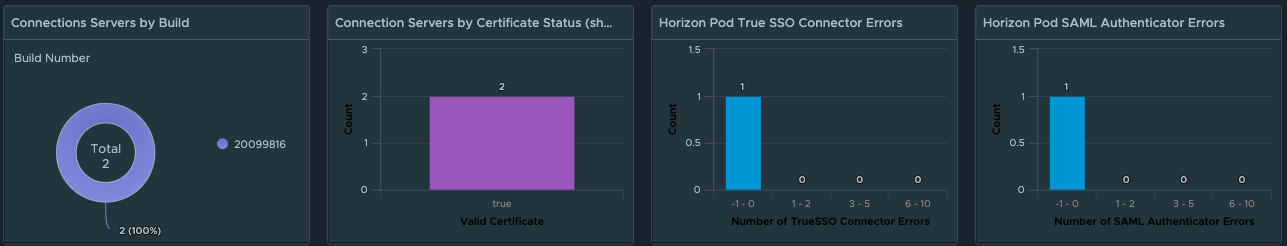
Connection Server Compliance and Authentication Configuration Errors
For Connection Server compliance and authentication configuration errors, the distribution views highlight the Connection Servers by build and Certificates no longer valid. If True SSO and SAML authentication is being used, you can quickly identify Pods with SSO Connector Errors or SAML authentication errors.
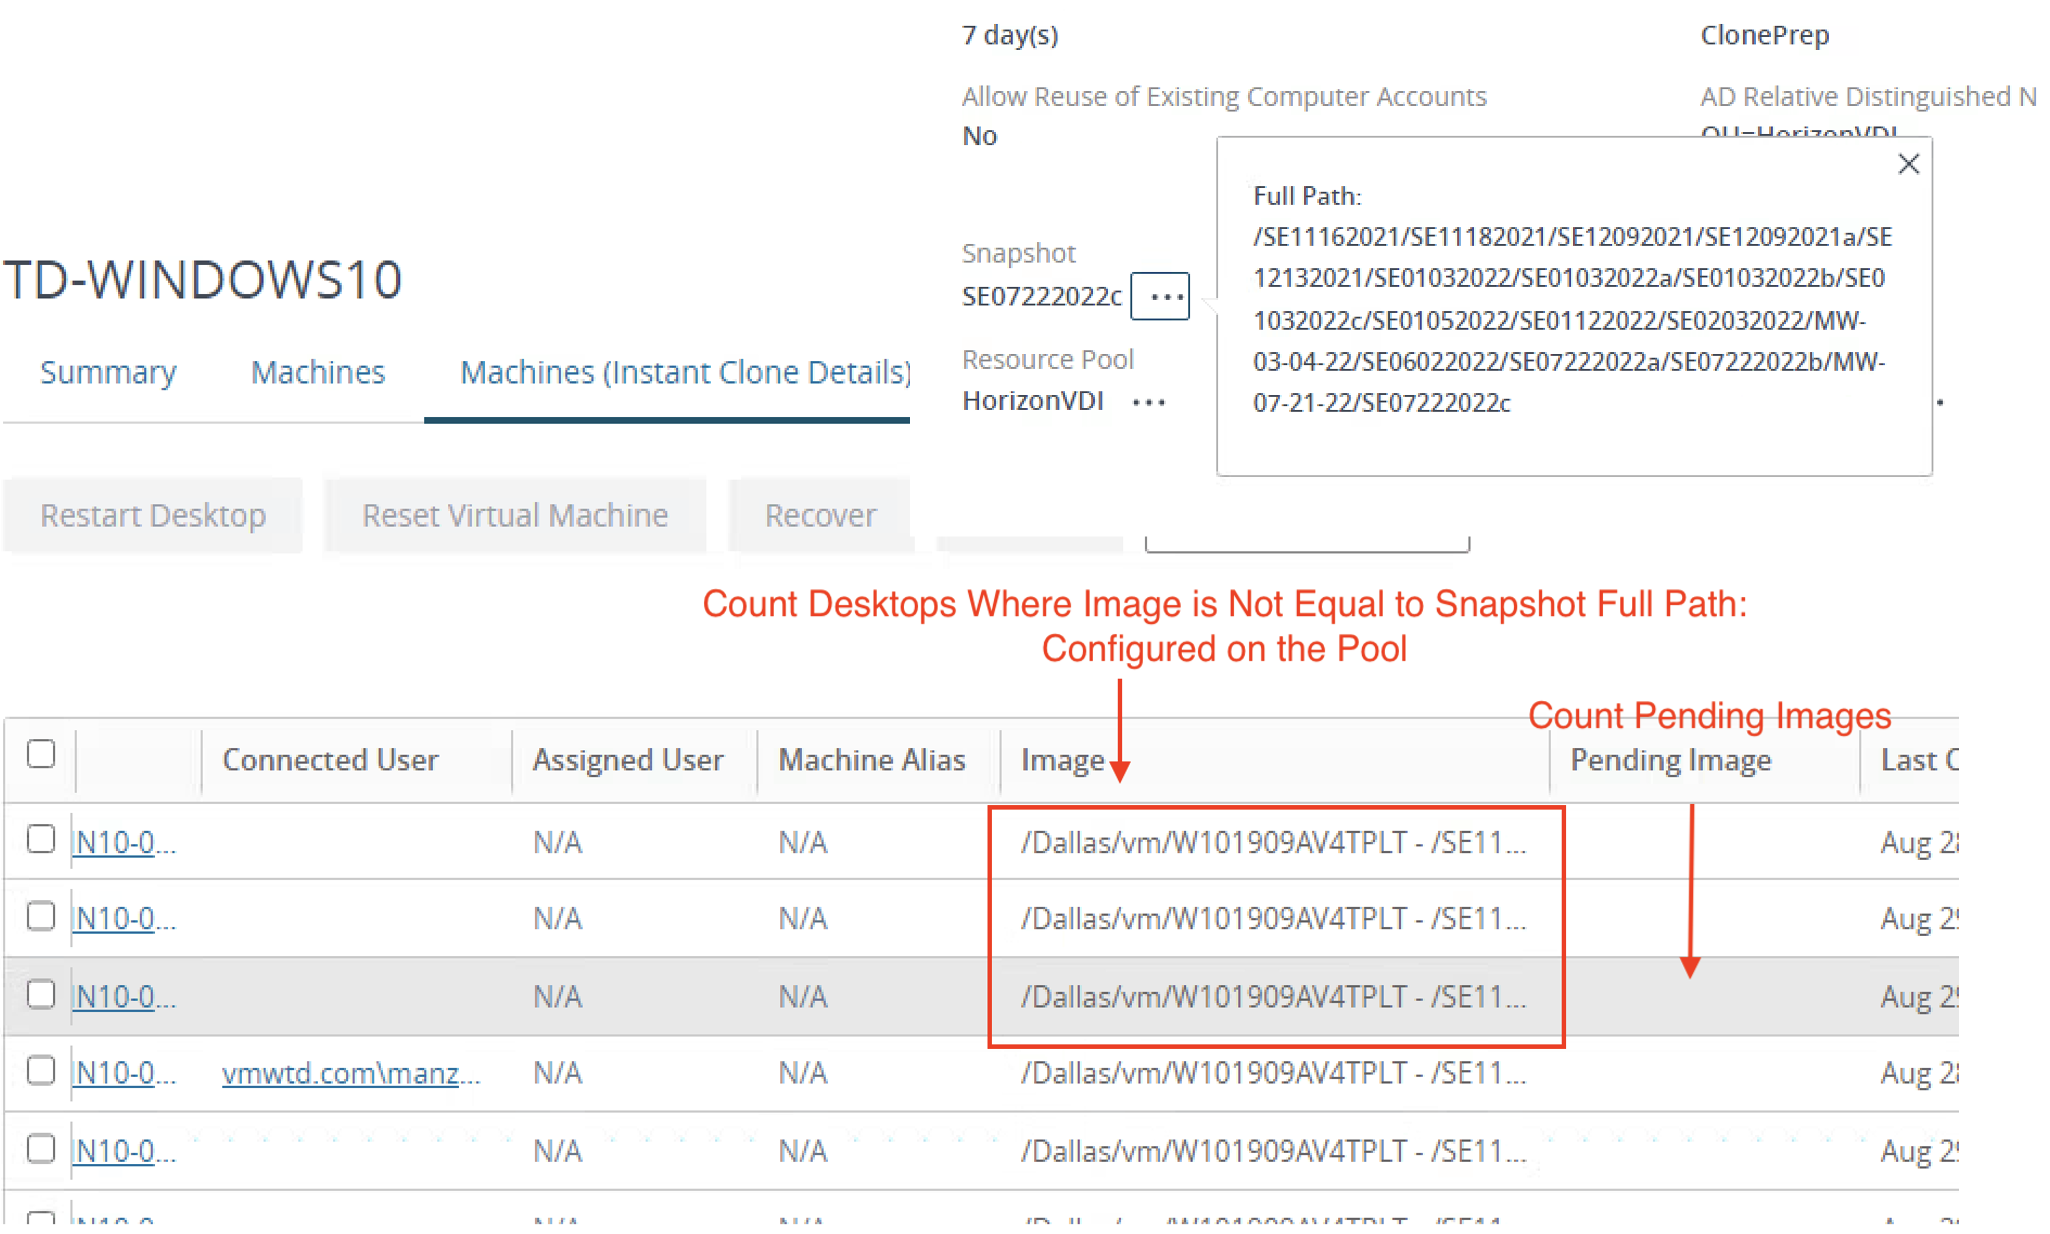
VDI Pool and RDS Farm Image "mismatch"
To provide greater insight into VDI Pools and RDS Farms with image provisioning issues, we have added the ability for the Management Pack to detect VM’s where the underlying disk Image does not properly match the Snapshot configured for the Pool or Farm. When a mismatch is detected, we will count the number of mismatches and provide it as a running count for the new “Desktop Image Mismatch” and “RDS Host Image Mismatch” metric. Customers can then alert on this metric to quickly identify which Pools and which Farms require remediation.
As you can see, there have been a significant number of improvements to the latest Management Pack for Horizon in terms of providing greater insight into performance, availability, risk, and compliance. In the next blog post, I will touch on the new built-in Horizon automations, updated Horizon Object Summary Pages, and scale features that have been added.
As of 1.27.2022, the Management Pack for Horizon 2.0 is now released and available for on-prem or cloud customer deployments! This is an exciting release as it brings a number of groundbreaking features to further enhance our customer’s ability to successfully monitor, maintain, and optimize their Horizon deployments.
This list of enhancements include:
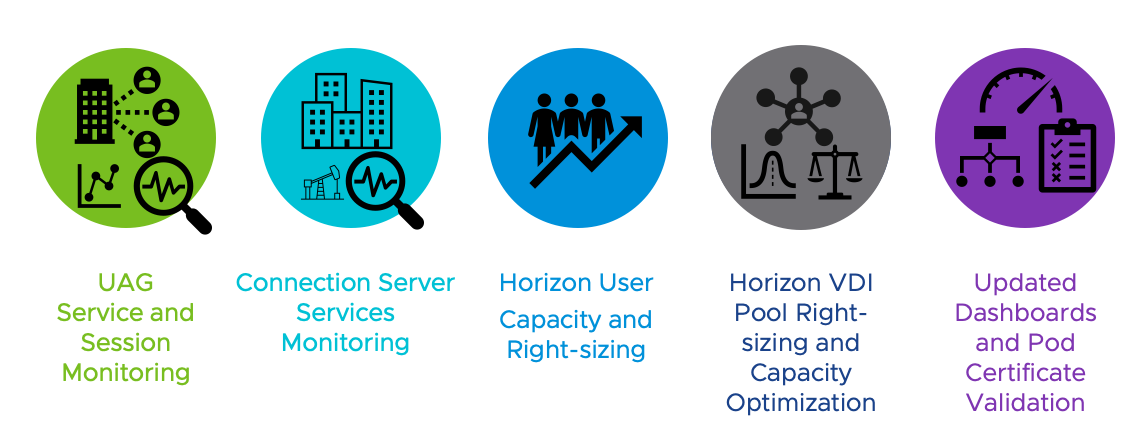
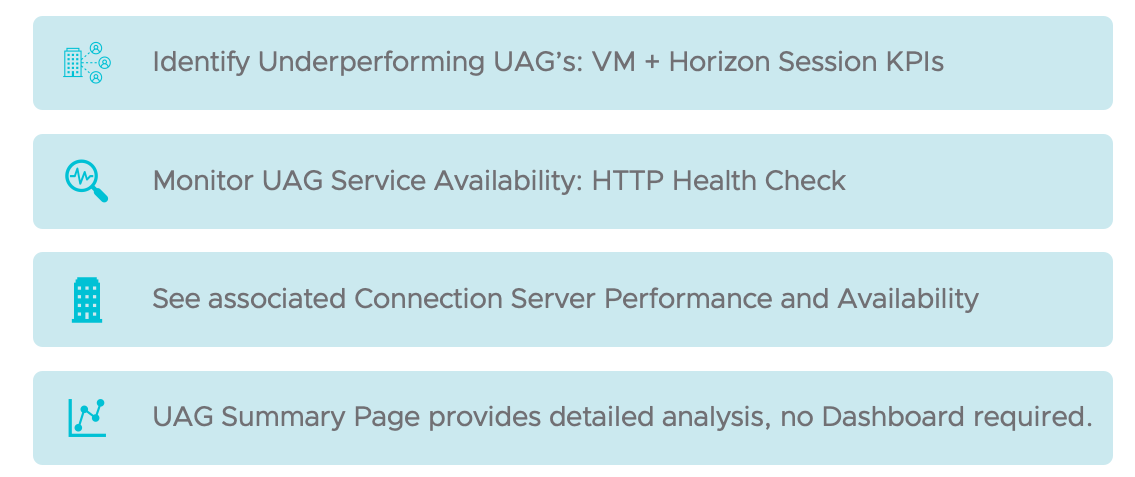
Primary use cases for Unified Access Gateway (UAG) monitoring include:
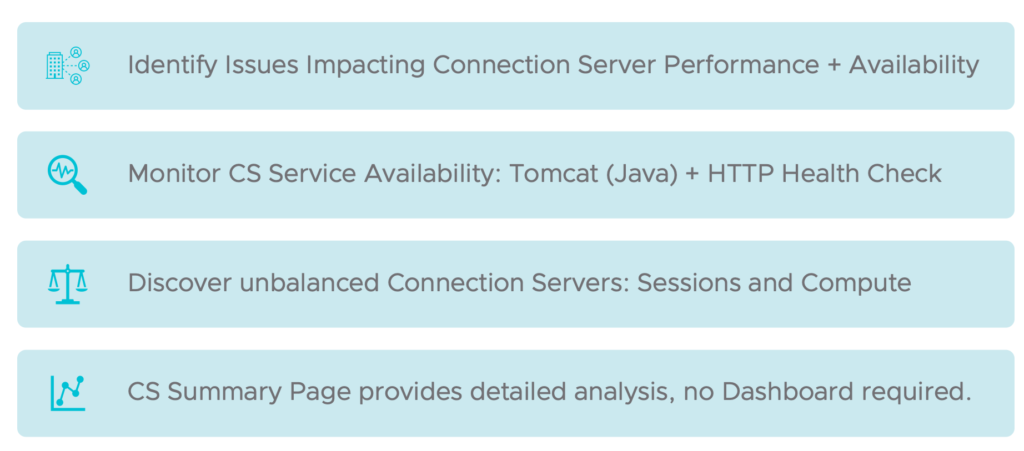
Primary use cases for Horizon Connection Server monitoring include:
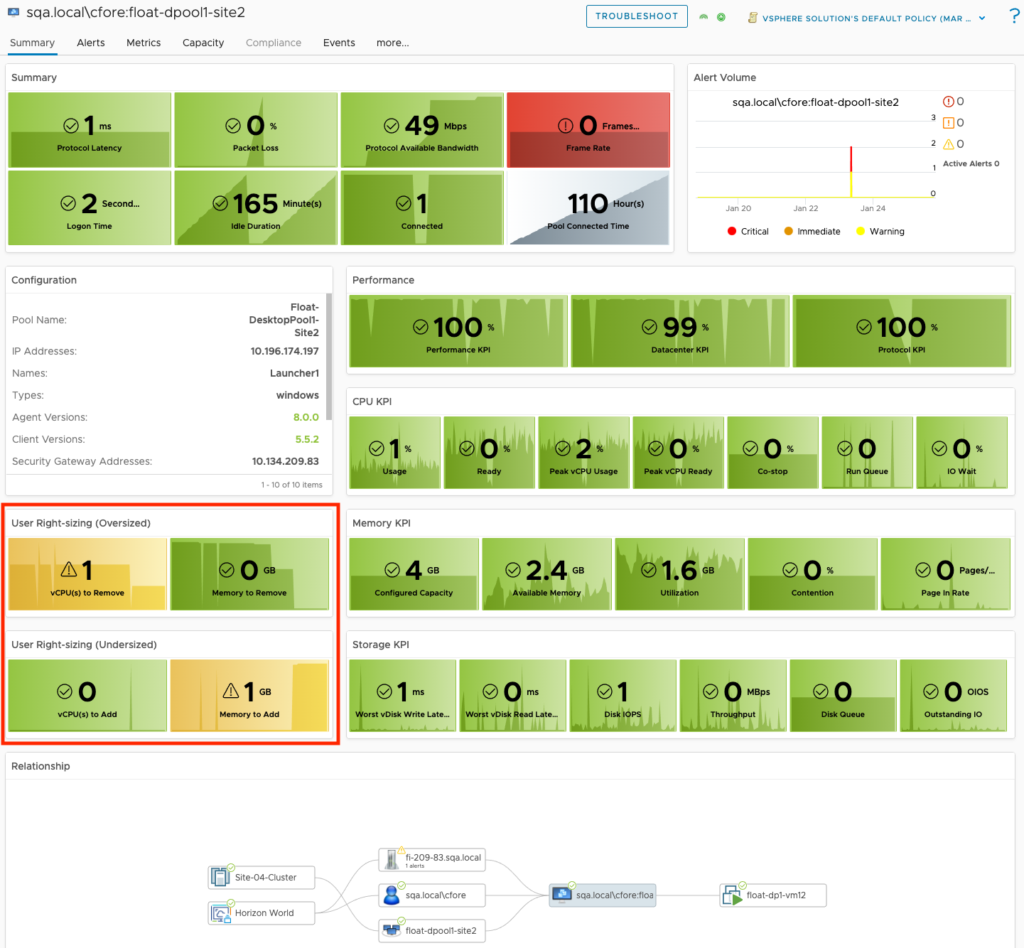
Introducing Horizon User Capacity and Right-sizing metrics:
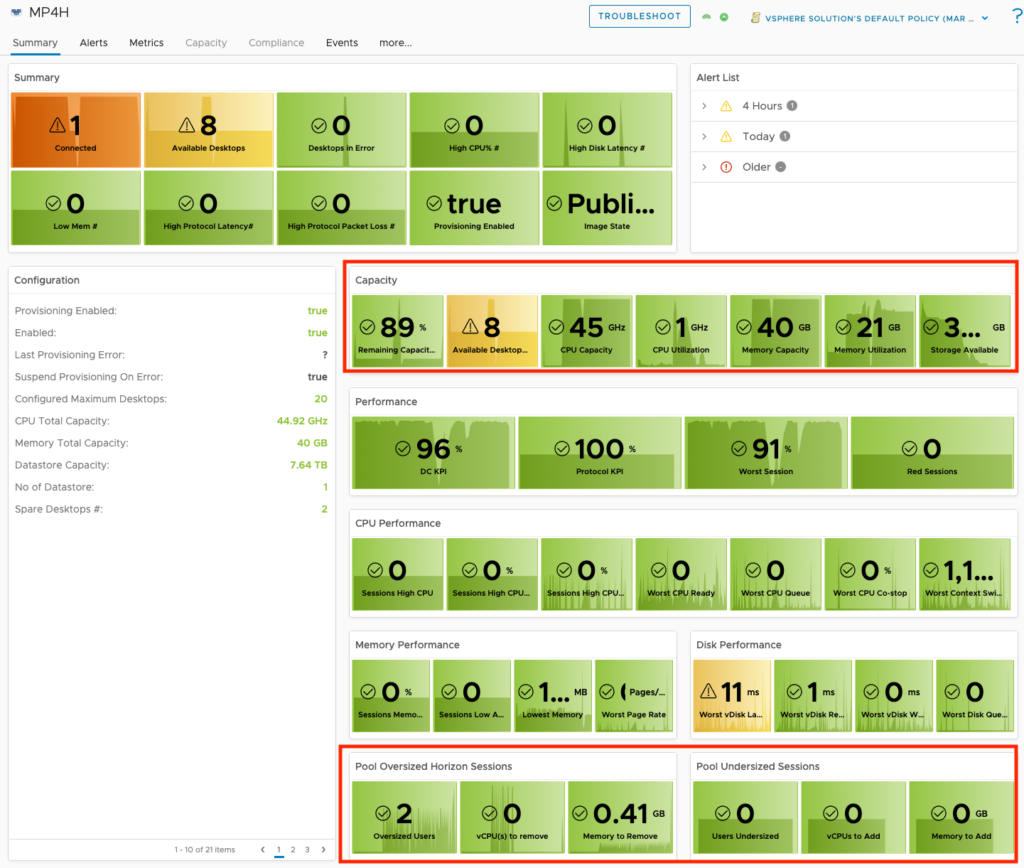
Introducing Horizon VDI Pool Capacity and Configuration optimization metrics: