Why you should use Telegraf with the Management Pack for Horizon

When it comes to managing critical Horizon management servers such as Connection Servers, Unified Access Gateways, AV Managers, etc… It is imperative that you properly monitor their services for availability and that none of them are in a failed state, as well as make sure there are no connectivity issues on internal networks that the Horizon Client traffic traverses. By leveraging the Telegraf agent HTTP Health Check and PING Check functionality with Aria Operations, we can provide additional insight into the Health, performance, and availability of these services.

This video is meant to provide high-level overview of:

  • Why you should leverage Telegraf with the Management Pack for Horizon
  • How to install and configure the Telegraf agents.
  • How to validate your settings after deployment.
  • Review of the dashboards that leverage Telegraf metrics.

MP4H 2.0 What’s New and Use Cases

As of 1.27.2022, the Management Pack for Horizon 2.0 is now released and available for on-prem or cloud customer deployments! This is an exciting release as it brings a number of groundbreaking features to further enhance our customer’s ability to successfully monitor, maintain, and optimize their Horizon deployments.

This list of enhancements include:

Primary use cases for Unified Access Gateway (UAG) monitoring include:

Primary use cases for Horizon Connection Server monitoring include:

Introducing Horizon User Capacity and Right-sizing metrics:

Introducing Horizon VDI Pool Capacity and Configuration optimization metrics:

Horizon User Experience/Performance KPI:

Ready to get started?

https://marketplace.cloud.vmware.com/services/details/vrealize-operations-management-pack-for-horizon-1-1-11111-11?slug=true

vROPs 8.0 Horizon Adapter 6.7.1 Updated Dashboards

Horizon Overview

Horizon Desktop End-to-End Performance Analysis

Cluster Contention Analysis

Horizon Site Connectivity Analysis

Horizon User History Report

Ready to Download?

** Dashboards can be demoed in the VMware TestDrive environment: https://portal.vmtestdrive.com/

Content Release Notes:
This content release includes a number of Dashboards, Views, and Super Metrics designed to take advantage of the User Interface enhancements in the vROPs 8.x platform, providing richer and more visually impacting insight into the overall health, performance, and consumption of your Horizon View deployment.

Compatibility: All content was created on the latest vROP 8.0 platform, so it has only been tested to work with this specific version. The Super Metrics are most likely to work with older versions such as 7.5, but the Views specifically have configurations options that were not available prior to vROPs 8.0.

With vROPs 8.0, only Horizon Adapter 6.7.x is fully supported, so make sure that your Horizon View environment is compatible with the vROPs for Horizon 6.7.x adapter.

Compatibility Matrix: https://www.vmware.com/resources/compatibility/sim/interop_matrix.php#interop&

Conditions: All content provided is on an as-is basis, and should be validated and tested before use in production environments.

*It is recommended that you import and configure the provided Views and Super Metrics before importing the dashboards. Examples of how to do so are provided in previous posts.

How to add Historic User Session Latency to vROPs for Horizon.

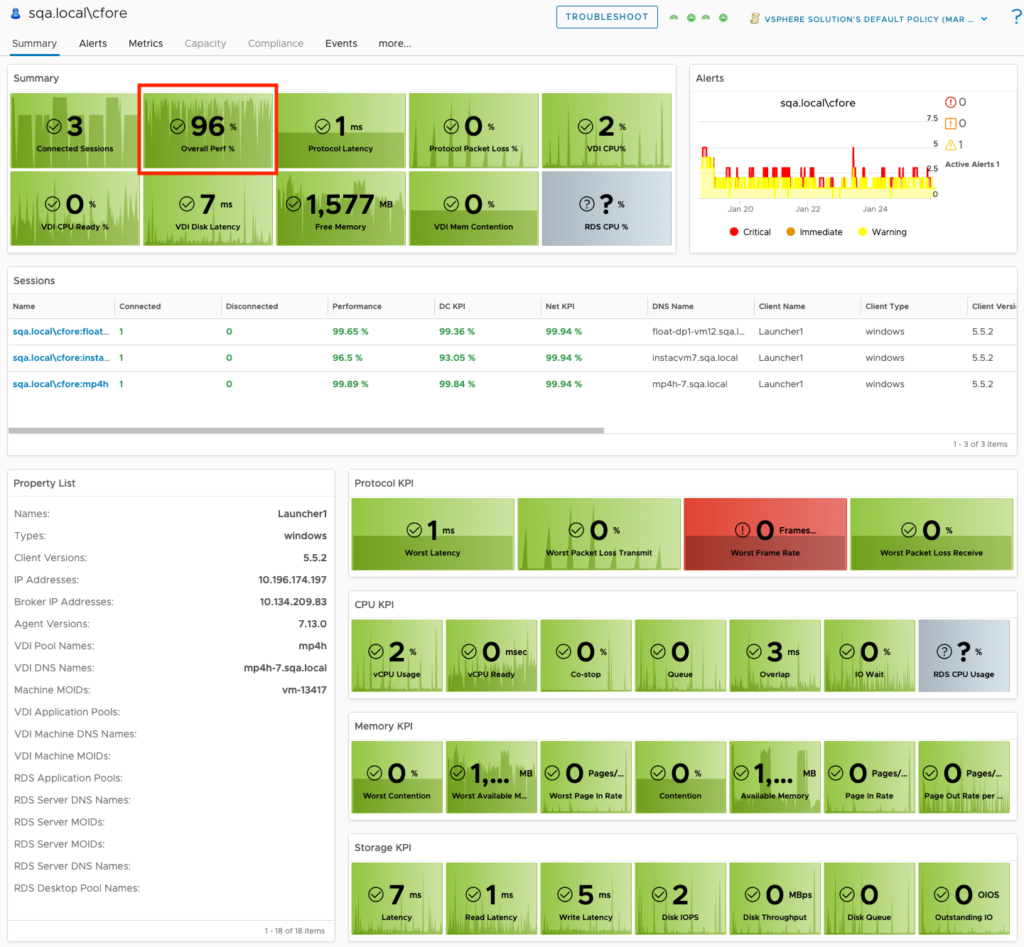
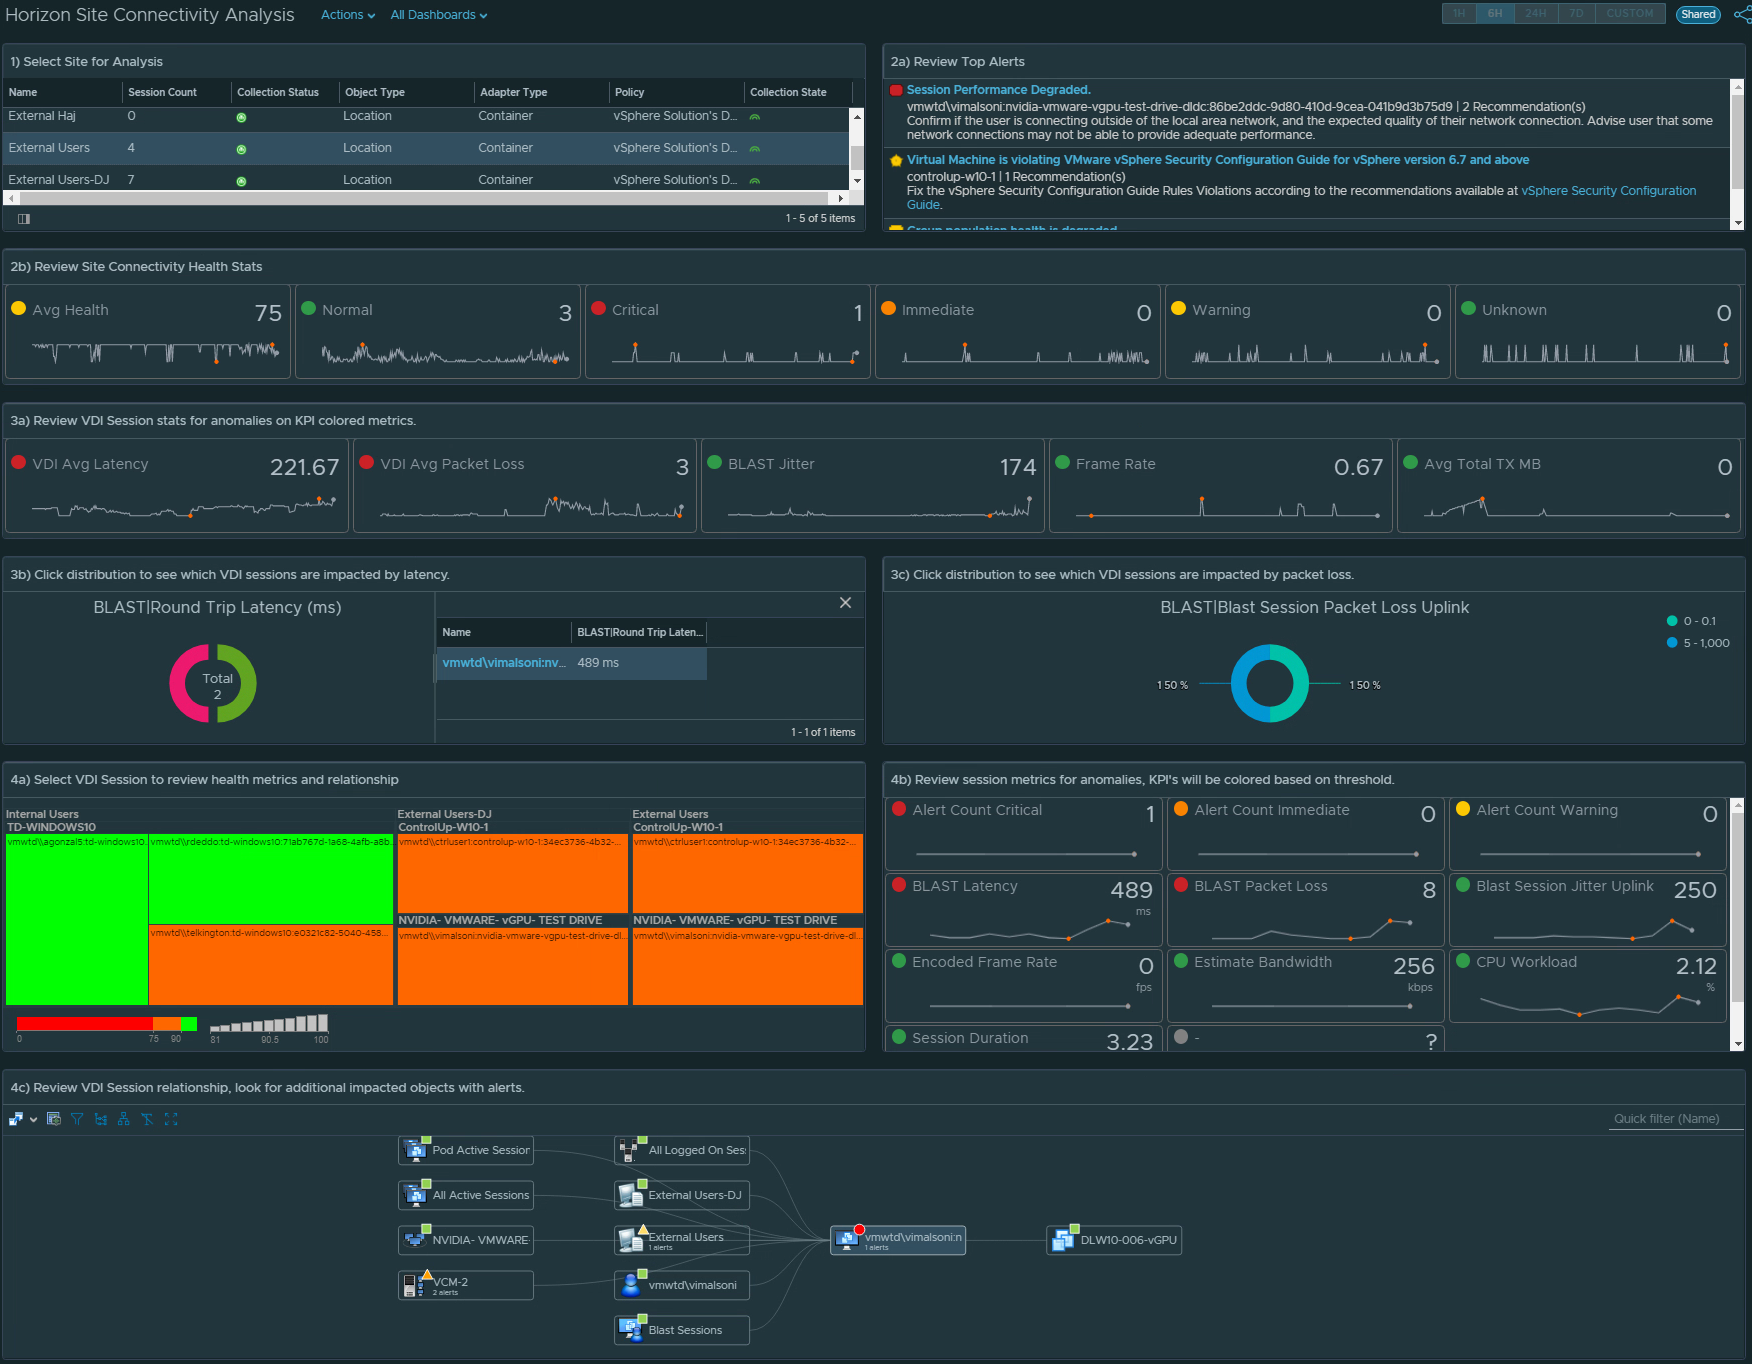
VROPs for Horizon provides end-to-end visibility into key User session statistics that make it easy for Horizon admins to visualize and alert on performance problems impacting the user’s of their environment. One of the key metrics used in determining how well user’s are connected to their virtual app or desktop session is Session Latency (ms), as it most visually impacts the user’s perspective of their session performance.  The lower the session latency, the quicker video, keyboard, and mouse inputs are redirected to and from a user’s endpoint client, giving the user a more native-like PC experience.

As the latency trends higher (>180ms), the experience begins to degrade, and the user can begin to notice “sluggishness“ – slow keyboard, mouse, and video responsiveness.

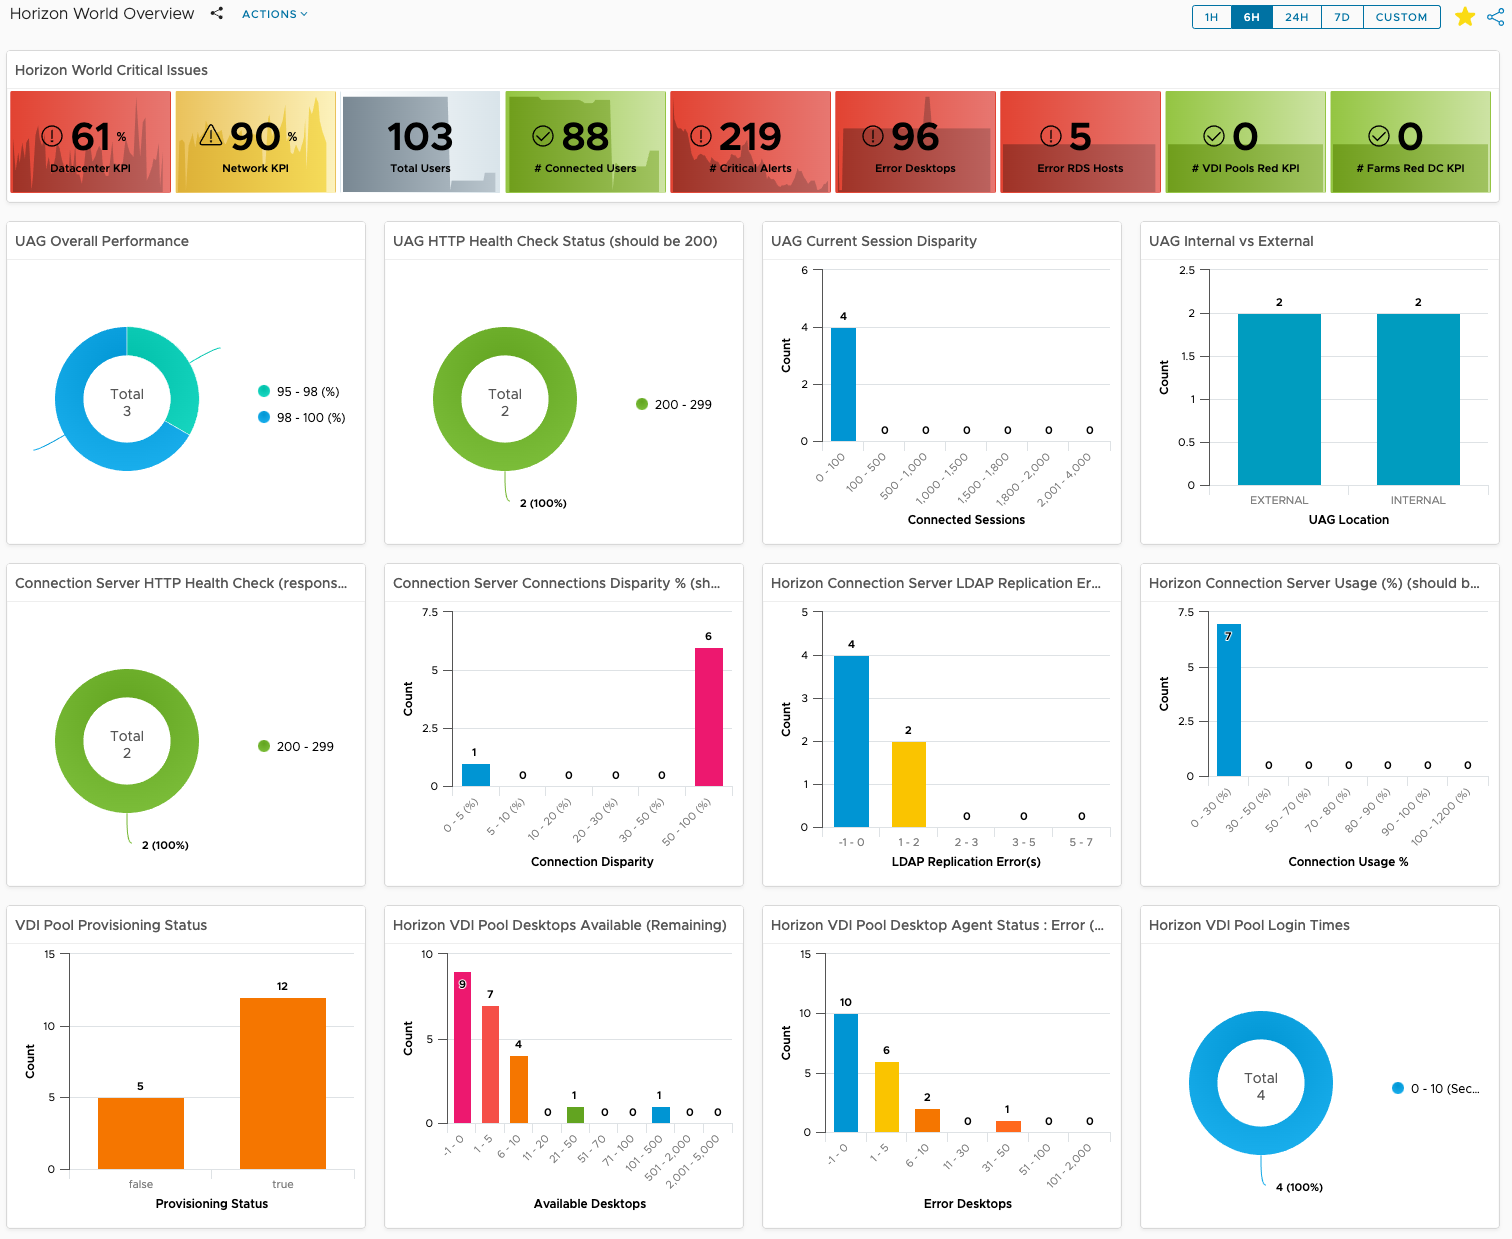
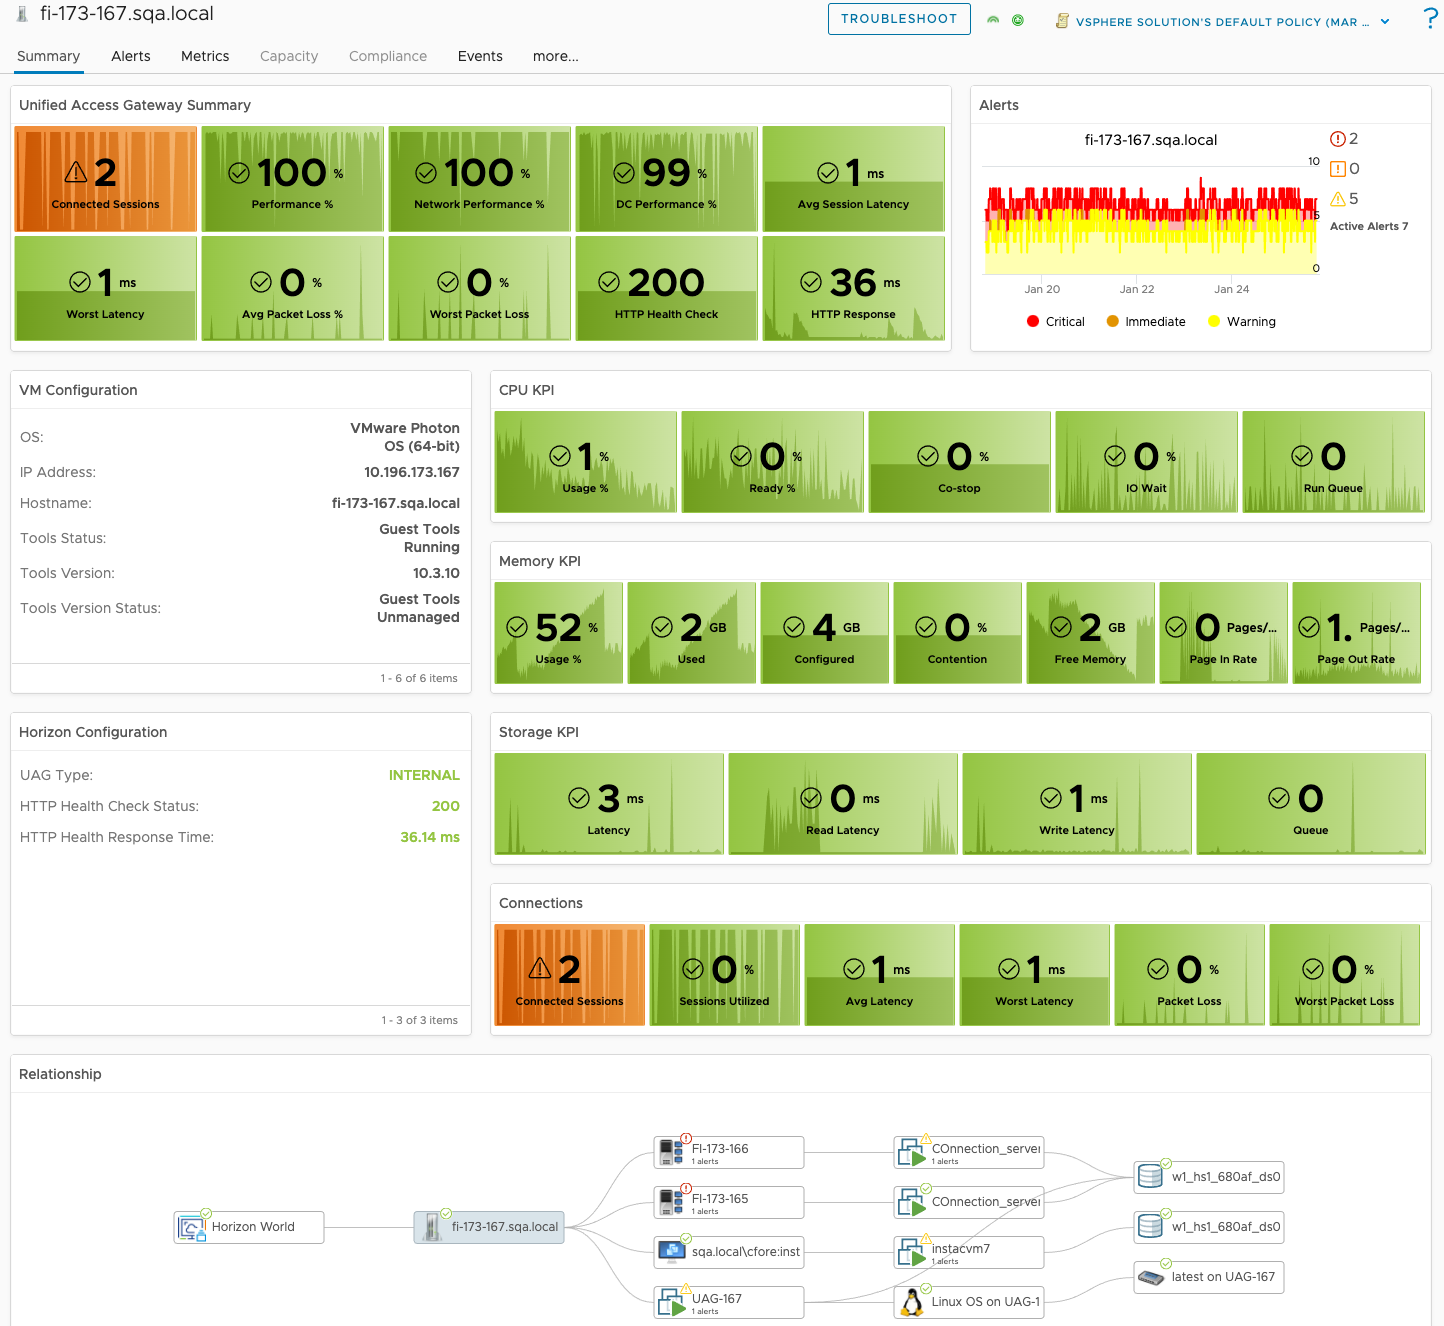
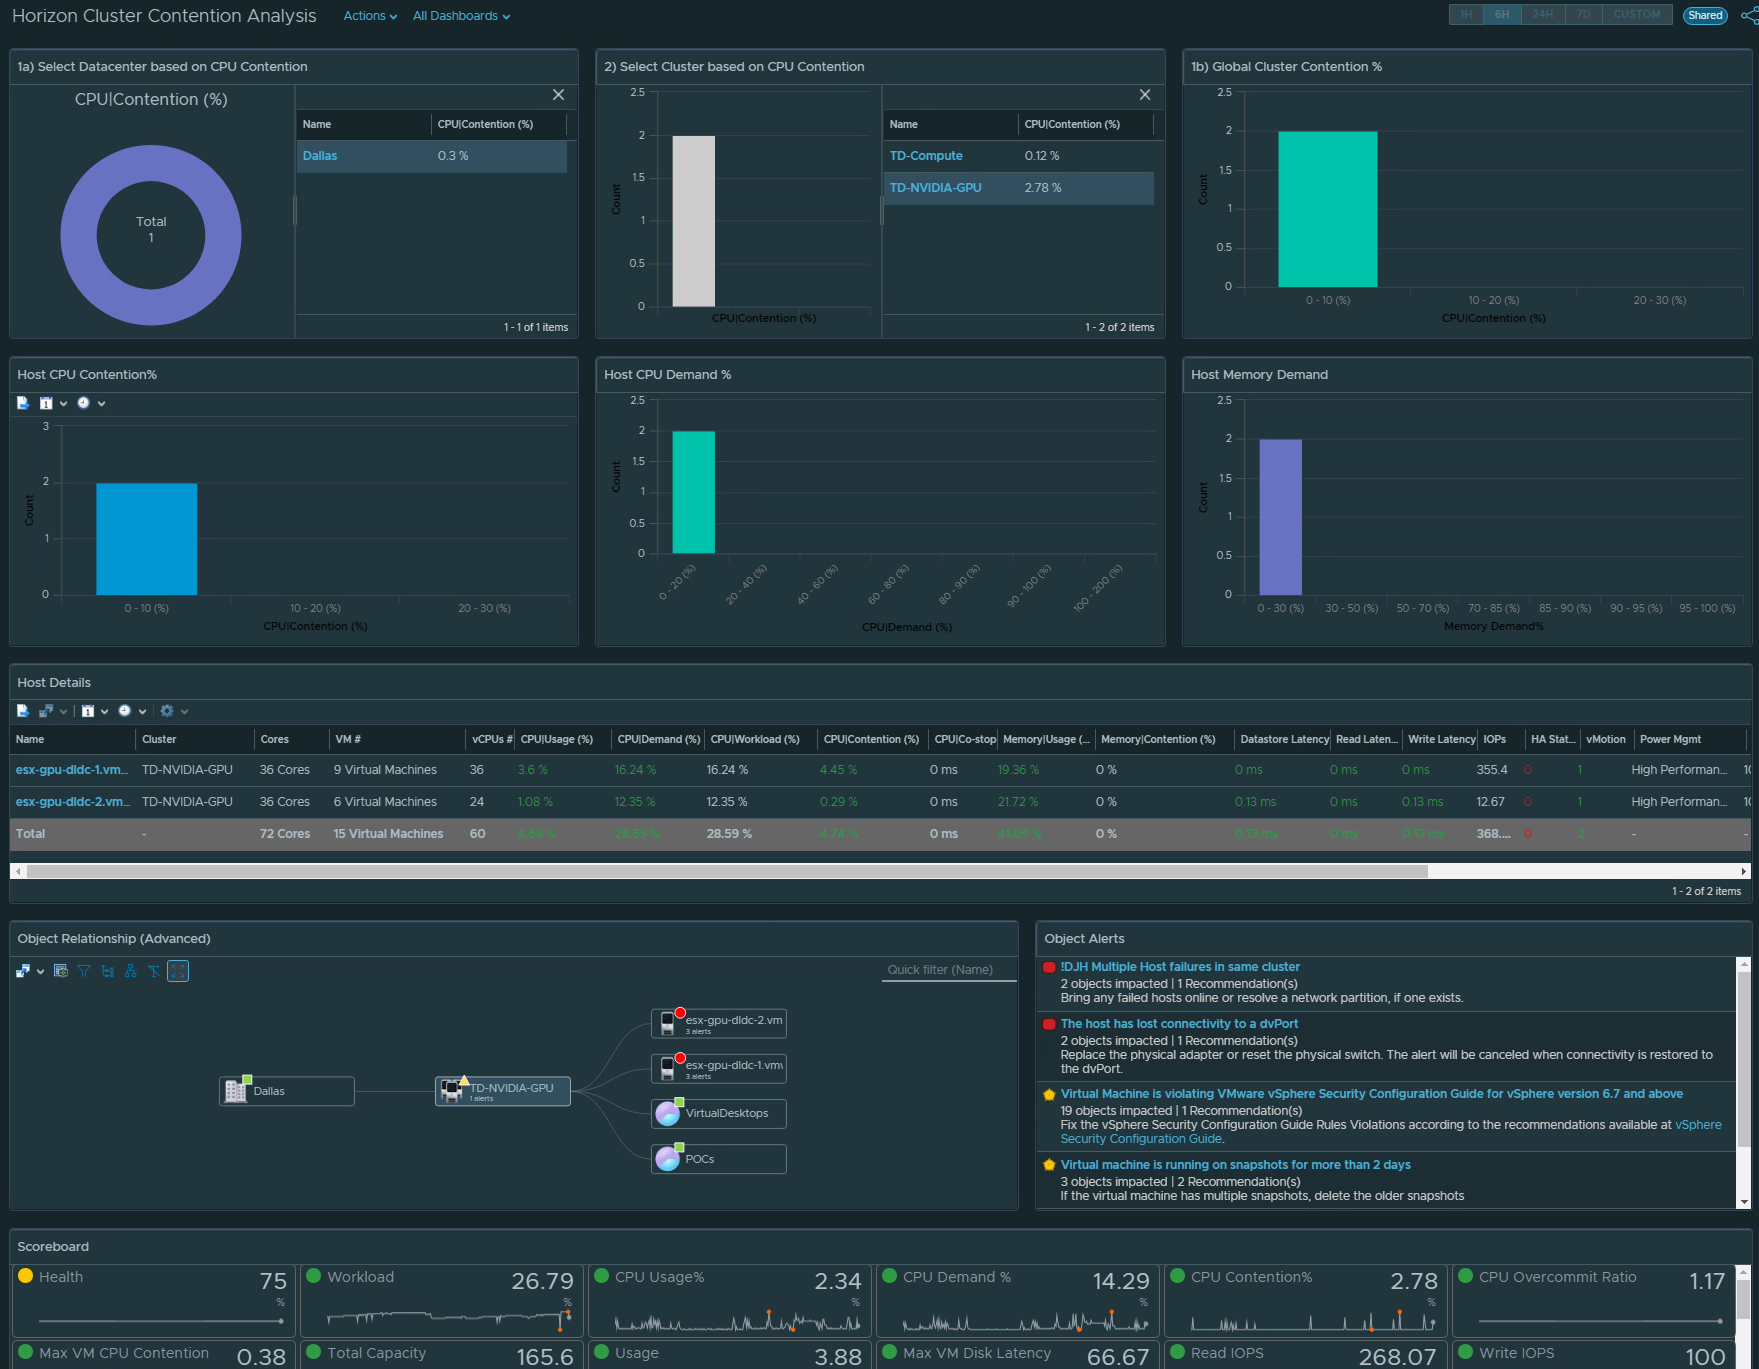
VROPs for Horizon gives us direct visibility into when these issues are occurring across all of the Active User Sessions of the Horizon View environment.  However, once the session becomes inactive, it will go into a stale object state and be removed from vROPs during a clean-up window.

To be able to view this information historically on Pools and User objects, you can create Super Metrics that simply maps the session latency to the objects you want to report on.

Creating the Super Metric

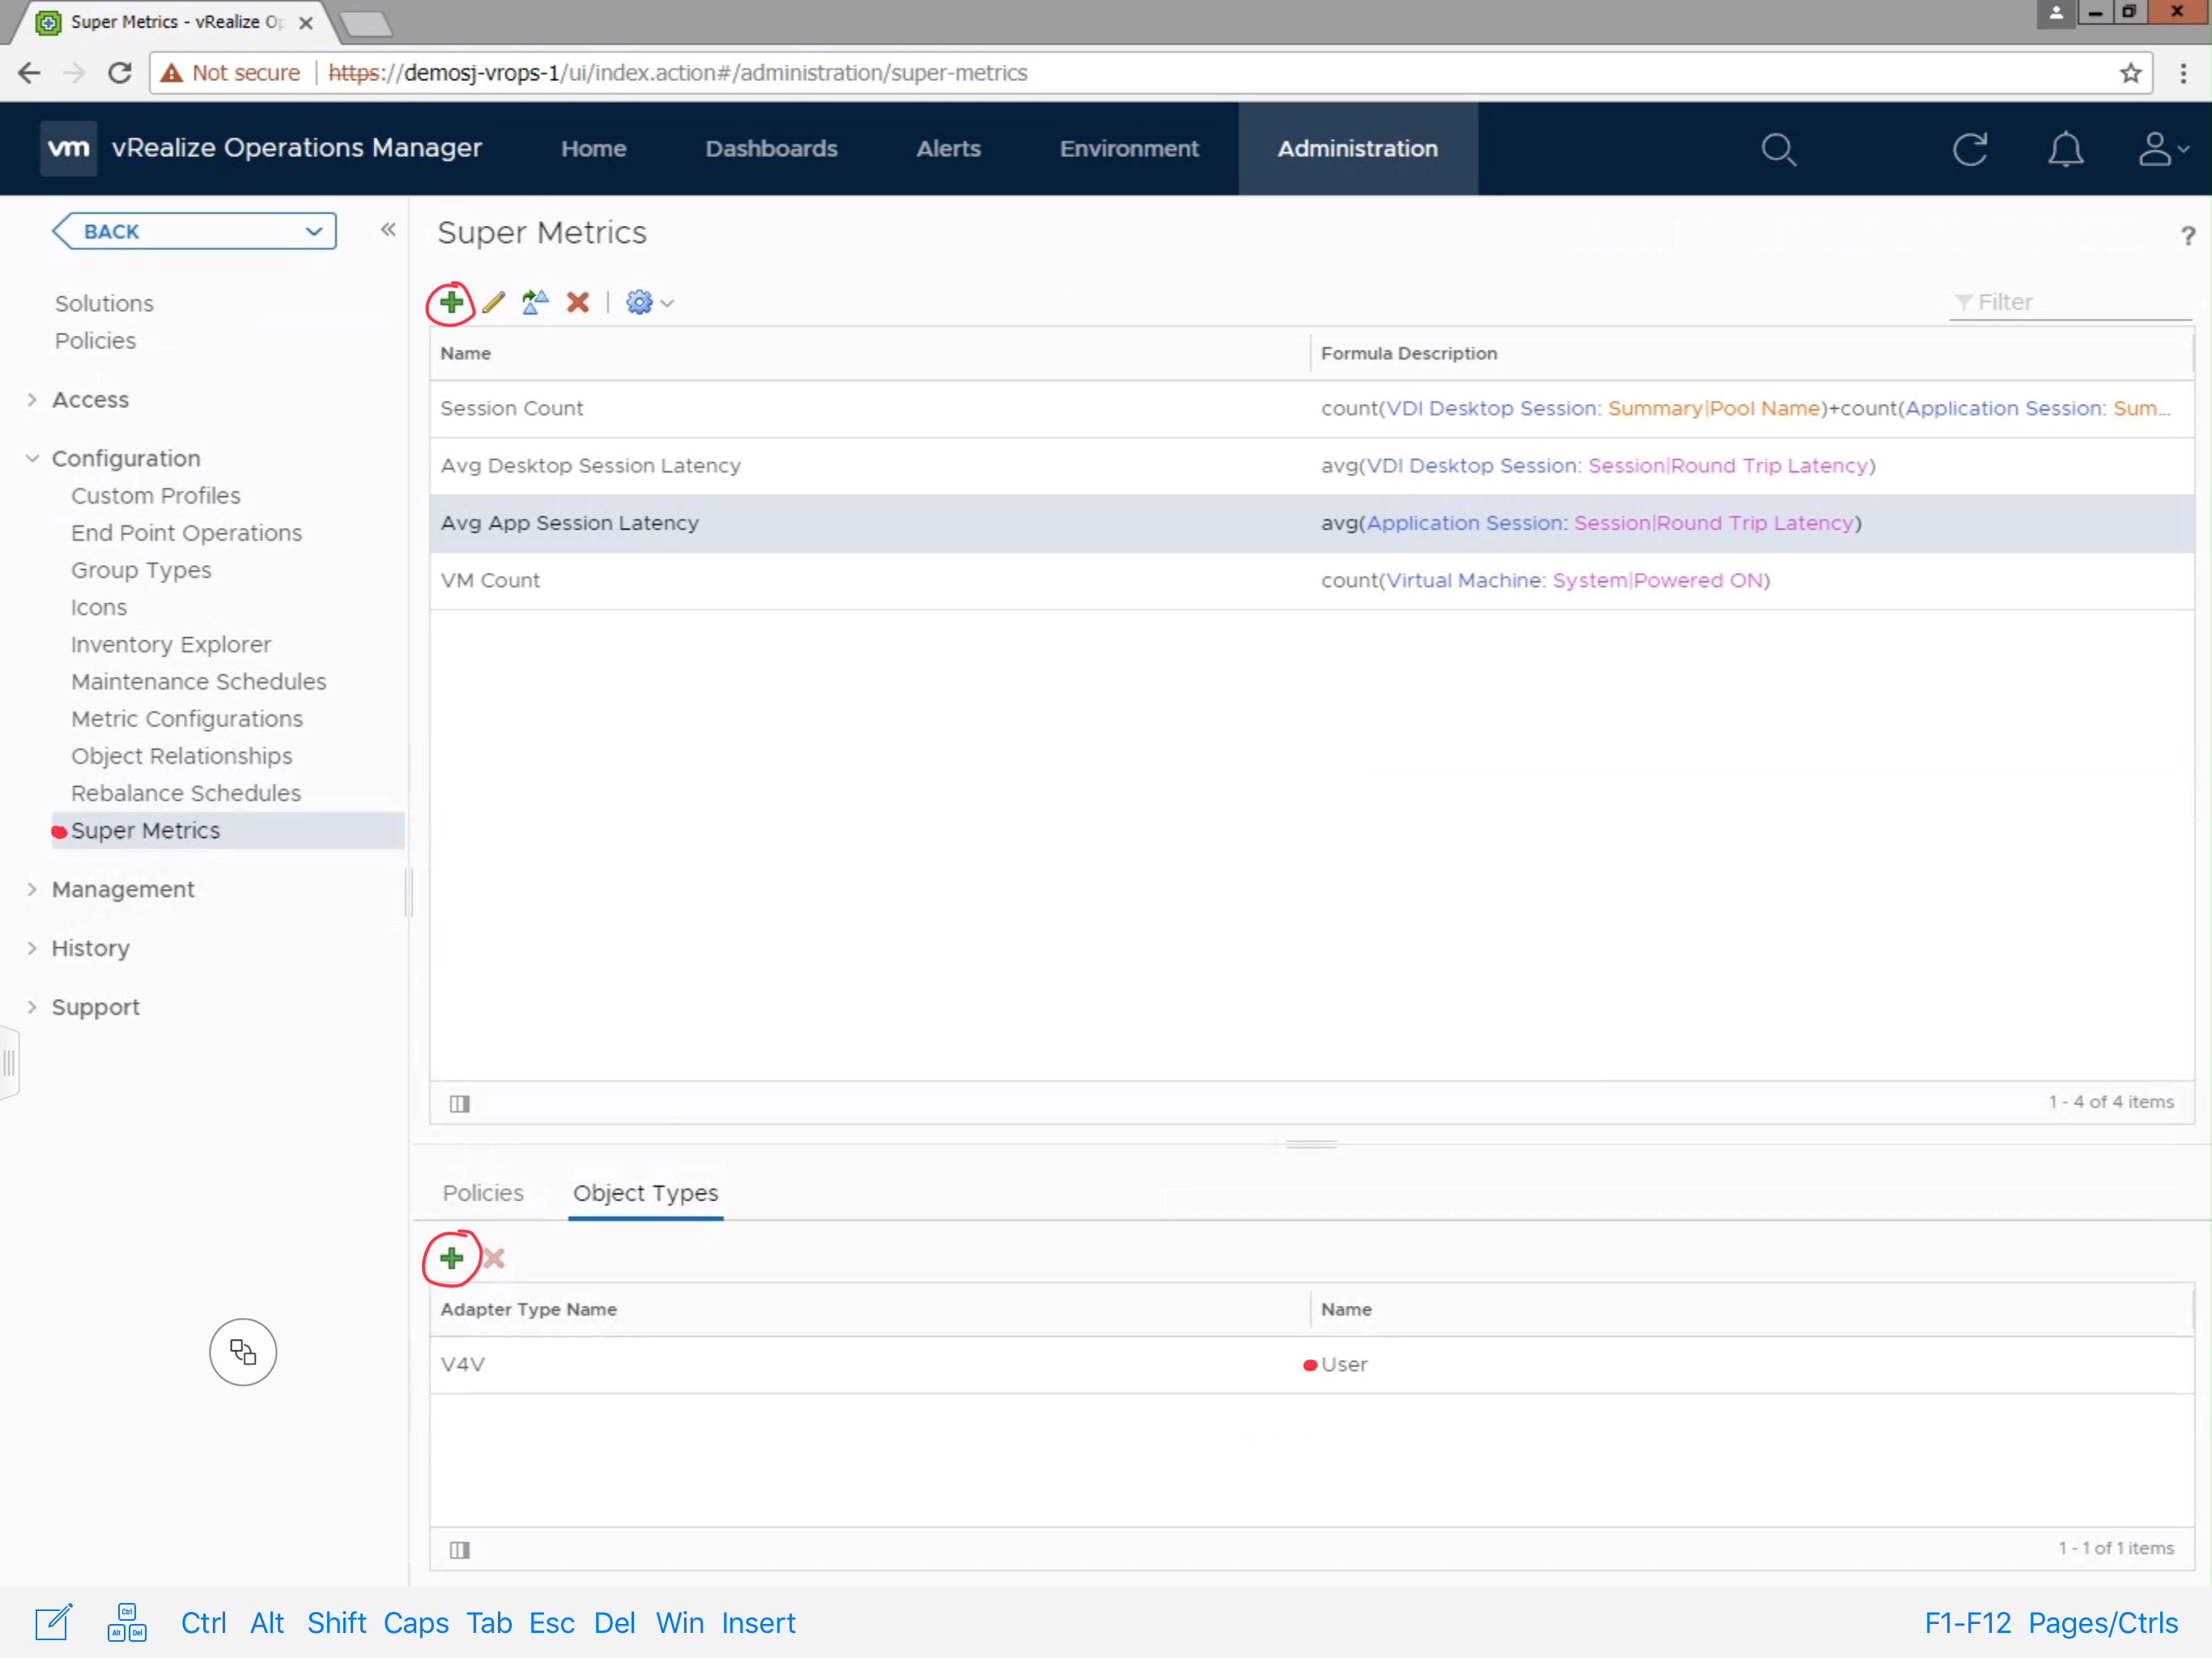
To create the Super Metric, Navigate to Administration -> Configuration -> Super Metrics.  Click the green + sign to create a new Super Metric.

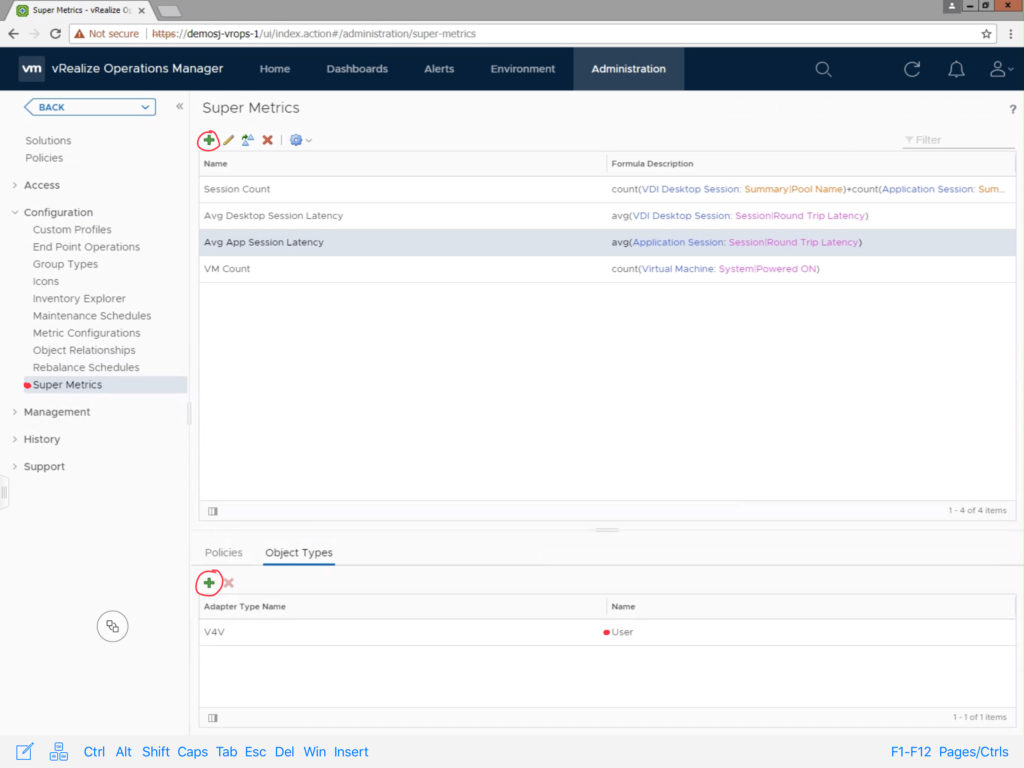
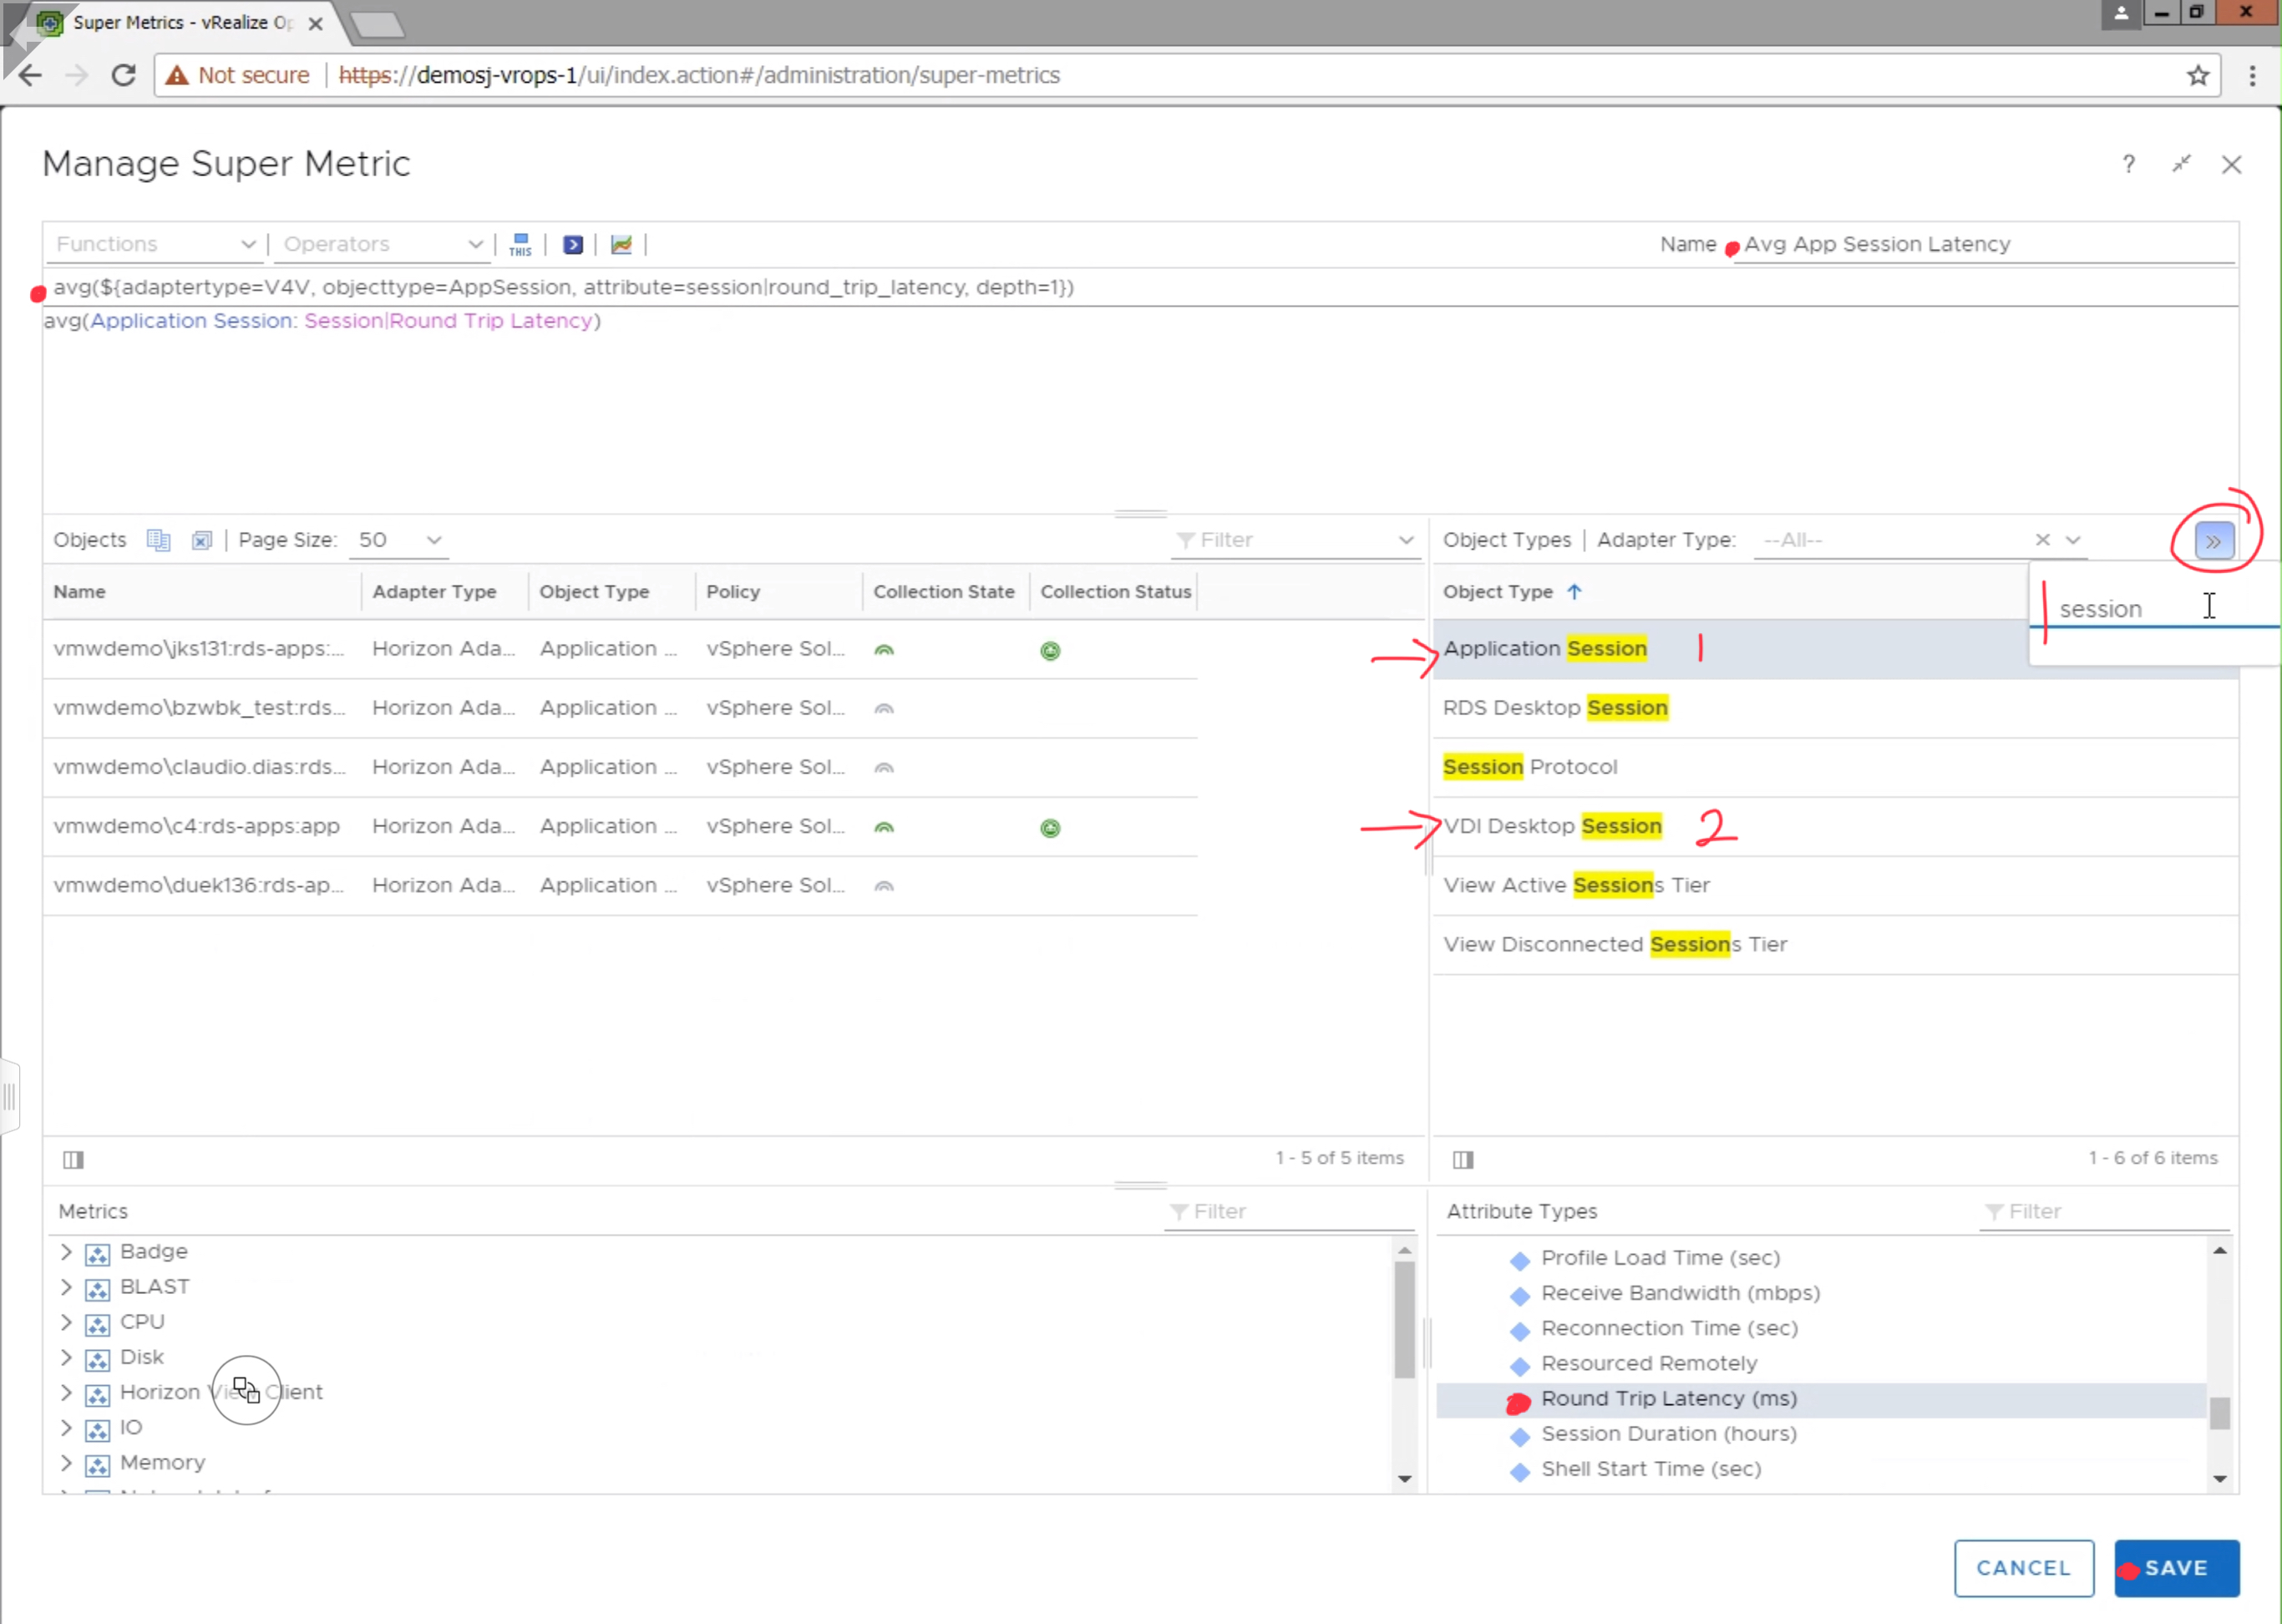
Provide the Super Metric a unique name, in this case we are using “Avg App Session Latency”.  Search for the  “Application Session” Object Type, and click “Round Trip Latency (ms)” to add it to the Super Metric.  Since, we are looking for the average latency, select “avg” from the available functions list, making sure that the average function applies to the metric by encapsulating it parenthesis as demonstrated in the image below.  Click Save to finish the Super Metric.

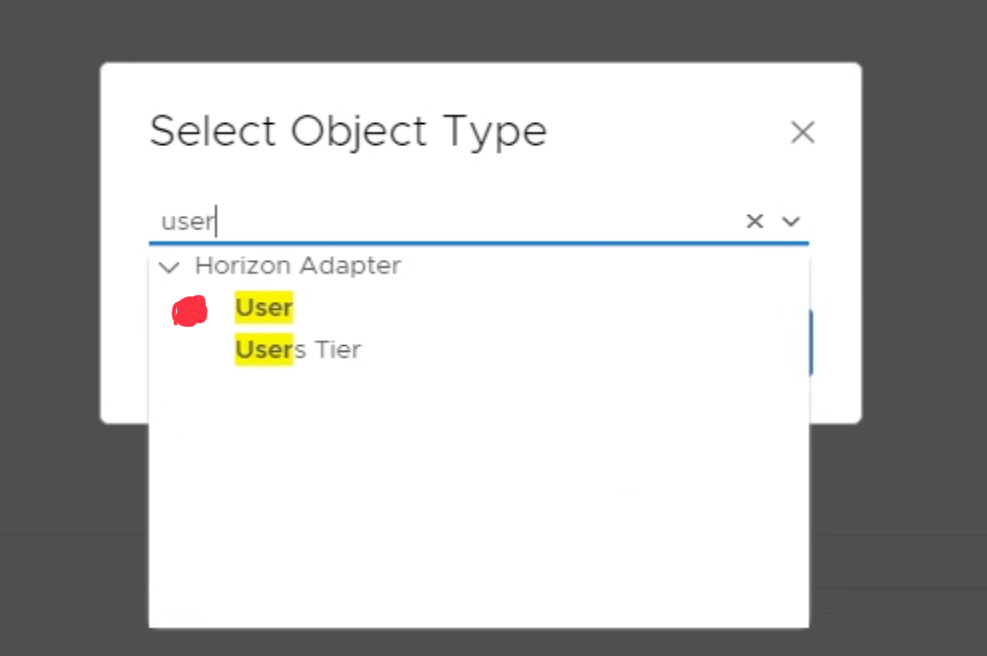
Next, you will need to add the Super Metric to the “User” object type.  Click the green + sign under the “Object Types” section.  Search and select the “User” object type.

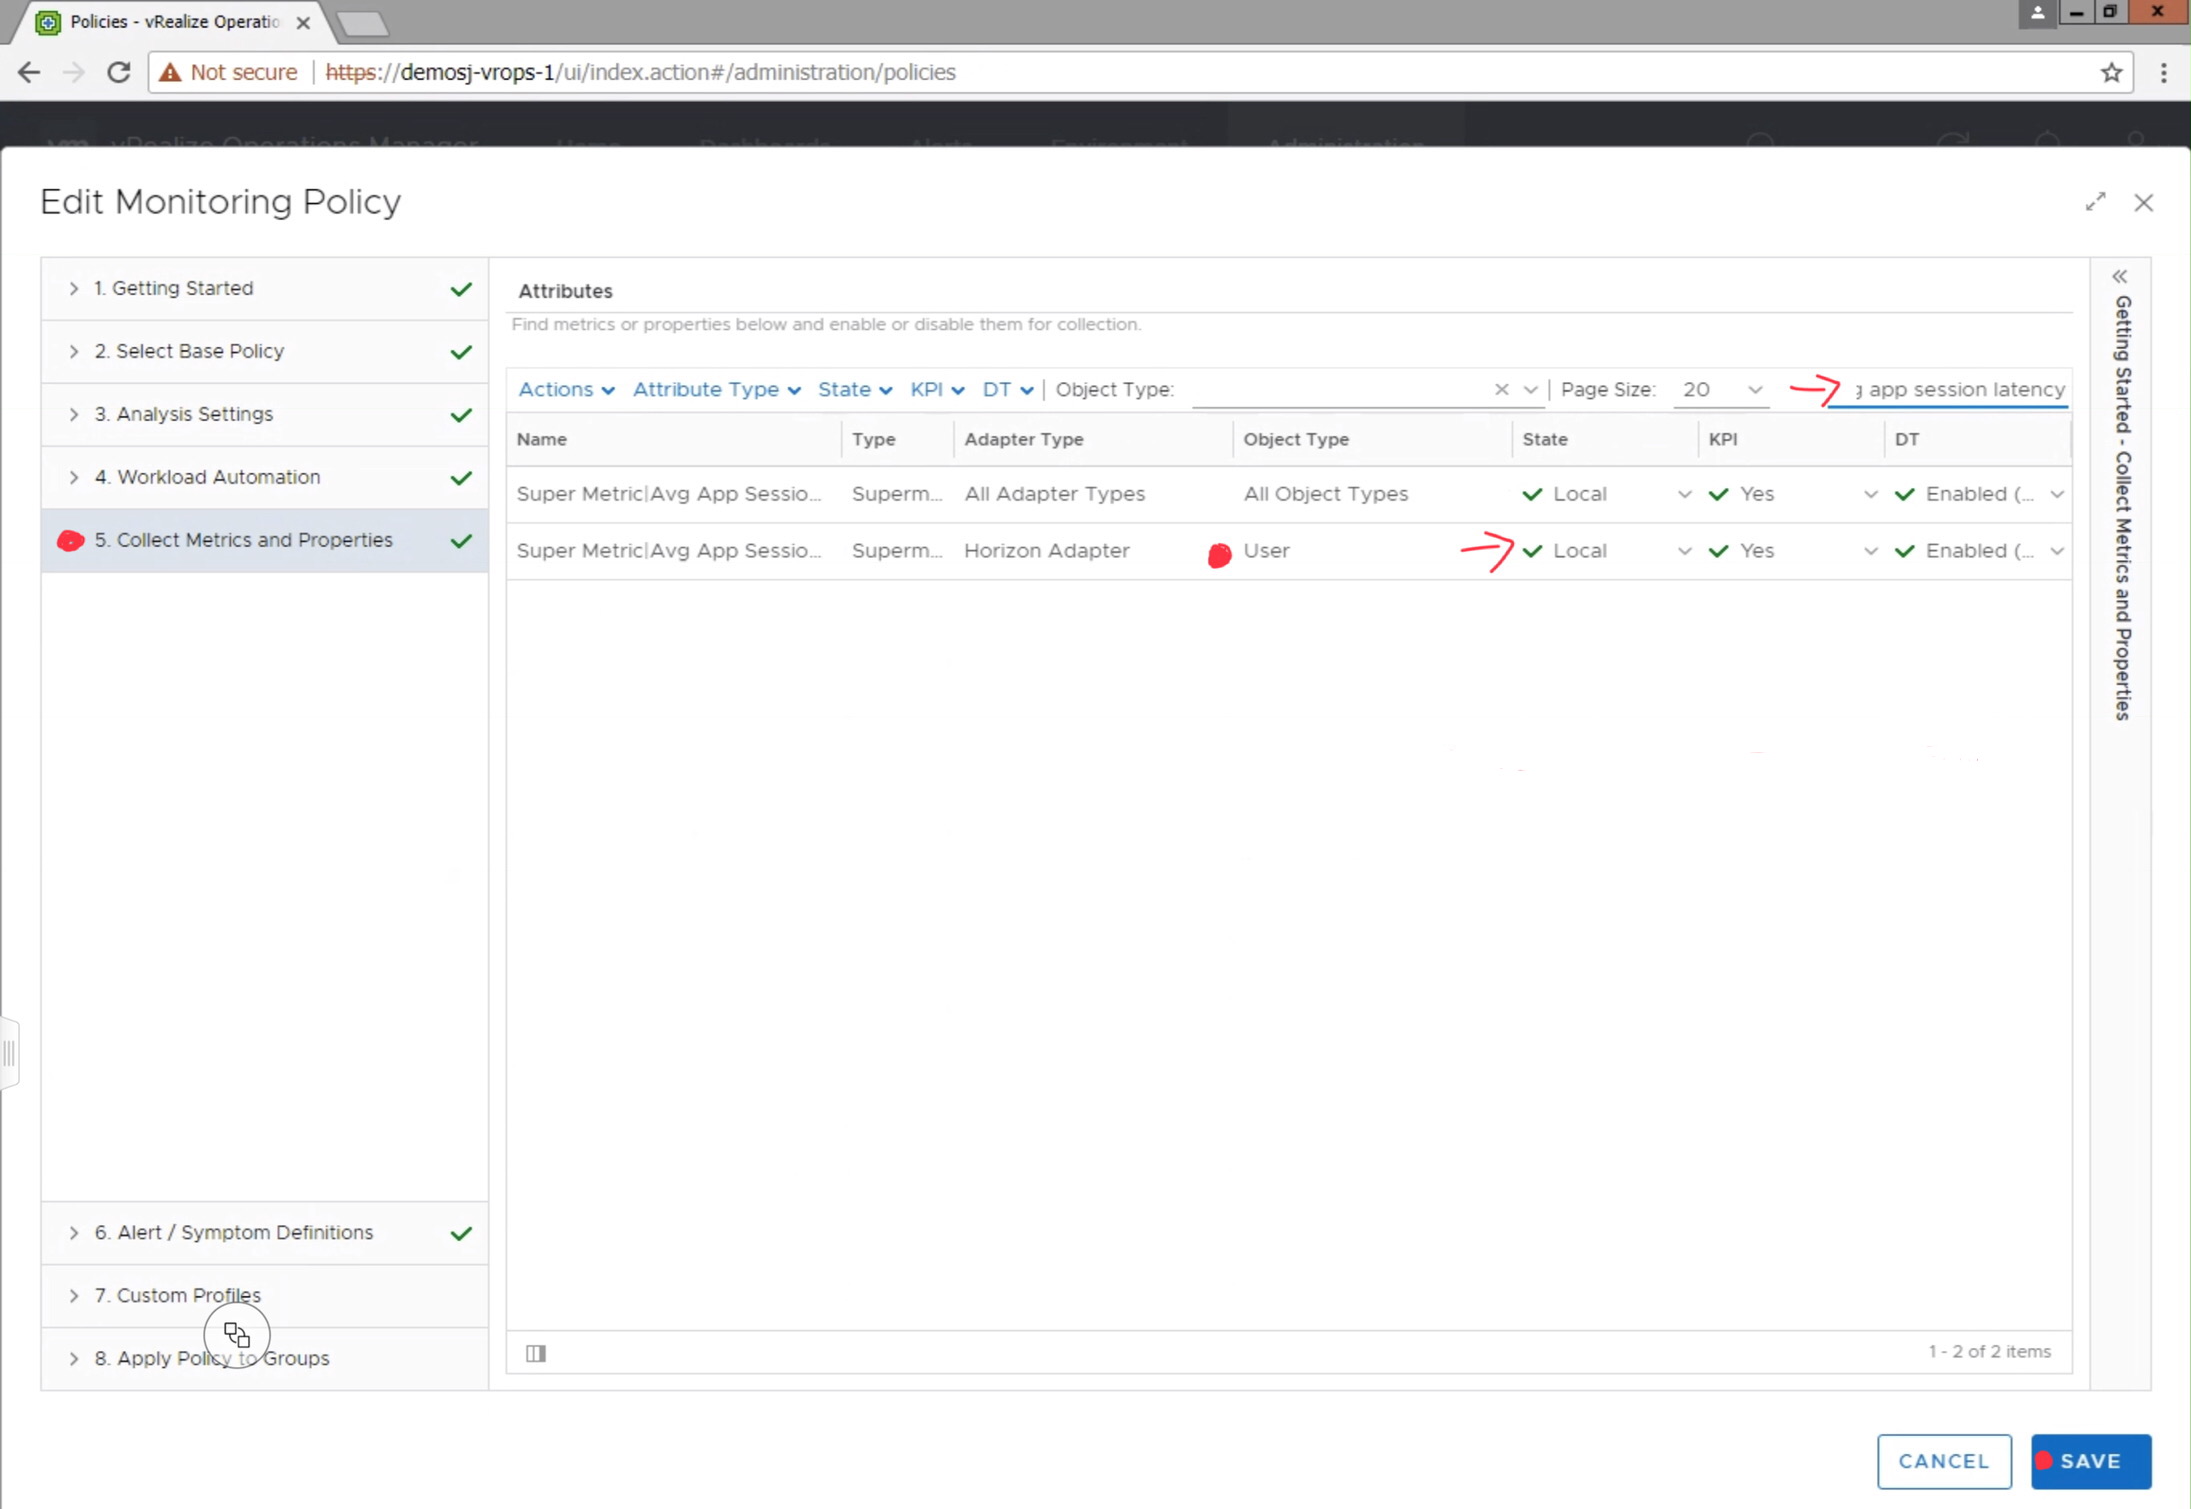
Before the Super Metric will begin collecting data, you will need to navigate to Administration-> Policies, and edit the active monitoring policy to enable the metric for collection.

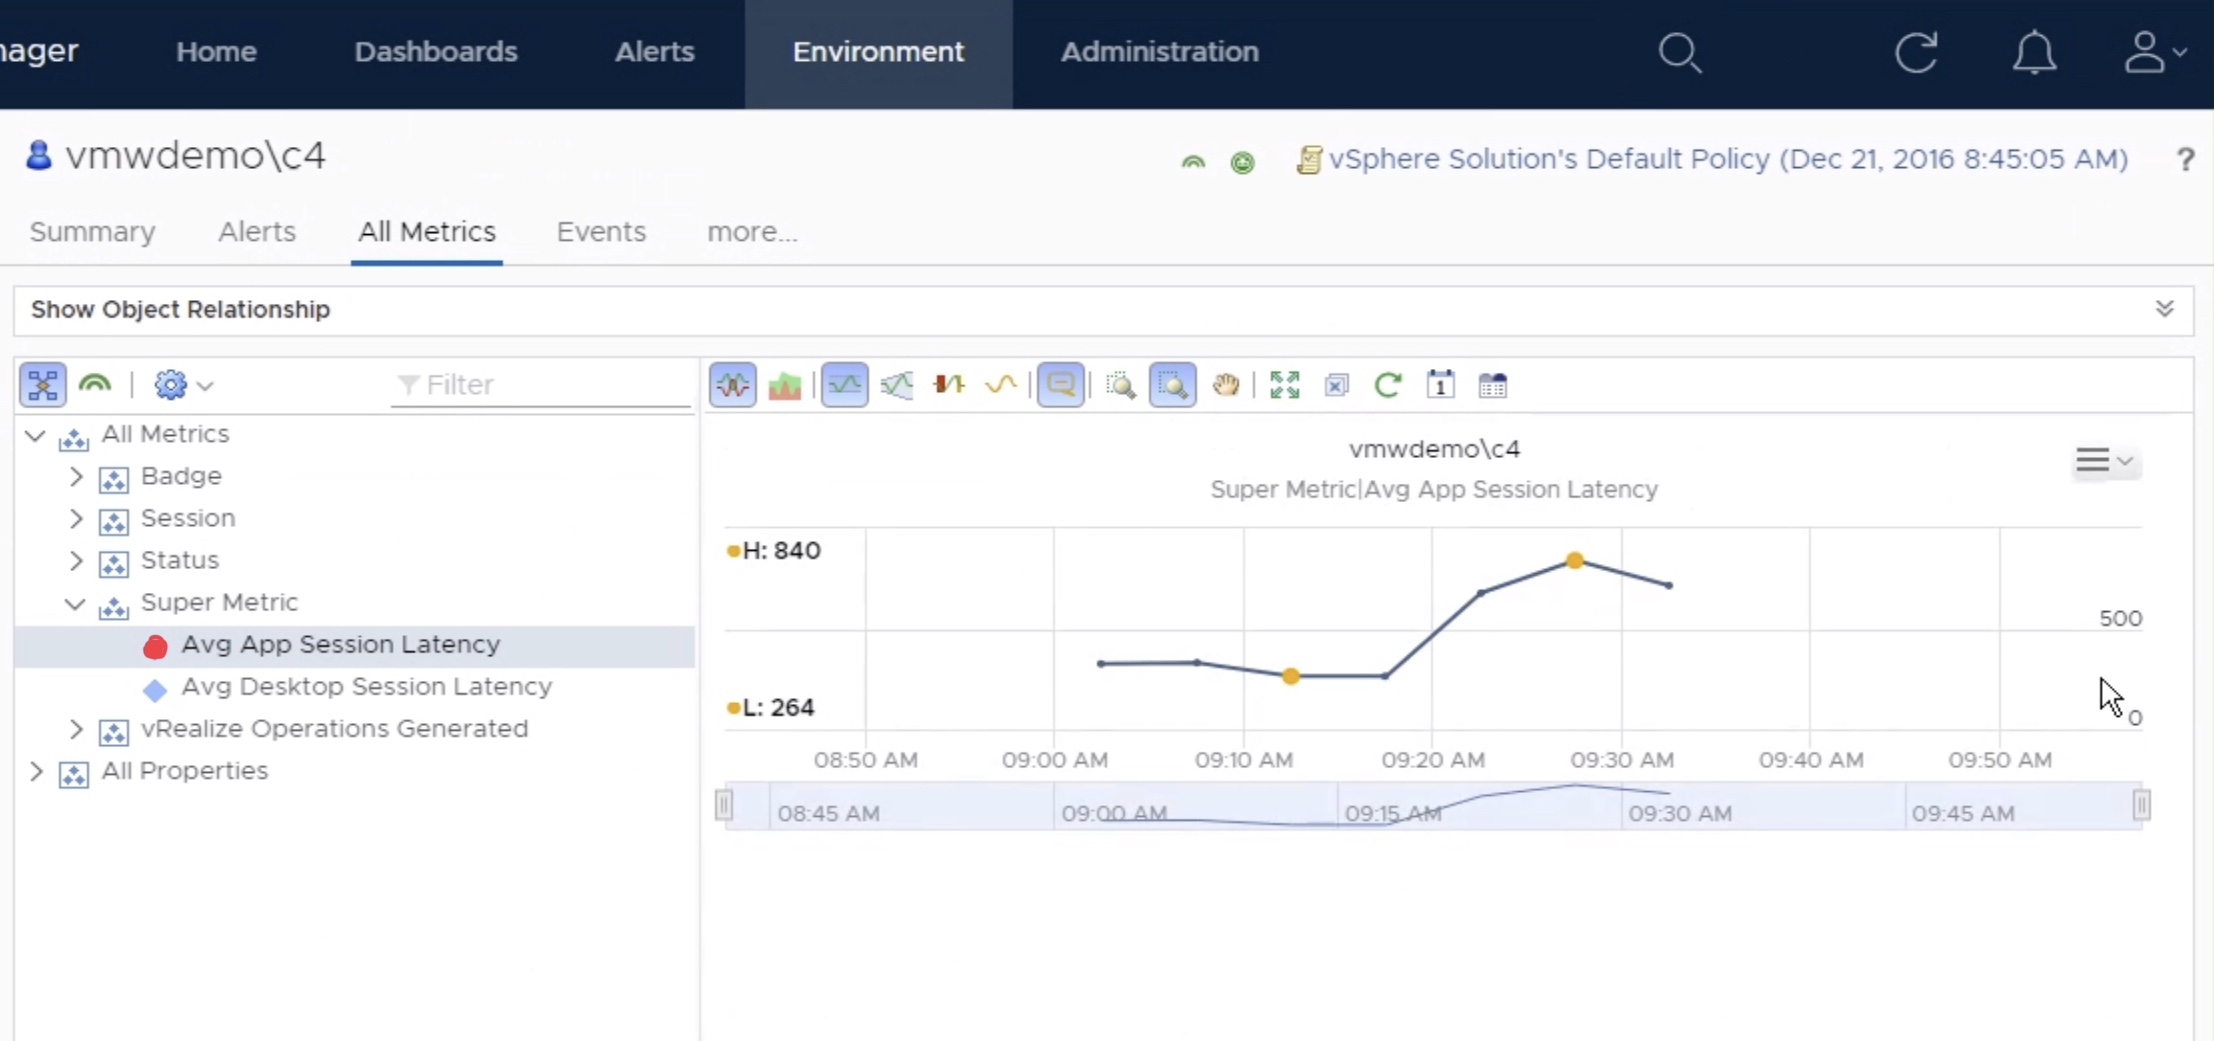
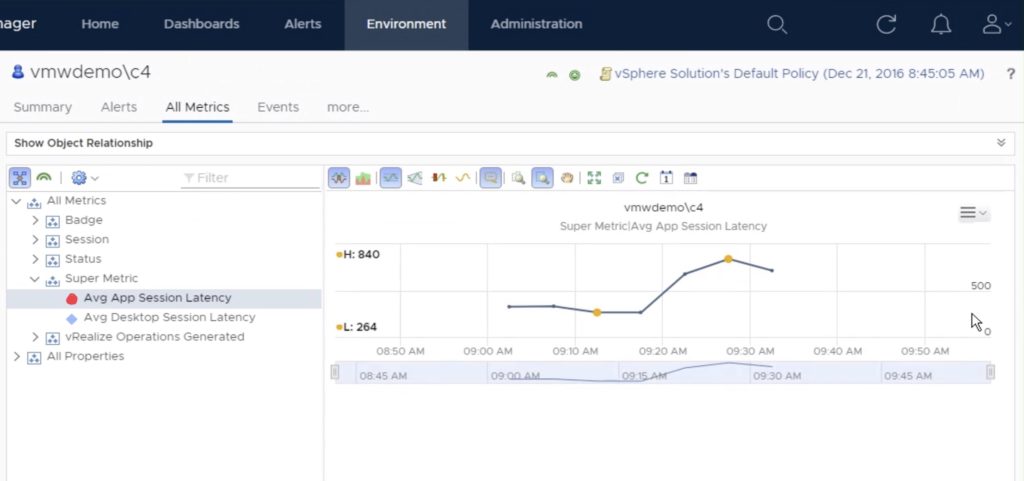
Once the metric has started to collect data, you can view the data on a individual “User” object by selecting “All Metrics” -> Super Metric -> select metric.

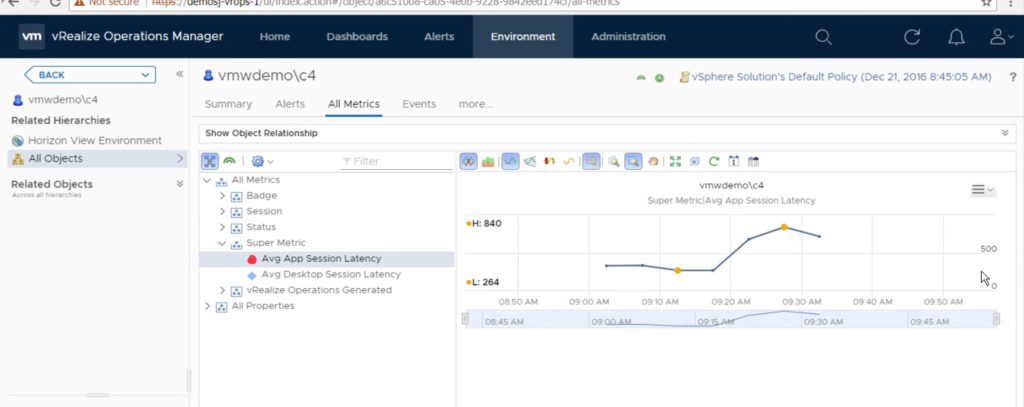
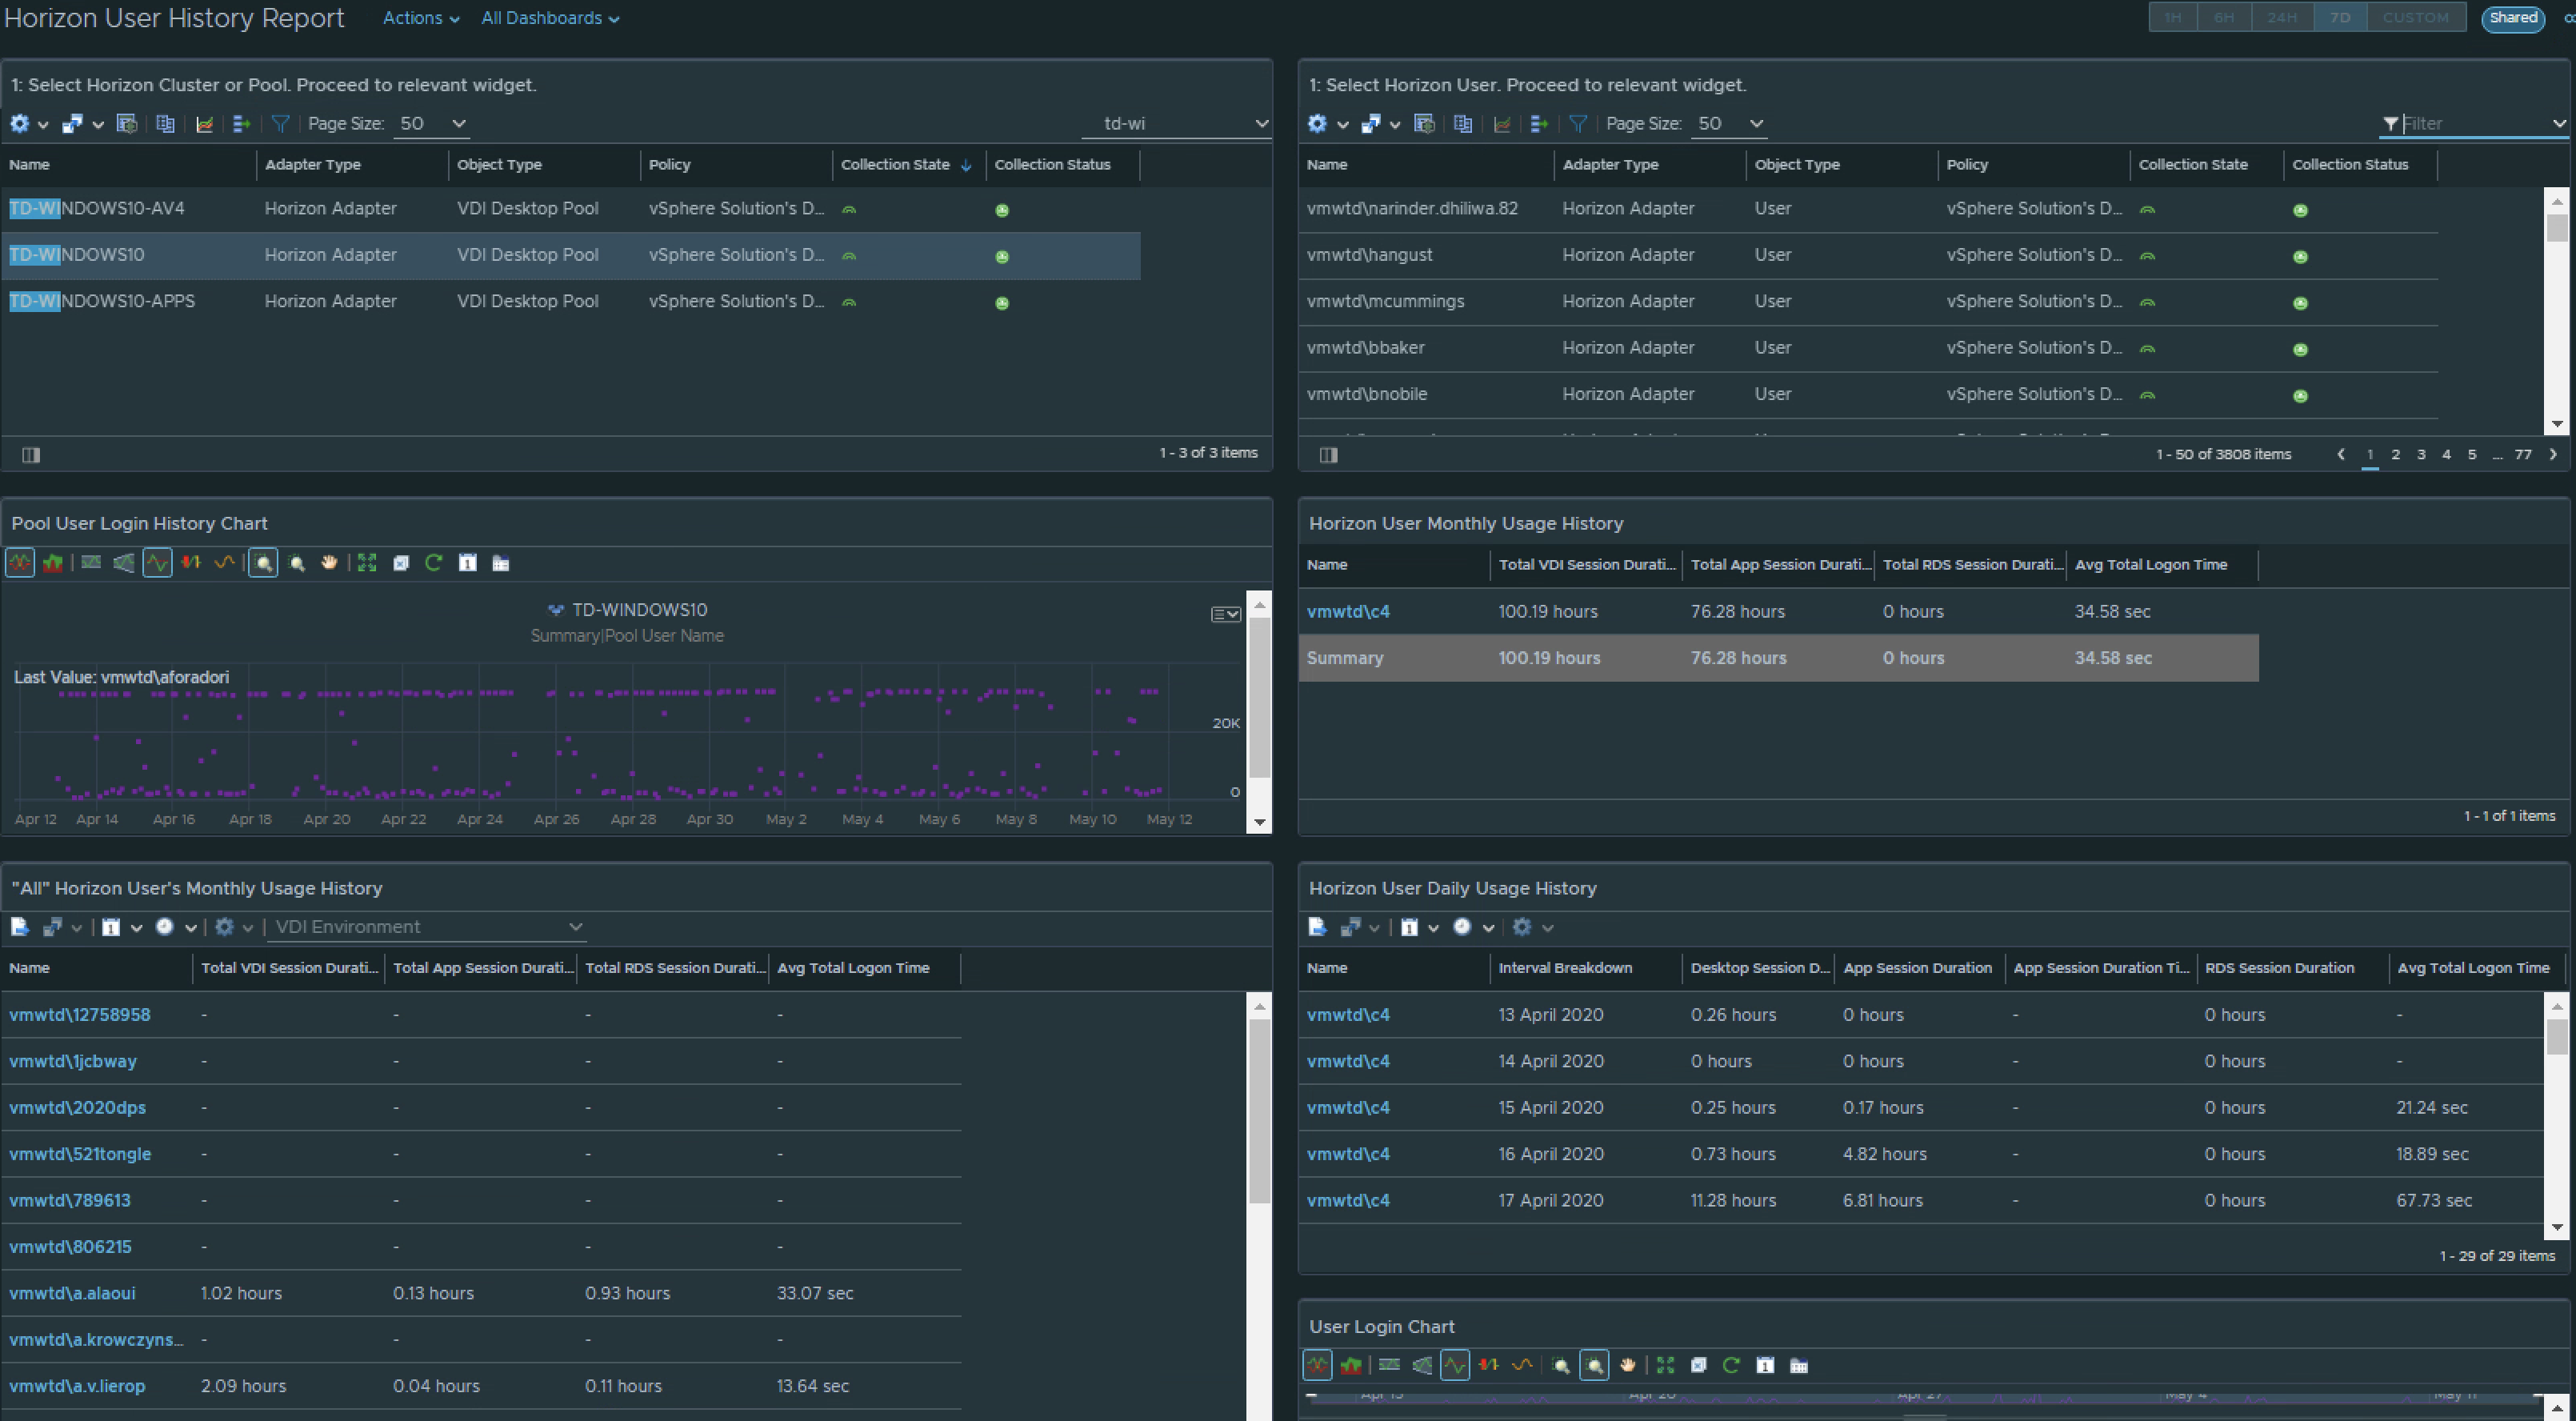
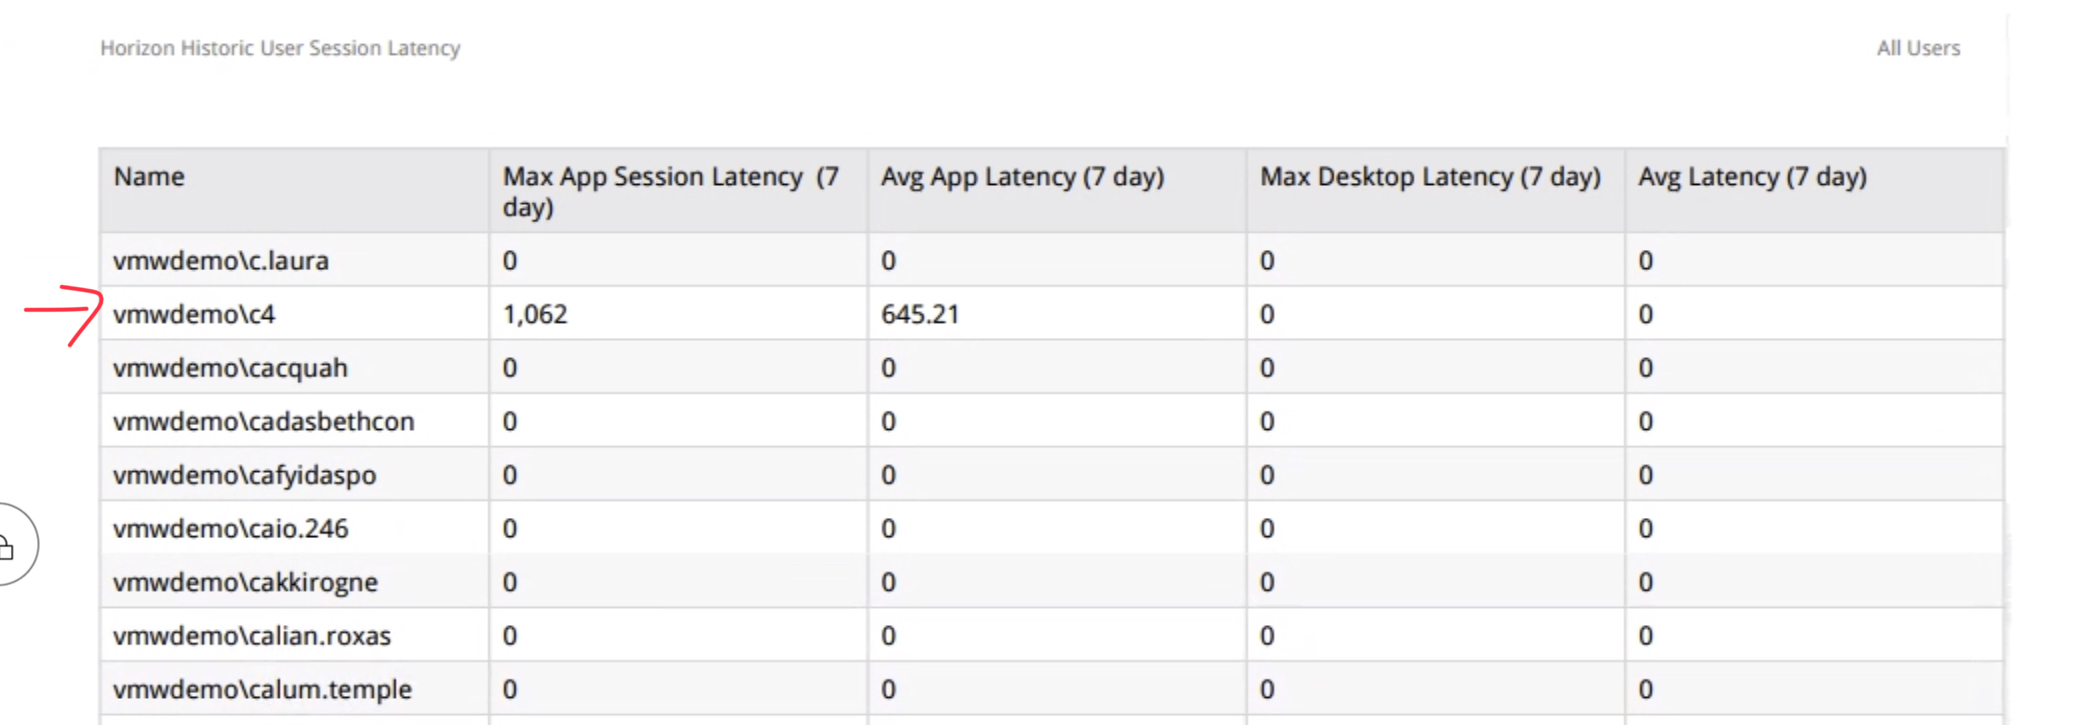
You can also create custom Views that display the historical latency for all users of the environment, as well as perform simple roll-up statistics.

Getting More out of VMware vRealize Operations for Horizon – training video

Getting More out of VMware vRealize Operations for Horizon training video:

In this training video you will learn how to quickly operationalize the vROPs for Horizon solution, and how it provides end-to-end visibility into issues plaguing your Horizon View users.  Learn how to use the latest Help Desk dashboard to get instant insight into “Why their desktop is slow”.