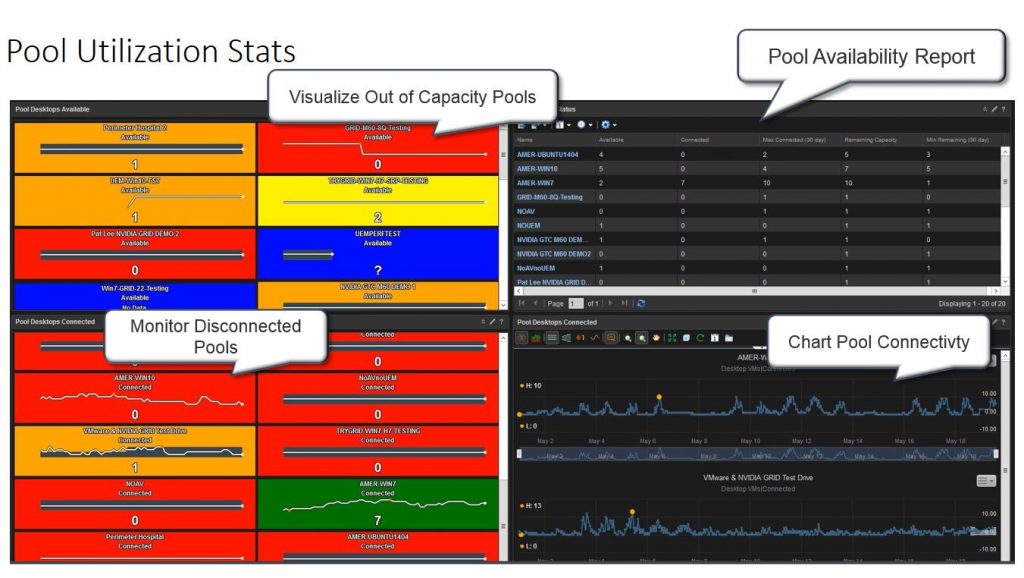
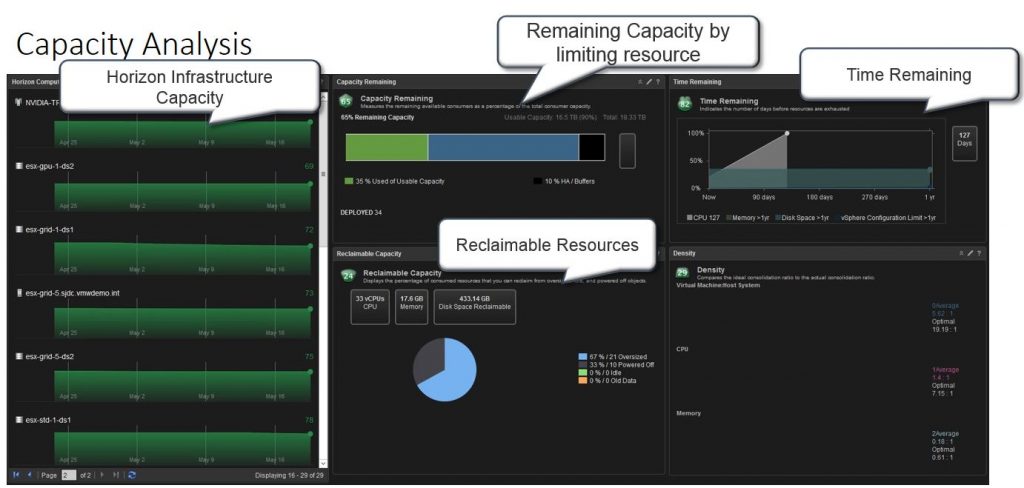
**This content is now included out-of-box in the vROPs for Horizon Adapter installation .pak file and dashboards download file available at: downloads.vmware.com
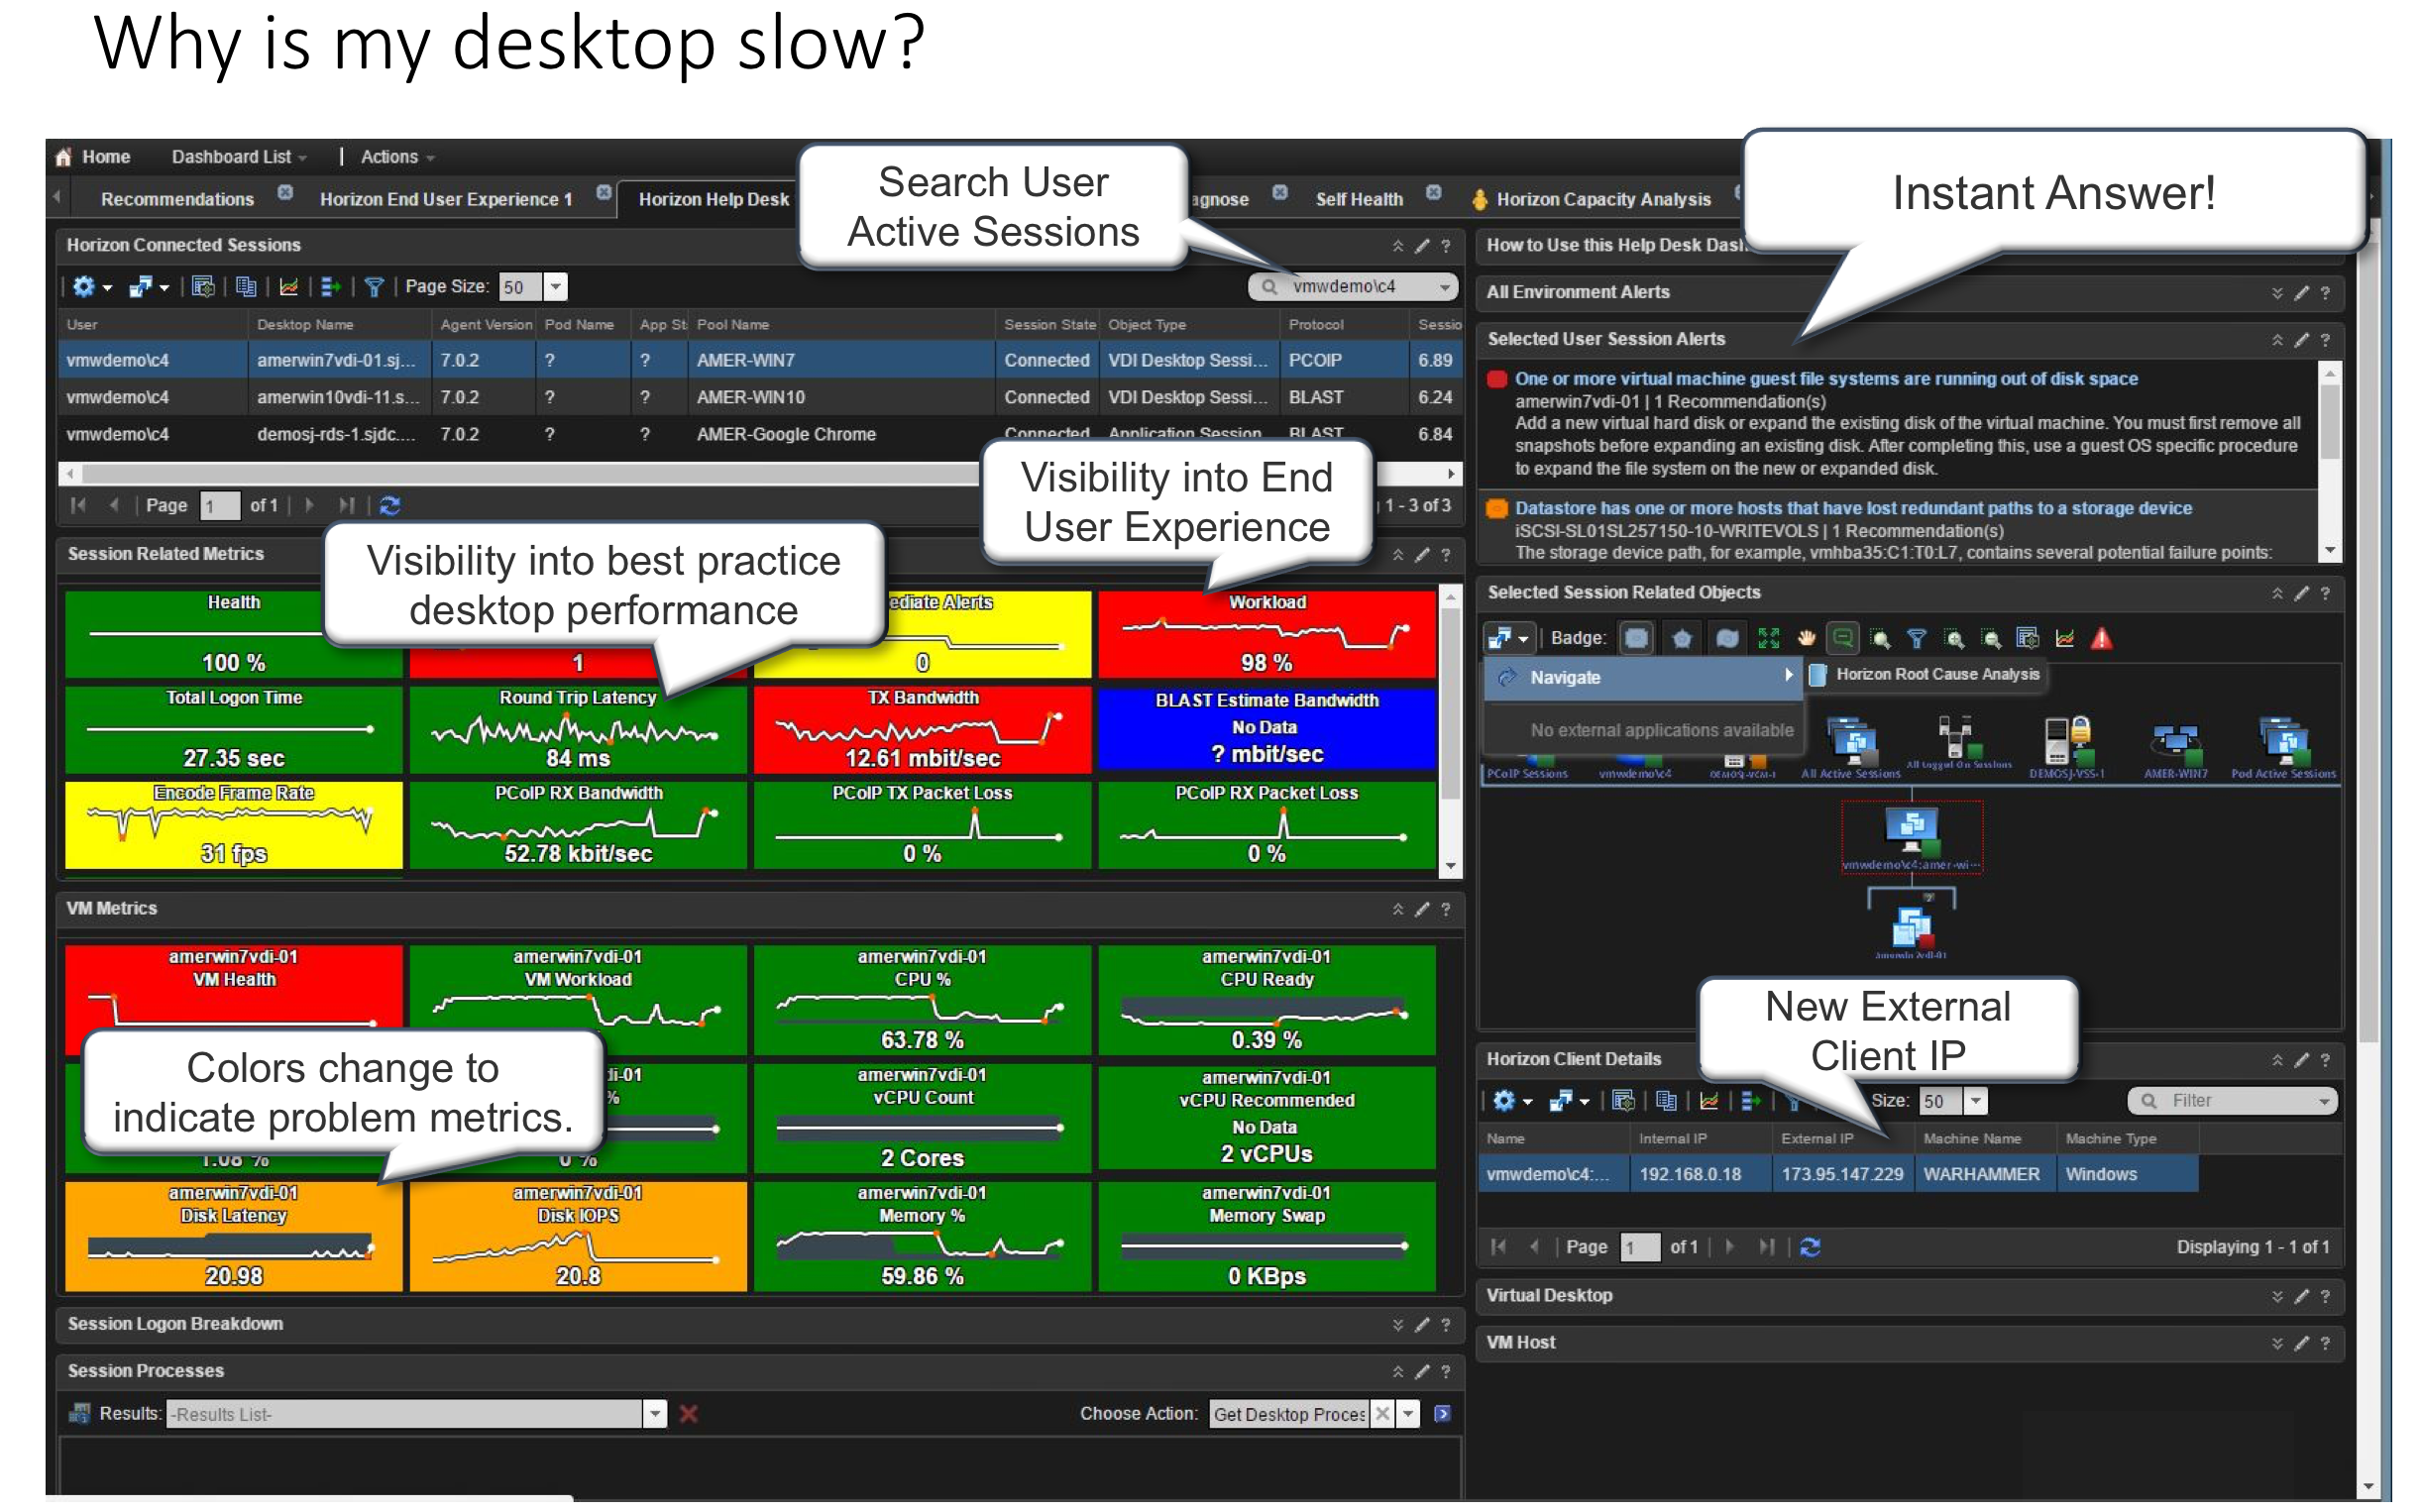
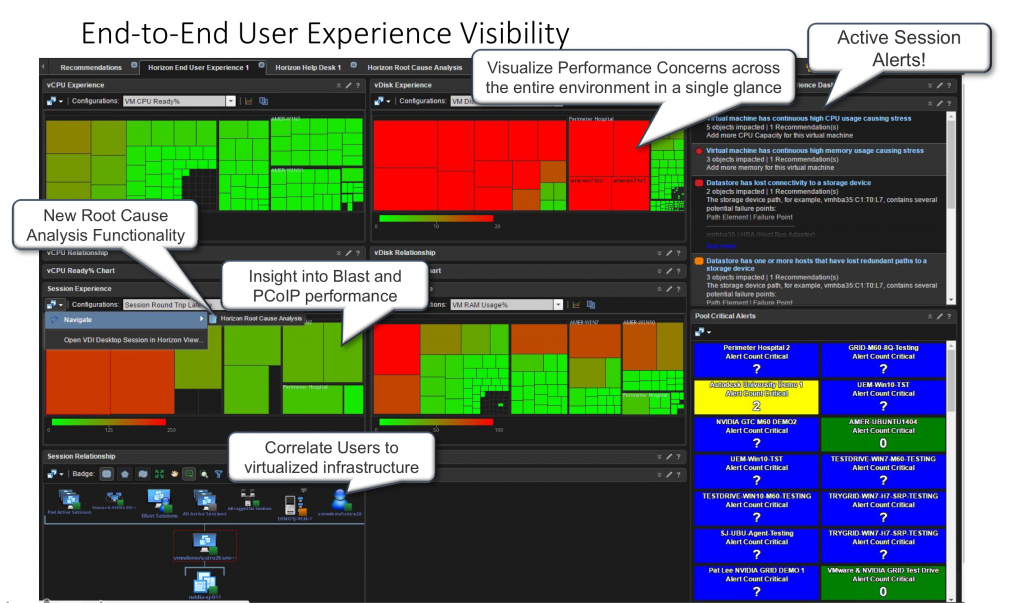
The latest vROPs for Horizon custom content includes an updated End User Experience and Help Desk dashboard, with Blast Session Metrics and Alerts, Horizon Client External IP address, as well as new Navigate to “Horizon Root Cause Analysis Dashboard” functionality.
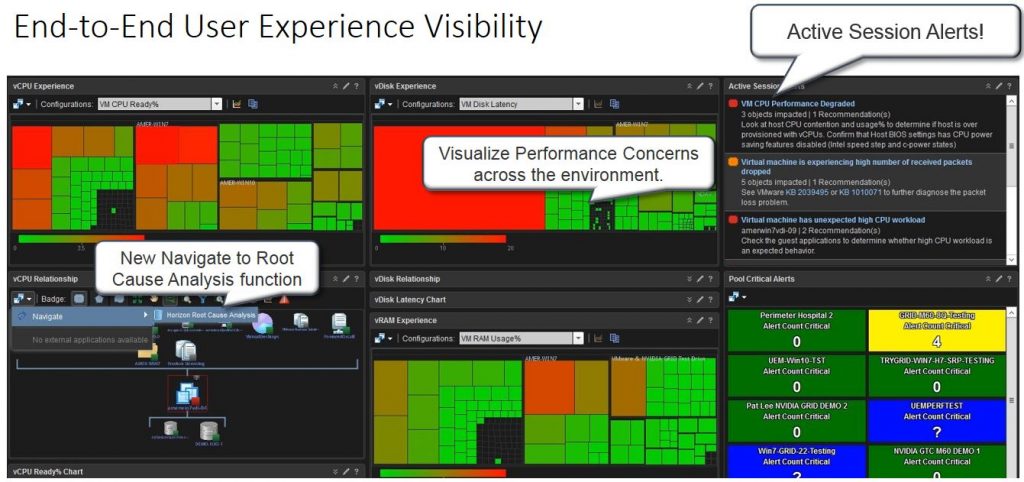
End User Experience Dashboard:
To use the root cause analysis dashboard, select any object from a heat map or relationship chart on the End User Experience dashboard, then select the Navigate to “Horizon Root Cause Analysis” option to begin troubleshooting.
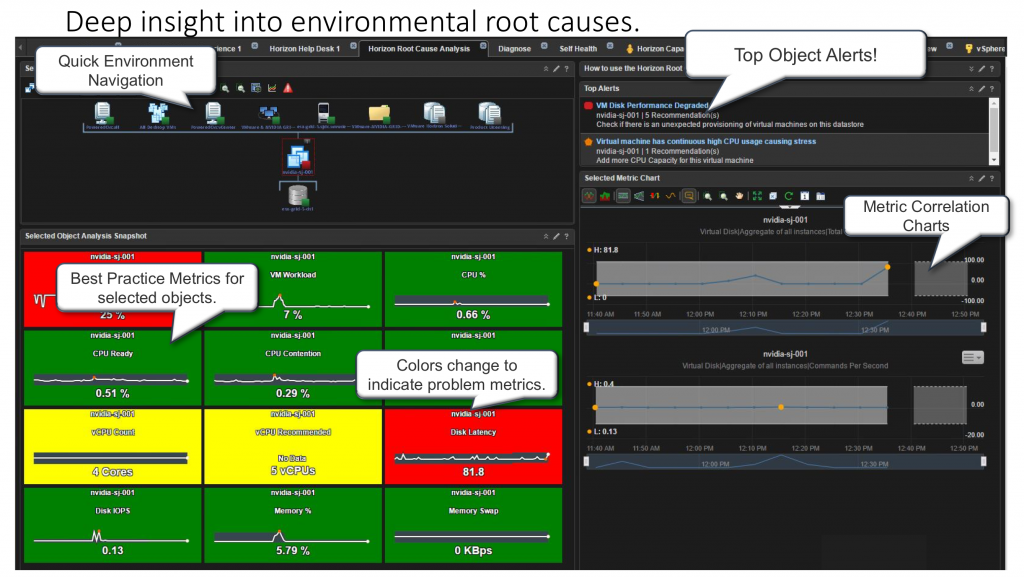
Horizon Root Cause Analysis:
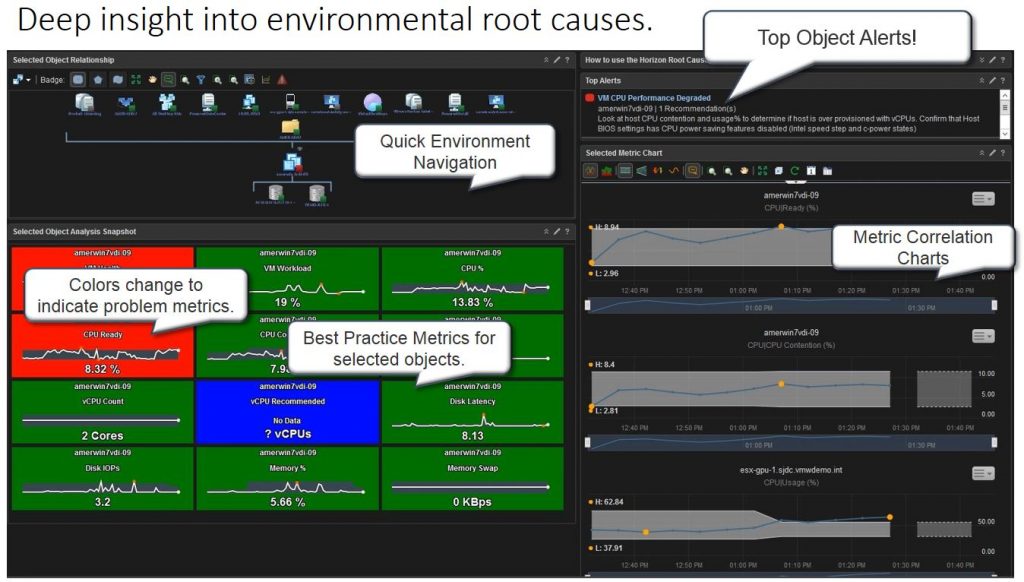
The Horizon Root Cause Analysis Dashboard allows you to quickly switch between correlated environmental objects, and see the best practice metrics and alerts on the selected item. Colors will change to indicate any problem metric, or simply provide visibility into metrics of “interest”.
Select the object you want additional information on, and the best practice metrics will be viewed in the Scoreboard below, as well as any alerts on the selected object. You can also click a Scoreboard metric to add it to the Selected Metric Chart widget, as well as switch objects, and continue to build out the metric chart with various environmental objects to put together a cross-environment “picture” for analysis.
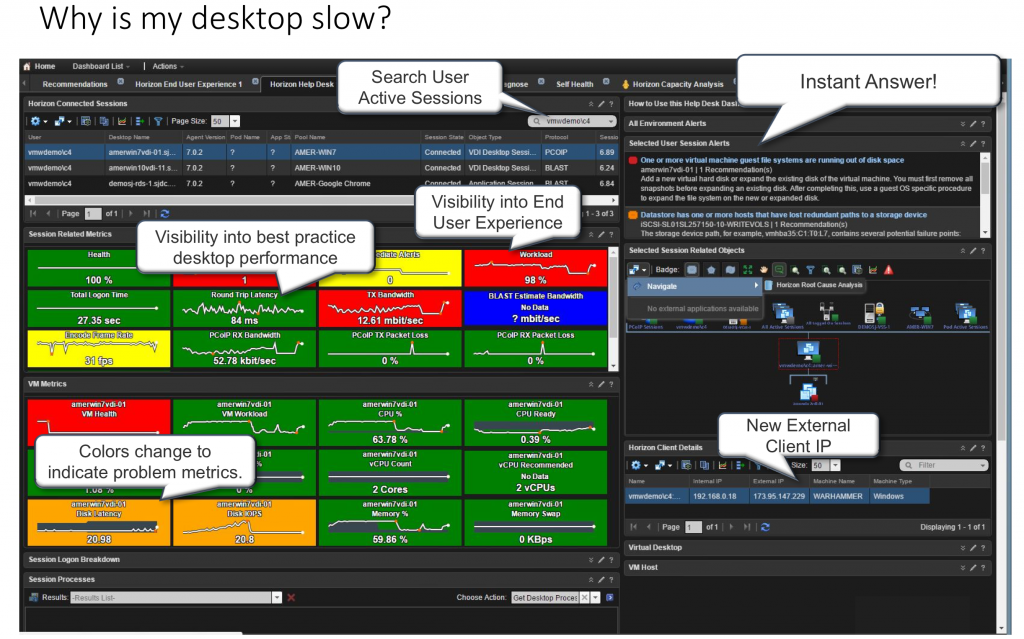
Horizon Help Desk Dashboard:
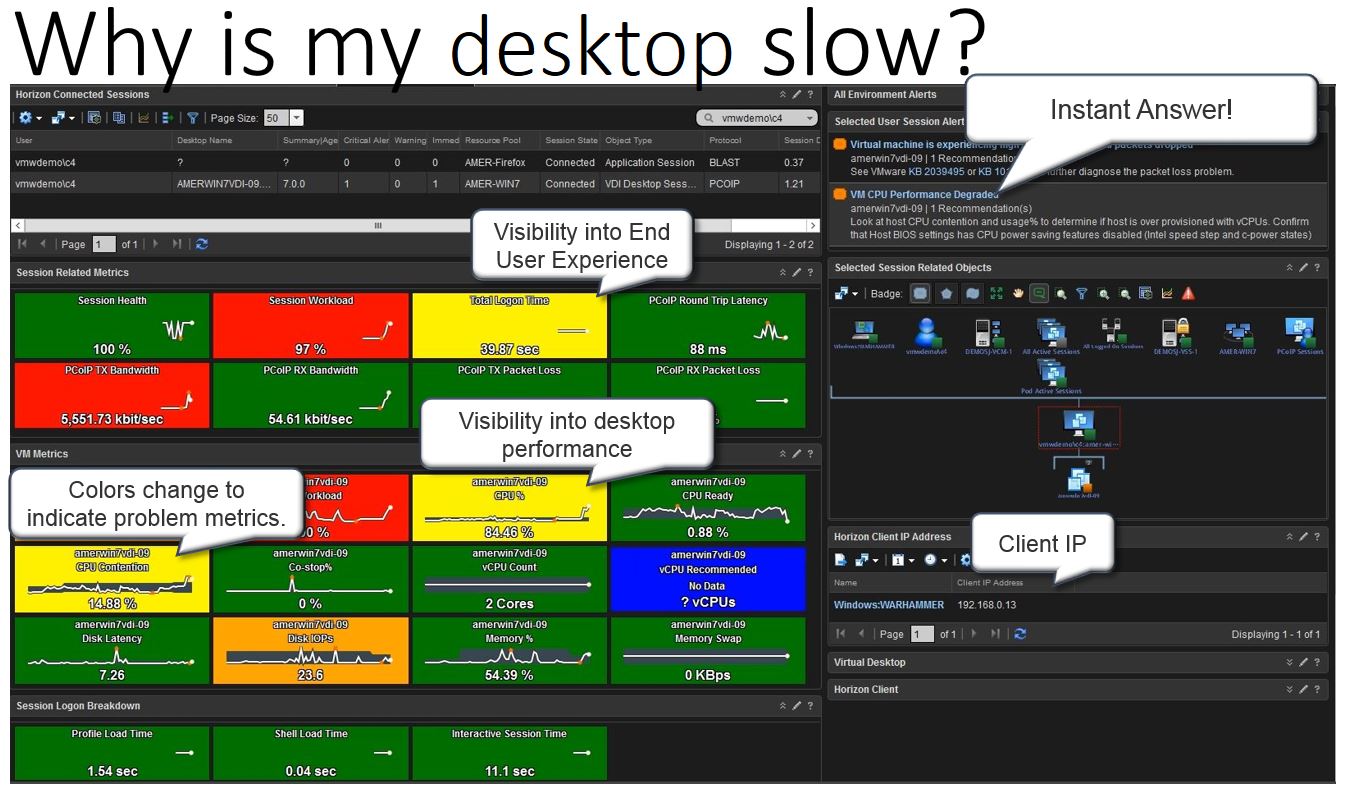
The latest Help Desk Dashboard includes Blast Session metrics and alerts, as well as an updated Horizon Client Details widget to include the External/Internal IP of the users client connecting to the environment. The navigate to “Horizon Root Cause Analysis” Dashboard functionality is available on the user session and related objects widgets.
Updated Metric Config to drive the latest Scoreboard content:
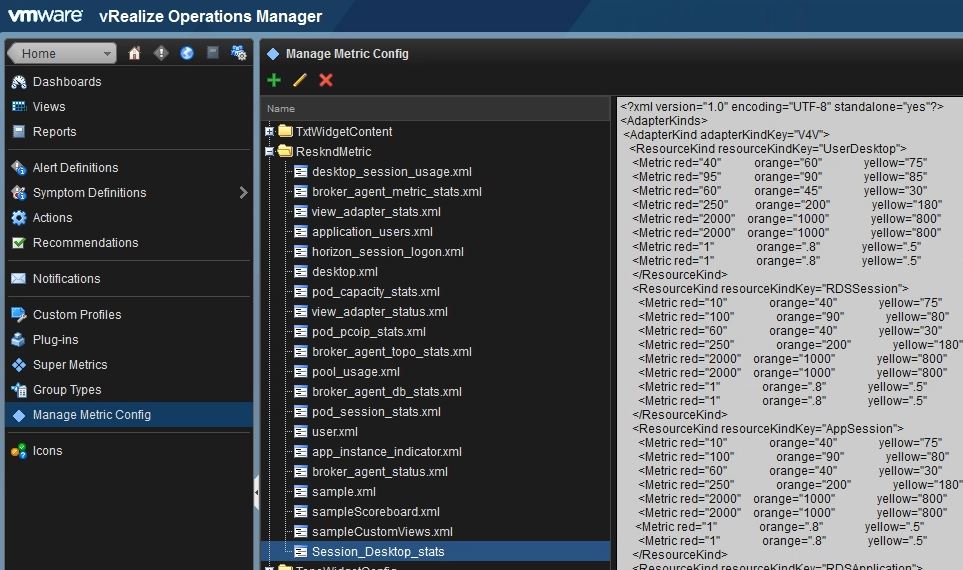
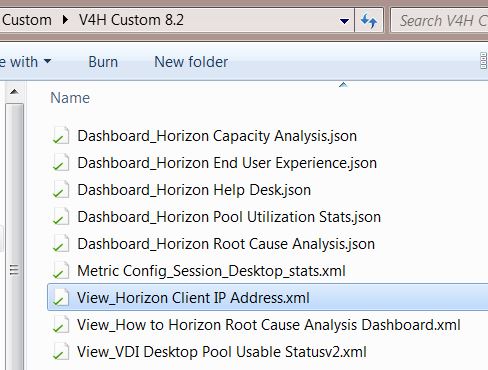
To leverage the latest Scoreboard content to see Blast Session metrics, a new metric config labeled “Session_Desktop_stats_v2.xml” is included in the latest content pack. All three dashboards included in the content pack leverage this metric config file to highlight and display key offending metrics for ease of troubleshooting. To add the new metric config, navigate to Content -> Manage Metric Config, click add new and use the exact name of “Session_Desktop_stats_v2.xml”. Then copy and paste the content of the included metric config, and click Save.
If the dashboard fails to load the content correctly, click the edit icon on the Scoreboard widgets and make sure they are pointing to the correct file name created above.
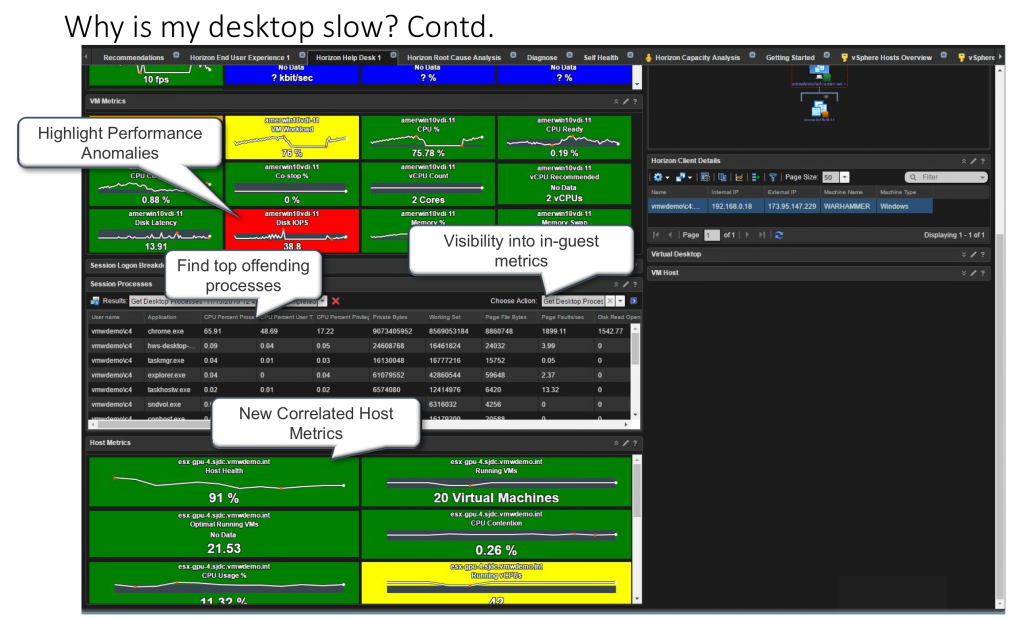
To reduce the number of clicks required for administration and add additional visibility to end-user environmental issues, a new Host Metrics scoreboard has also been added to the Help Desk dashboard. The scoreboard will show best practice metrics in green, and any metrics of concern or interest will change color (yellow, orange, red) depending on the latest reported value.
New Session Alert:
In addition to the new dashboard content, Blast and PCoIP session metrics have been added to a new single alert named “Session Protocol Performance Degraded”. This replaces the existing PCoIP Performance Degraded degraded alert. This will need to be imported under the Content -> Alerts menu.
New How To Widgets available on each dashboard:
Each dashboard now contains a “How to use…” widget that provides a brief description how to quickly operationalize the dashboards. The widgets leverage a URL link back to this website to display the latest instructions on how to use each dashboard. If the widget doesn’t display the text correctly, make sure that the URL referenced in the edit widget screen is resolvable.
**Note that most of this content will be available out-of-box in the vROPs for Horizon 6.4 release due Dec 2016. Additional custom content will only be available from this website.
Click to Download latest vROPs for Horizon Content 8.3 **download removed
