vROPs 7.5-V4H 6.6 Updated Dashboards
Horizon End-to-End Analysis
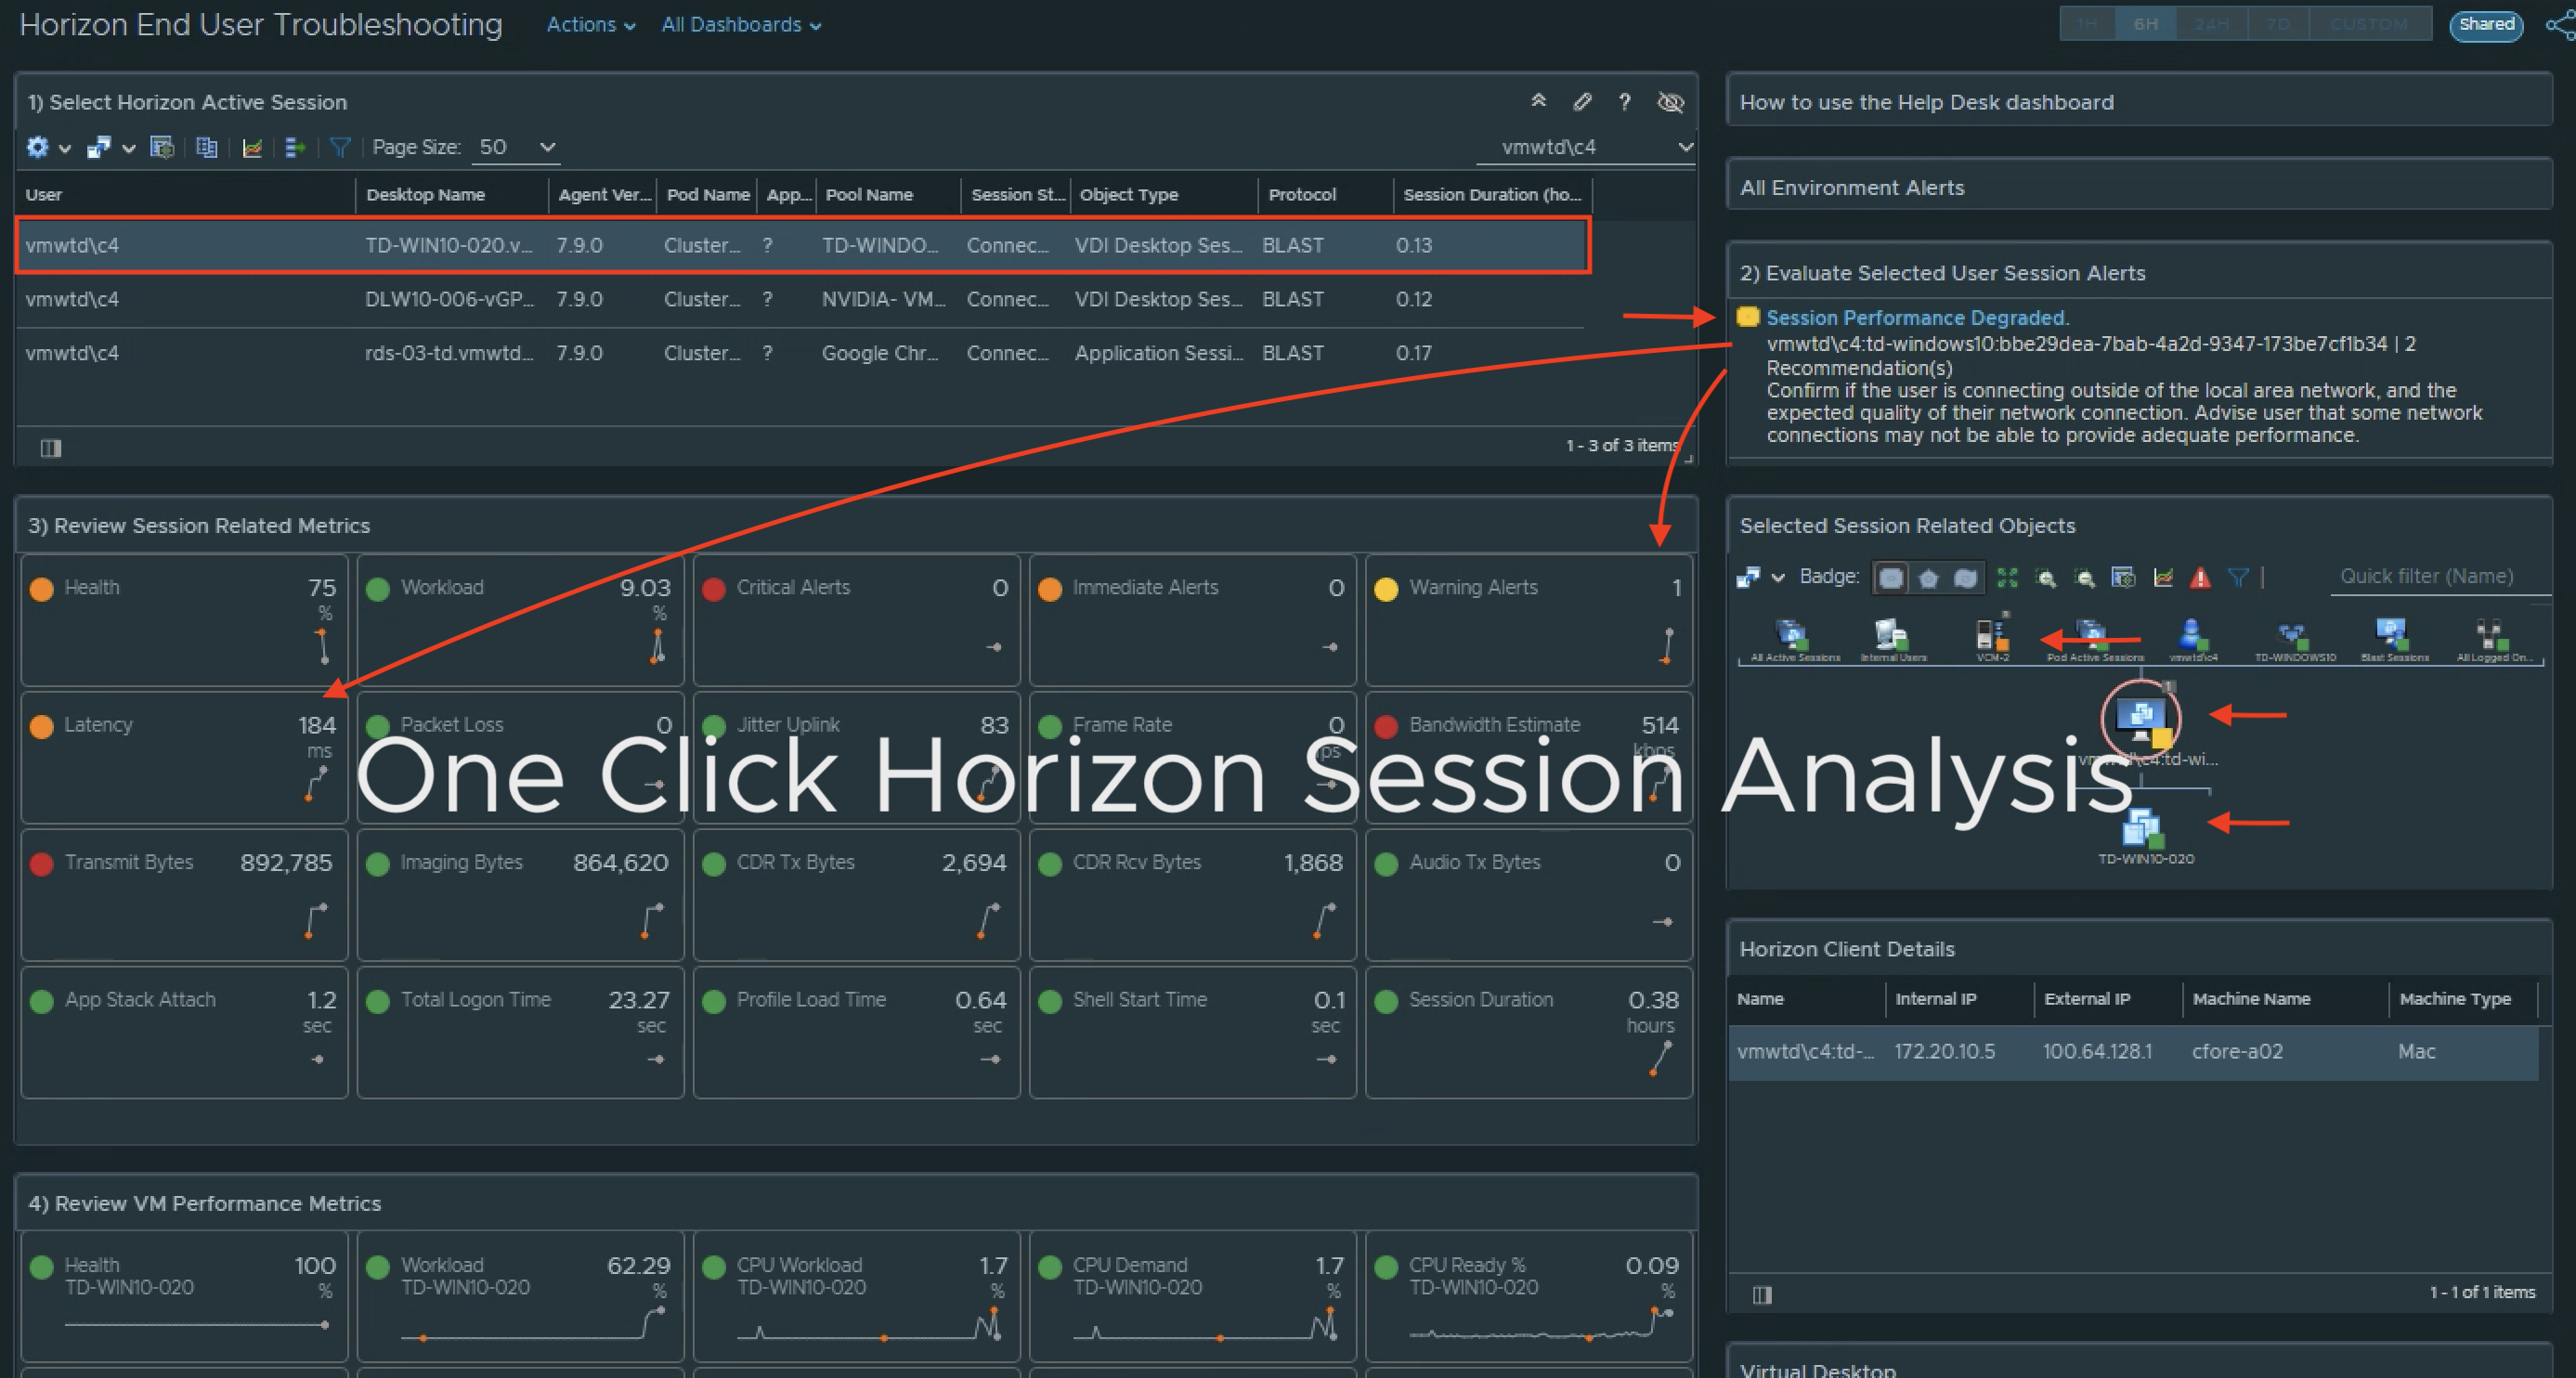
Horizon End User Troubleshooting
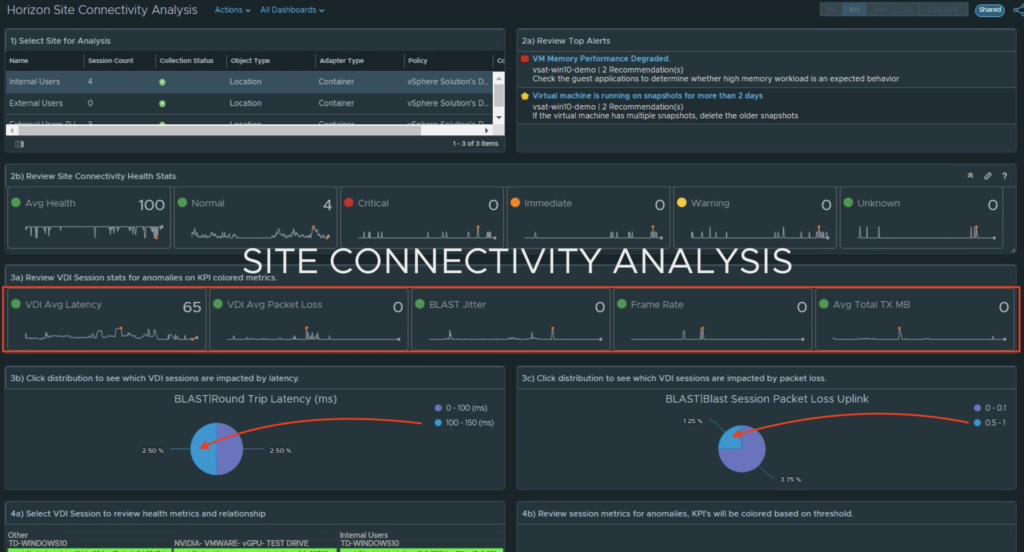
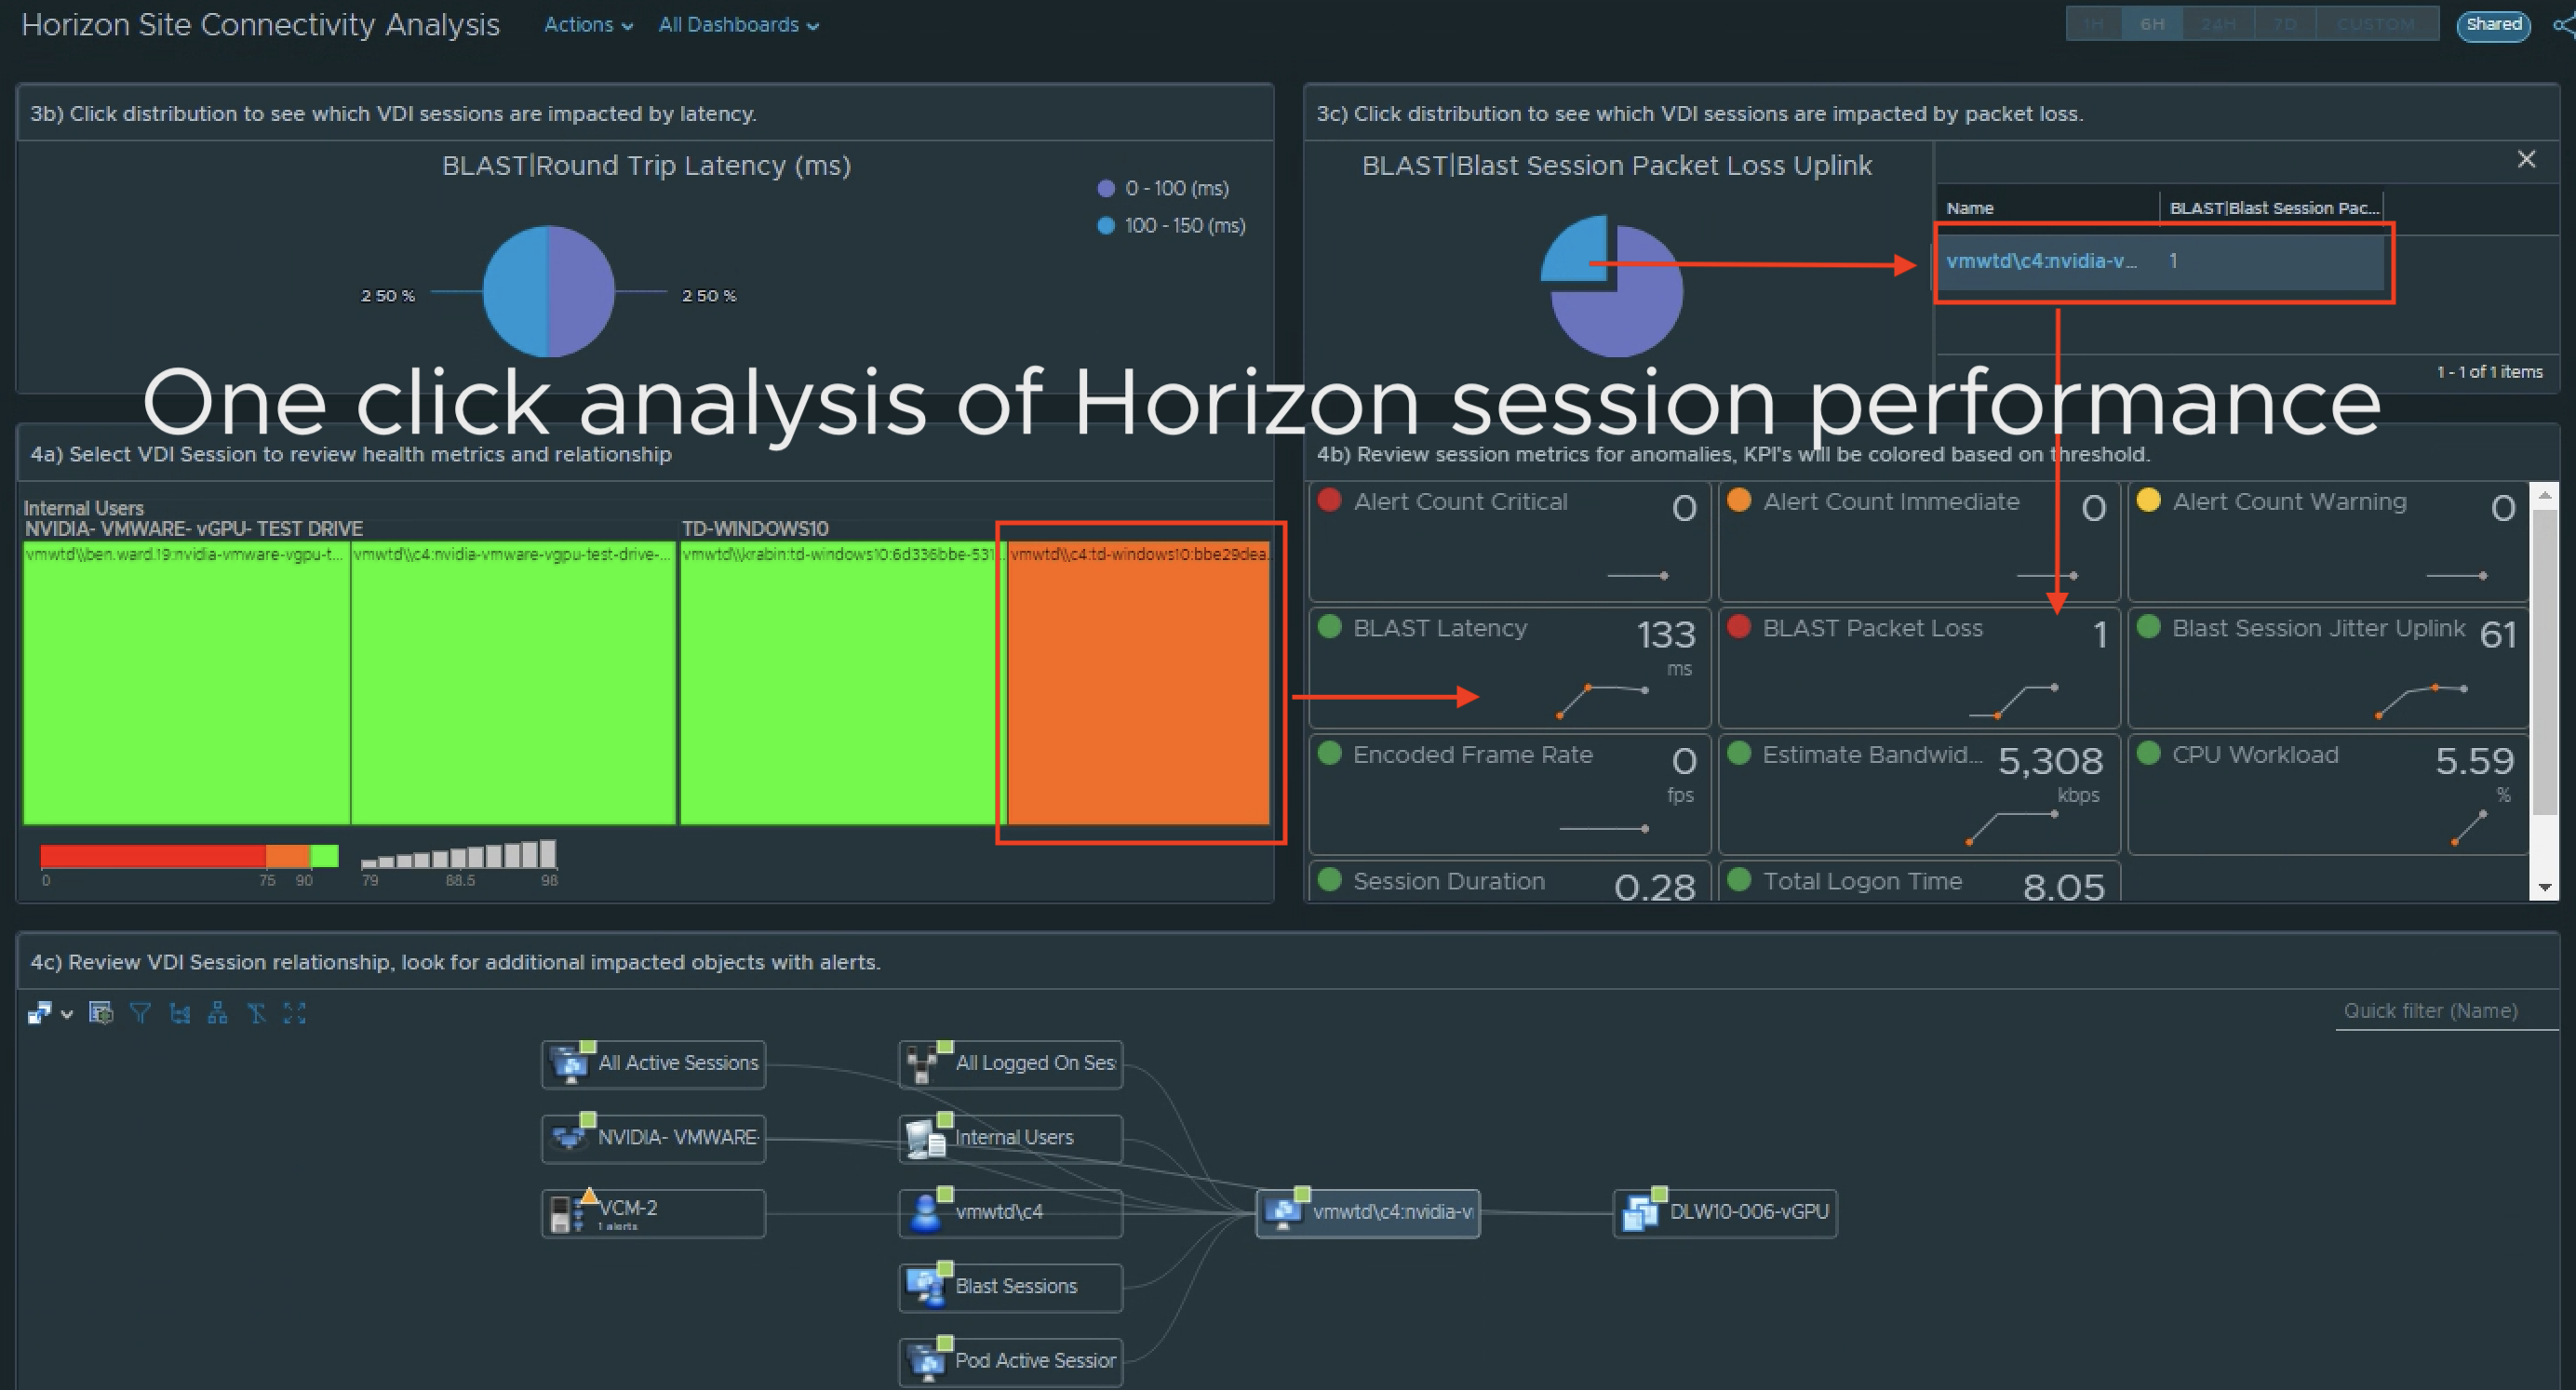
Horizon Site Connectivity Analysis
Location analysis using vROPs for Horizon

As the number of user sites or locations increases, having good visibility into the overall quality of connectivity of those sites to your Horizon View data center(s) becomes increasingly important. Having worked with many customers on troubleshooting connectivity between such locations, it has become clear that monitoring only at the physical network layer is not sufficient to properly diagnose user connectivity issues impacting the display protocol. In fact, in most cases, it’s the configuration of the physical layer that causes the issue(s), and the device(s) in question do not have the ability to diagnose or detect their impact to the display protocol.
Alas, all hope is not lost! With vROPs for Horizon, we have the ability to monitor the key metrics related to protocol performance and can alert when those metrics have reached critical thresholds. We can also leverage a handy custom grouping feature to organize the remotely connected sessions into defined sites or locations, based on information available in the user’s session data. We can then leverage Super Metrics to calculate the overall health of the group of connected sessions from that site, and then display and alert when the health has dropped below our SLA thresholds.
Sound like something you want to take on? Then read on!
First things first… 1️⃣

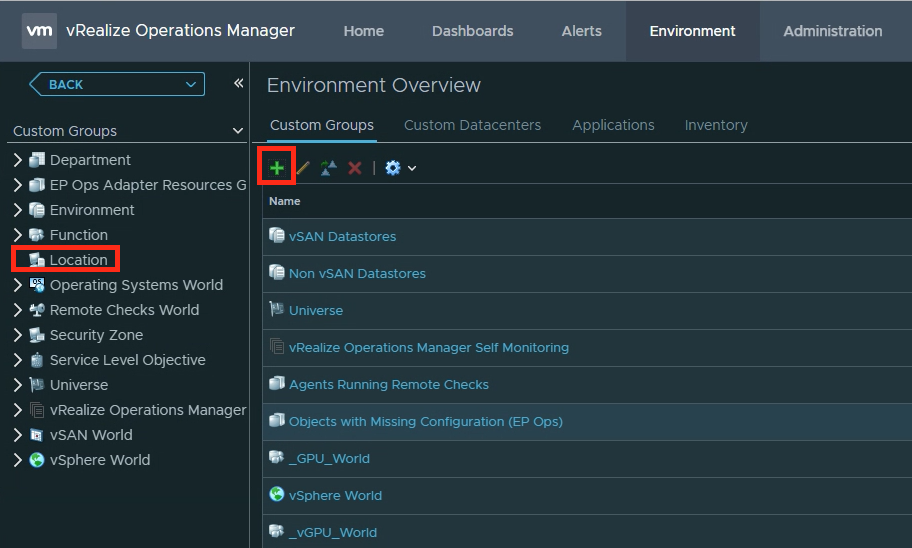
We need a strategy to capture and organize how we determine which connections are from which site. The most common approach is to leverage the known internal subnet IP range for that site, and set that as the primary filter for the custom group. However, additional metrics supplied by the user’s session data can be leveraged as well.
In this example, I will create a new Site labeled “External Users”, under the “Location” group, and filter on all users who have an internal subnet IP containing “192.”.
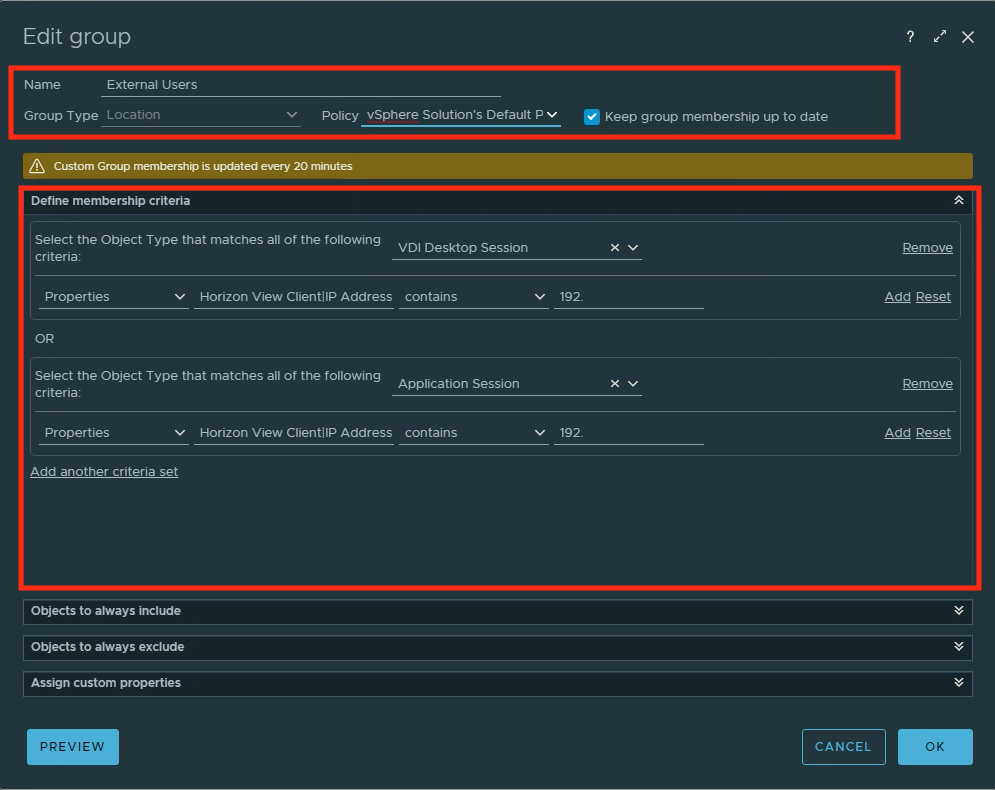
Note: It may take some time before the group starts to populate the sessions, and as noted in the image above, population updates are every 20 minutes.
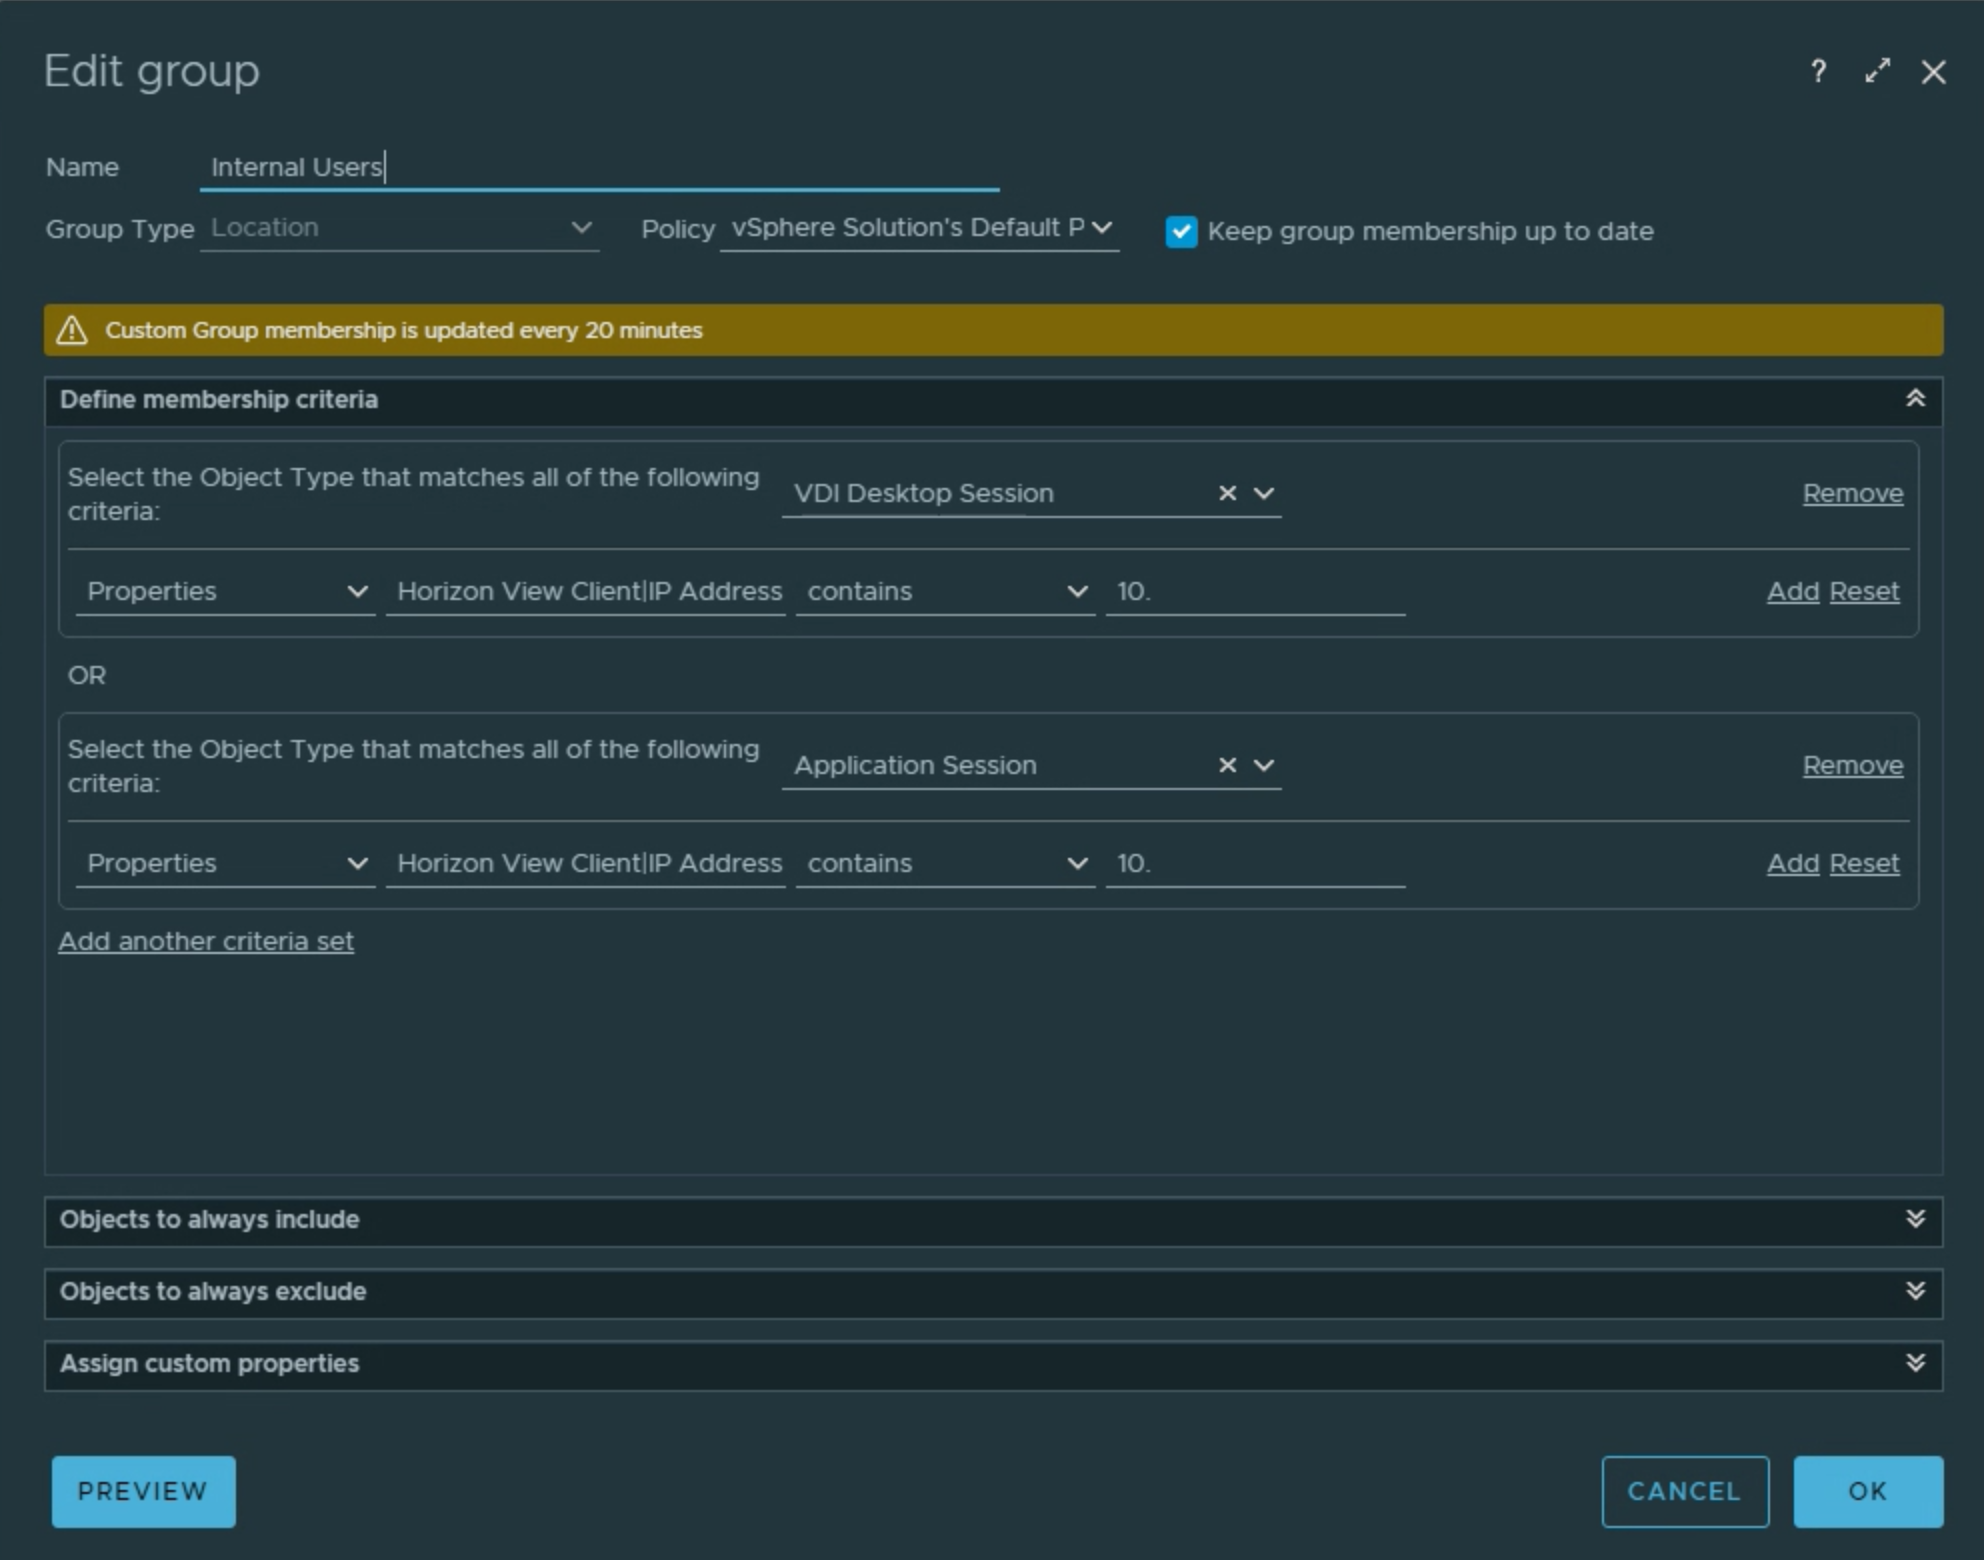
You will also want to create at least one more additional site for comparison purposes. In the example below, I have created an “Internal Users” site that filters on 10.x networks to separate the session traffic.
Second is just after first… as long as we’re counting up! 👆

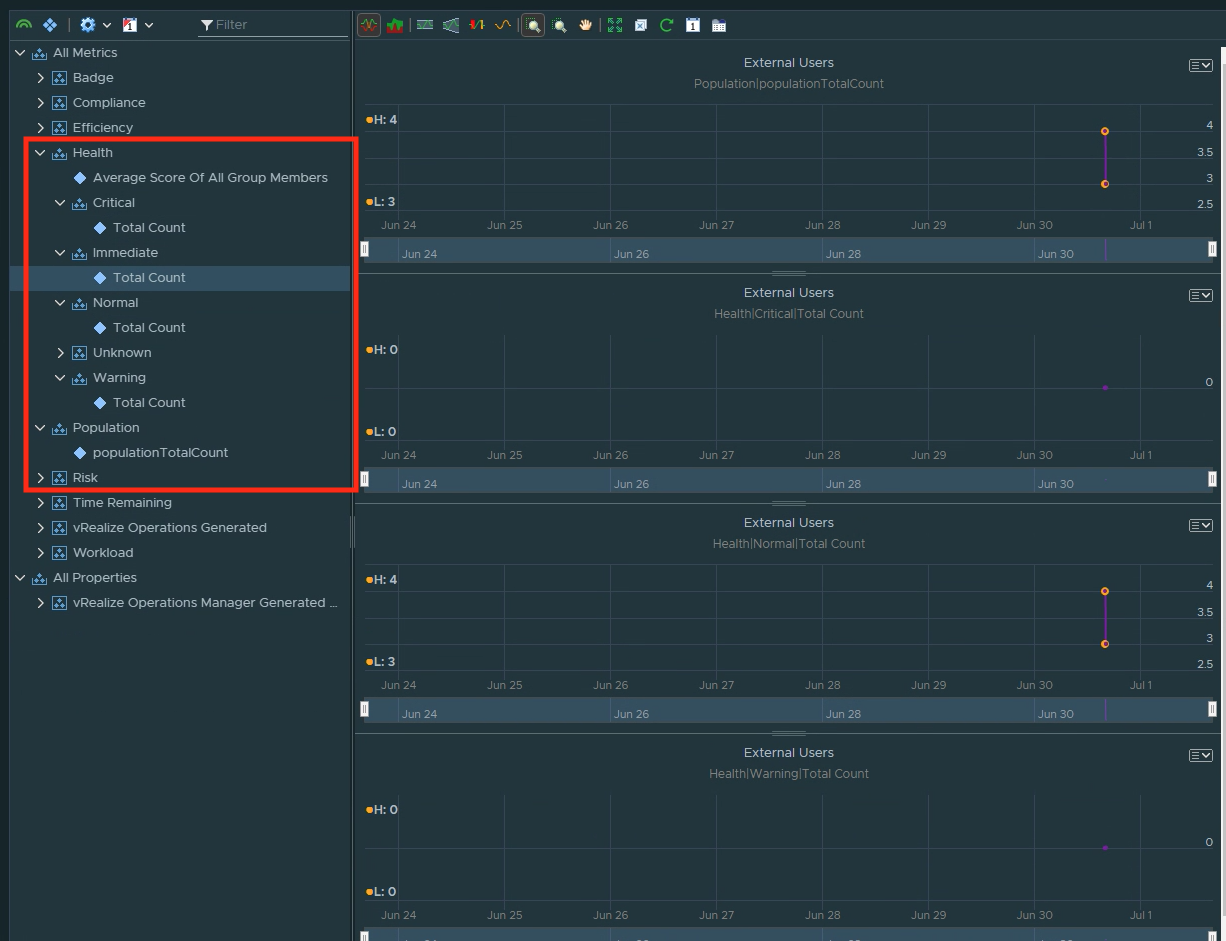
Once your group has started to populate with sessions, it’s time to create meaningful Super Metrics on the group that will give us insight into how well that site is connected.
By default, vROPs 7.5+ will create population TotalCount and Health Criticality Total Count metrics. These will be useful in leveraging out-of-box KPI based alerts that track how well users are connected to the Horizon Environment and let us know the distribution of good to bad connected sessions from that site.
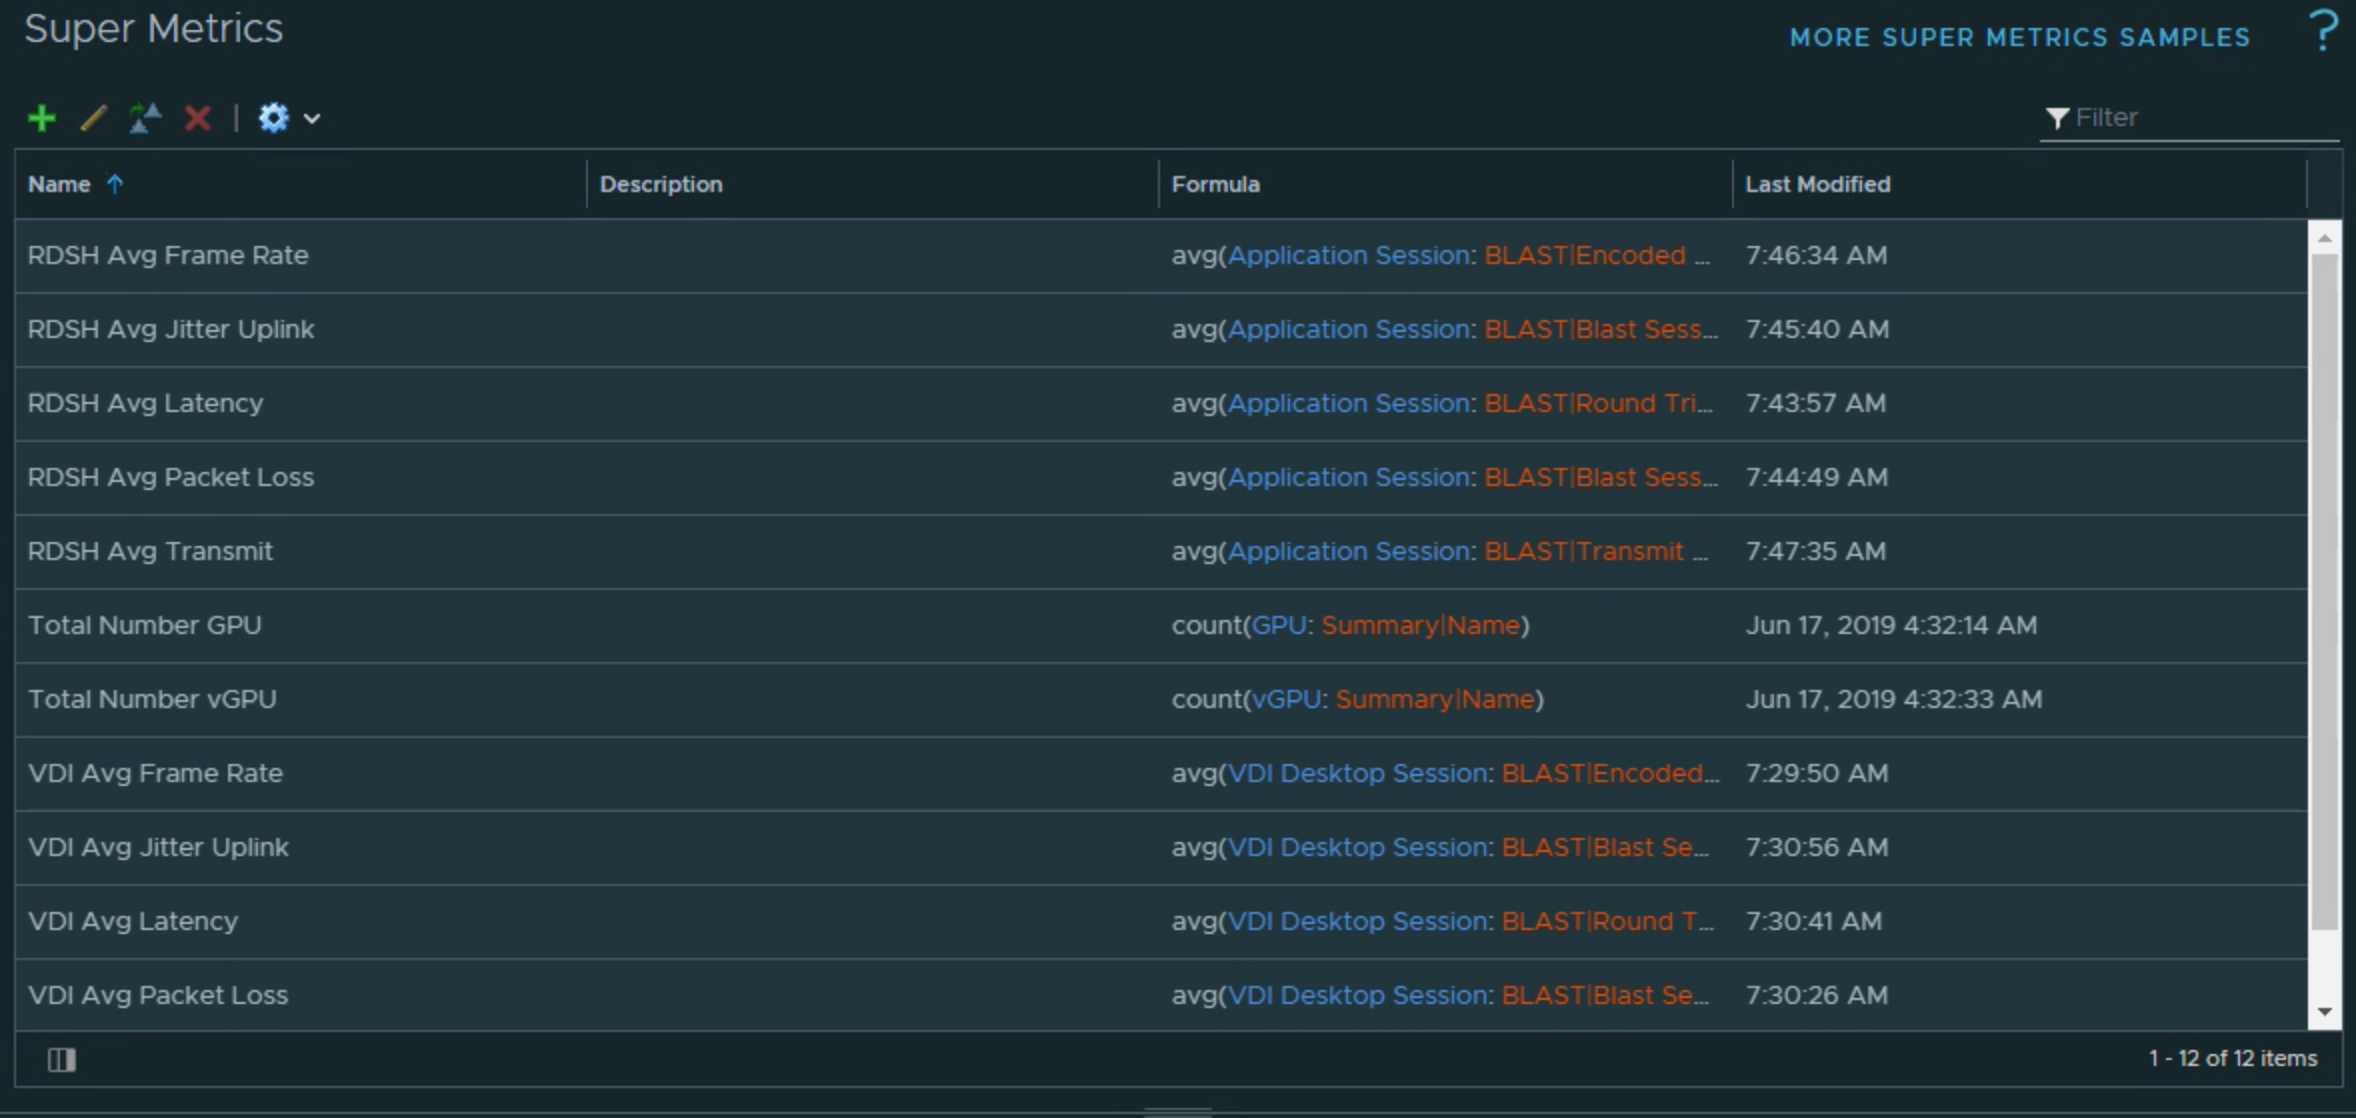
Leveraging Super Metrics, it’s time to create additional site tracking metrics that include, but are not limited to, average site Latency, Packet Loss, Jitter, Frame Rate, and Transmitted Bytes.
Thirdly Rinse and Repeat… ♻️

Continue to create the Super Metrics for the additional session metrics that you want to collect. As in our example below, you will need to do this for both the VDI and Application Sessions individually to capture the metrics from both types of sessions.
Now… what to do with all this stuff? 🤔

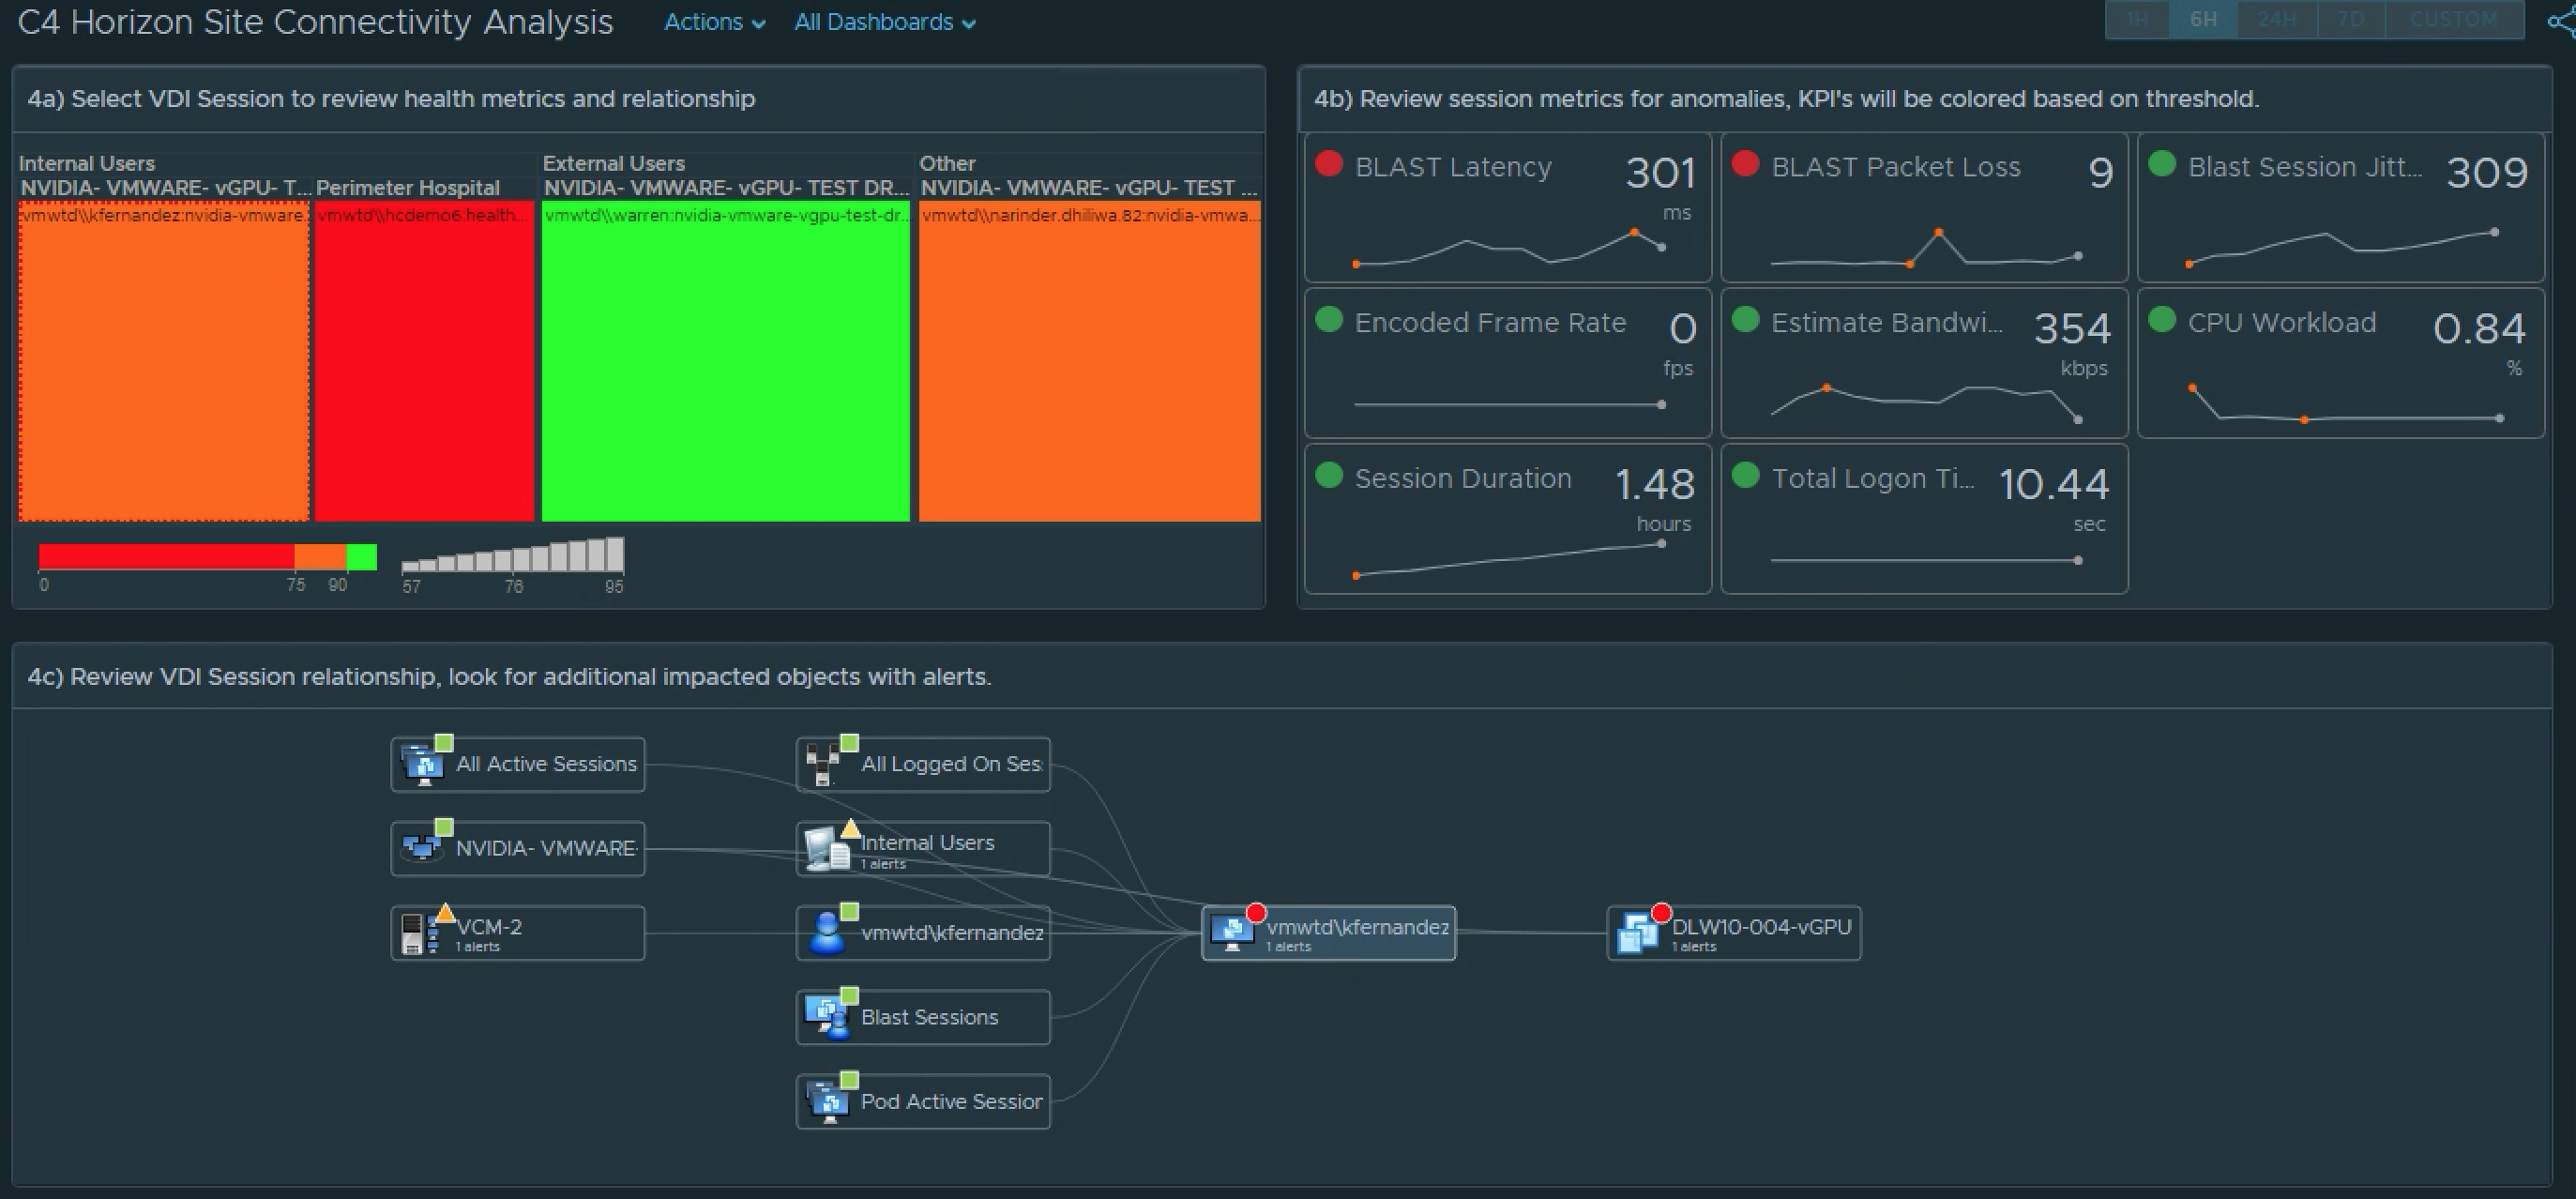
Now that we have meaningful Super Metrics on our custom group, it’s time to display that data in a way that it makes it easier to diagnose specific site connectivity issues, and compare that site against other sites that are connecting to our Horizon environment.
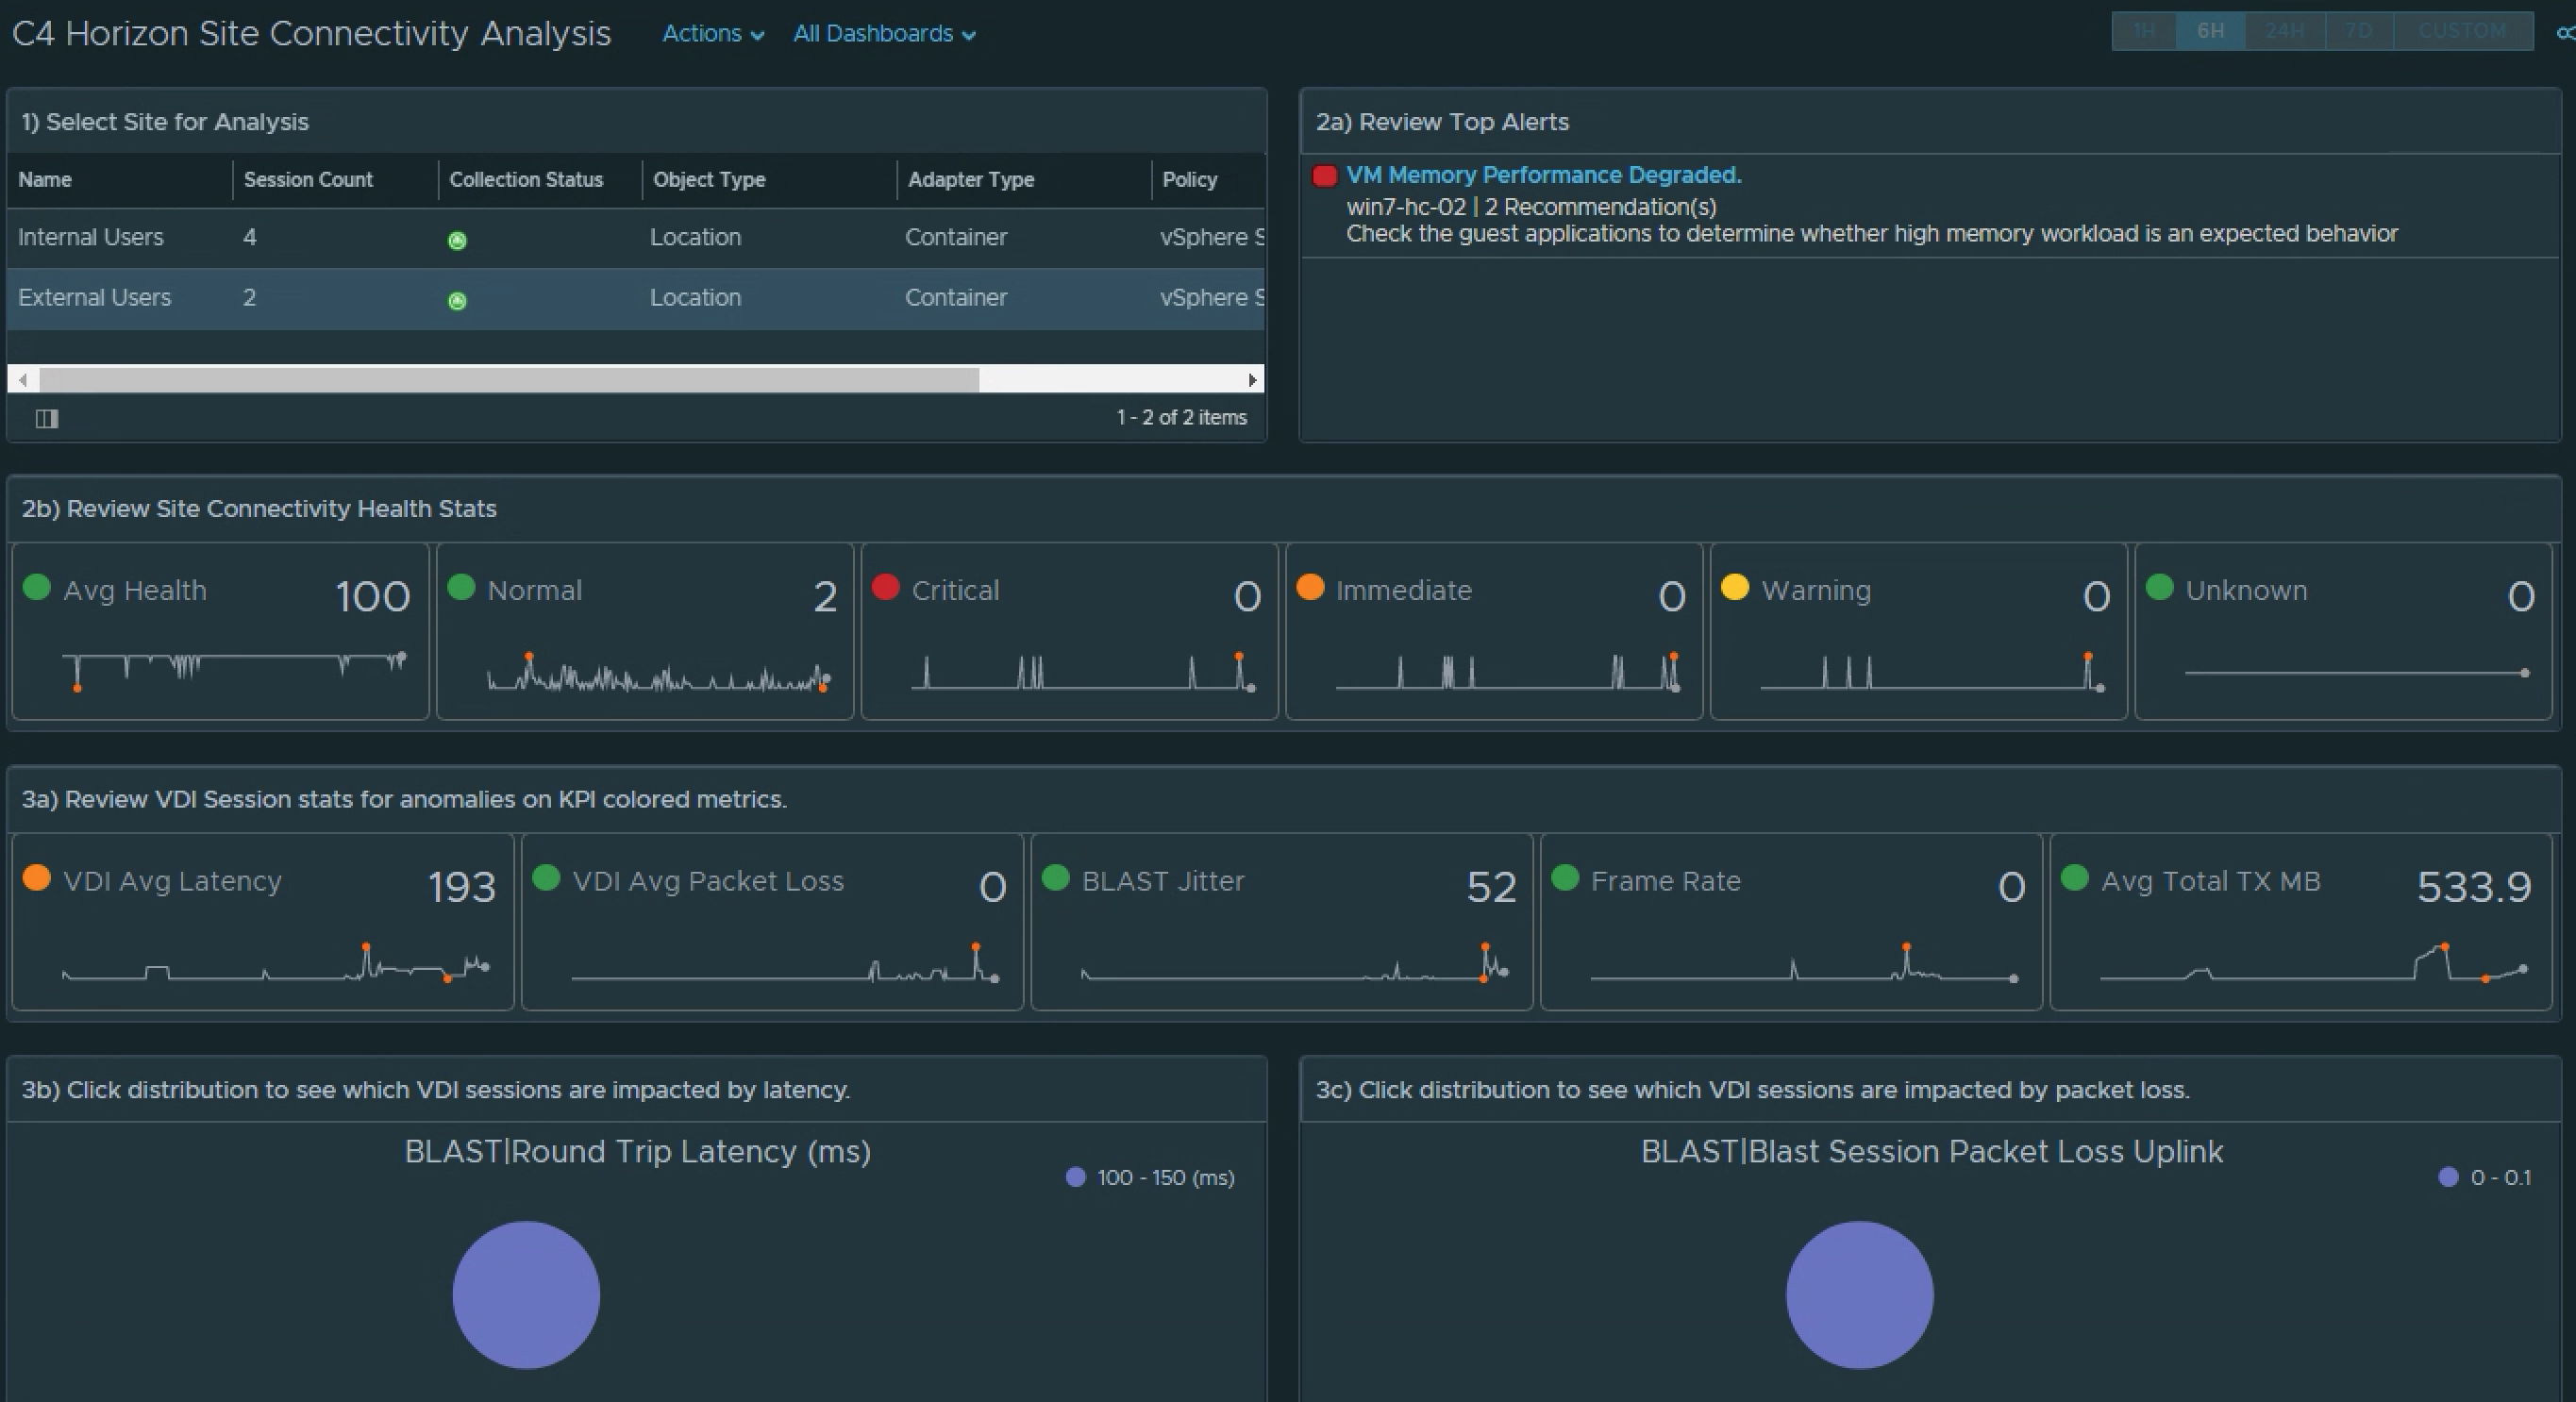
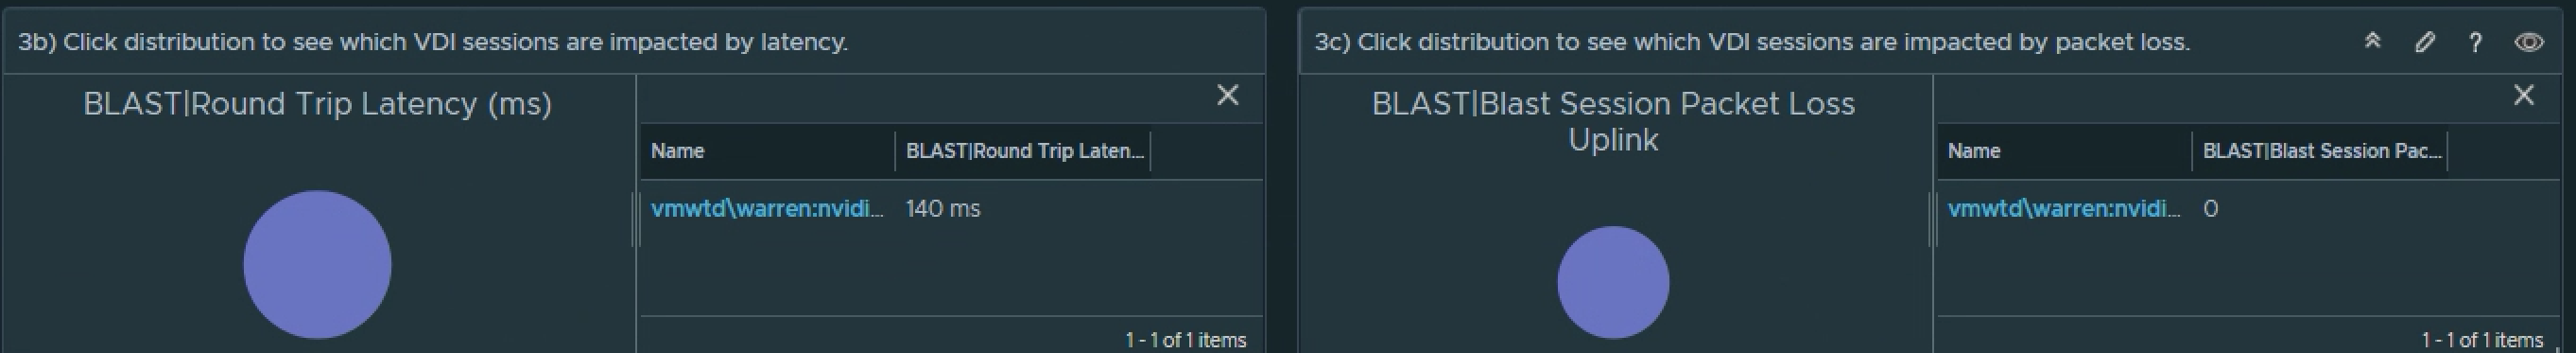
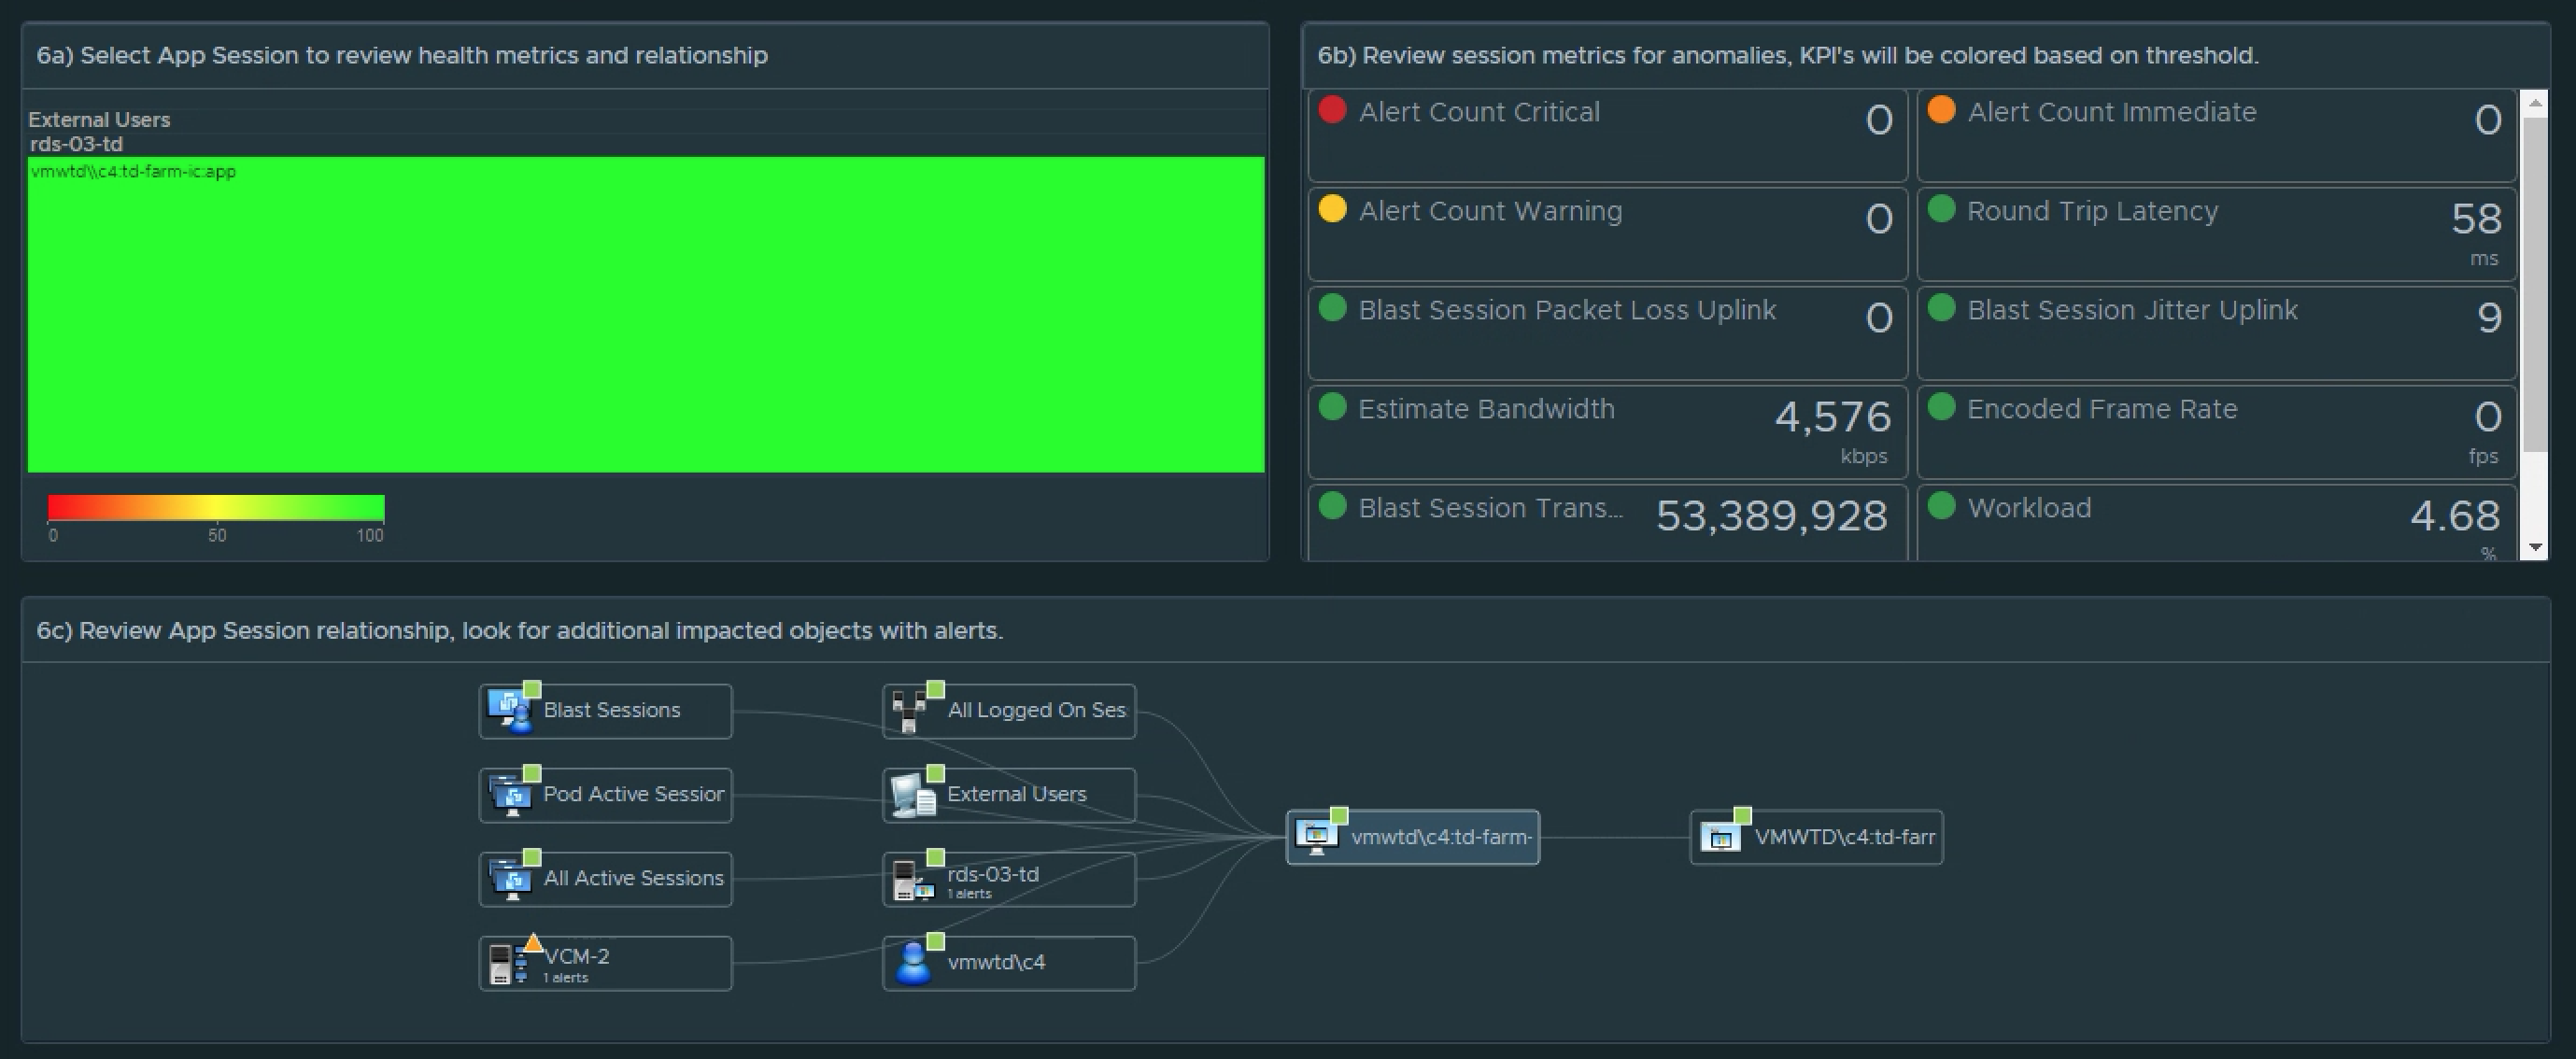
To do so, I’ve created a custom example Dashboard that allows you to select from the list of defined sites, and then display the relevant Alerts and Super Metrics that we defined on those sites. While you can choose to display the data in any manner you see fit, I’ve chosen to use a combination of Scoreboard, Distribution, and Heatmap widgets.
I’ve also chosen to label the widgets using an ordered numbering system with directions so that other users leveraging the dashboard will know how it’s meant to be consumed.

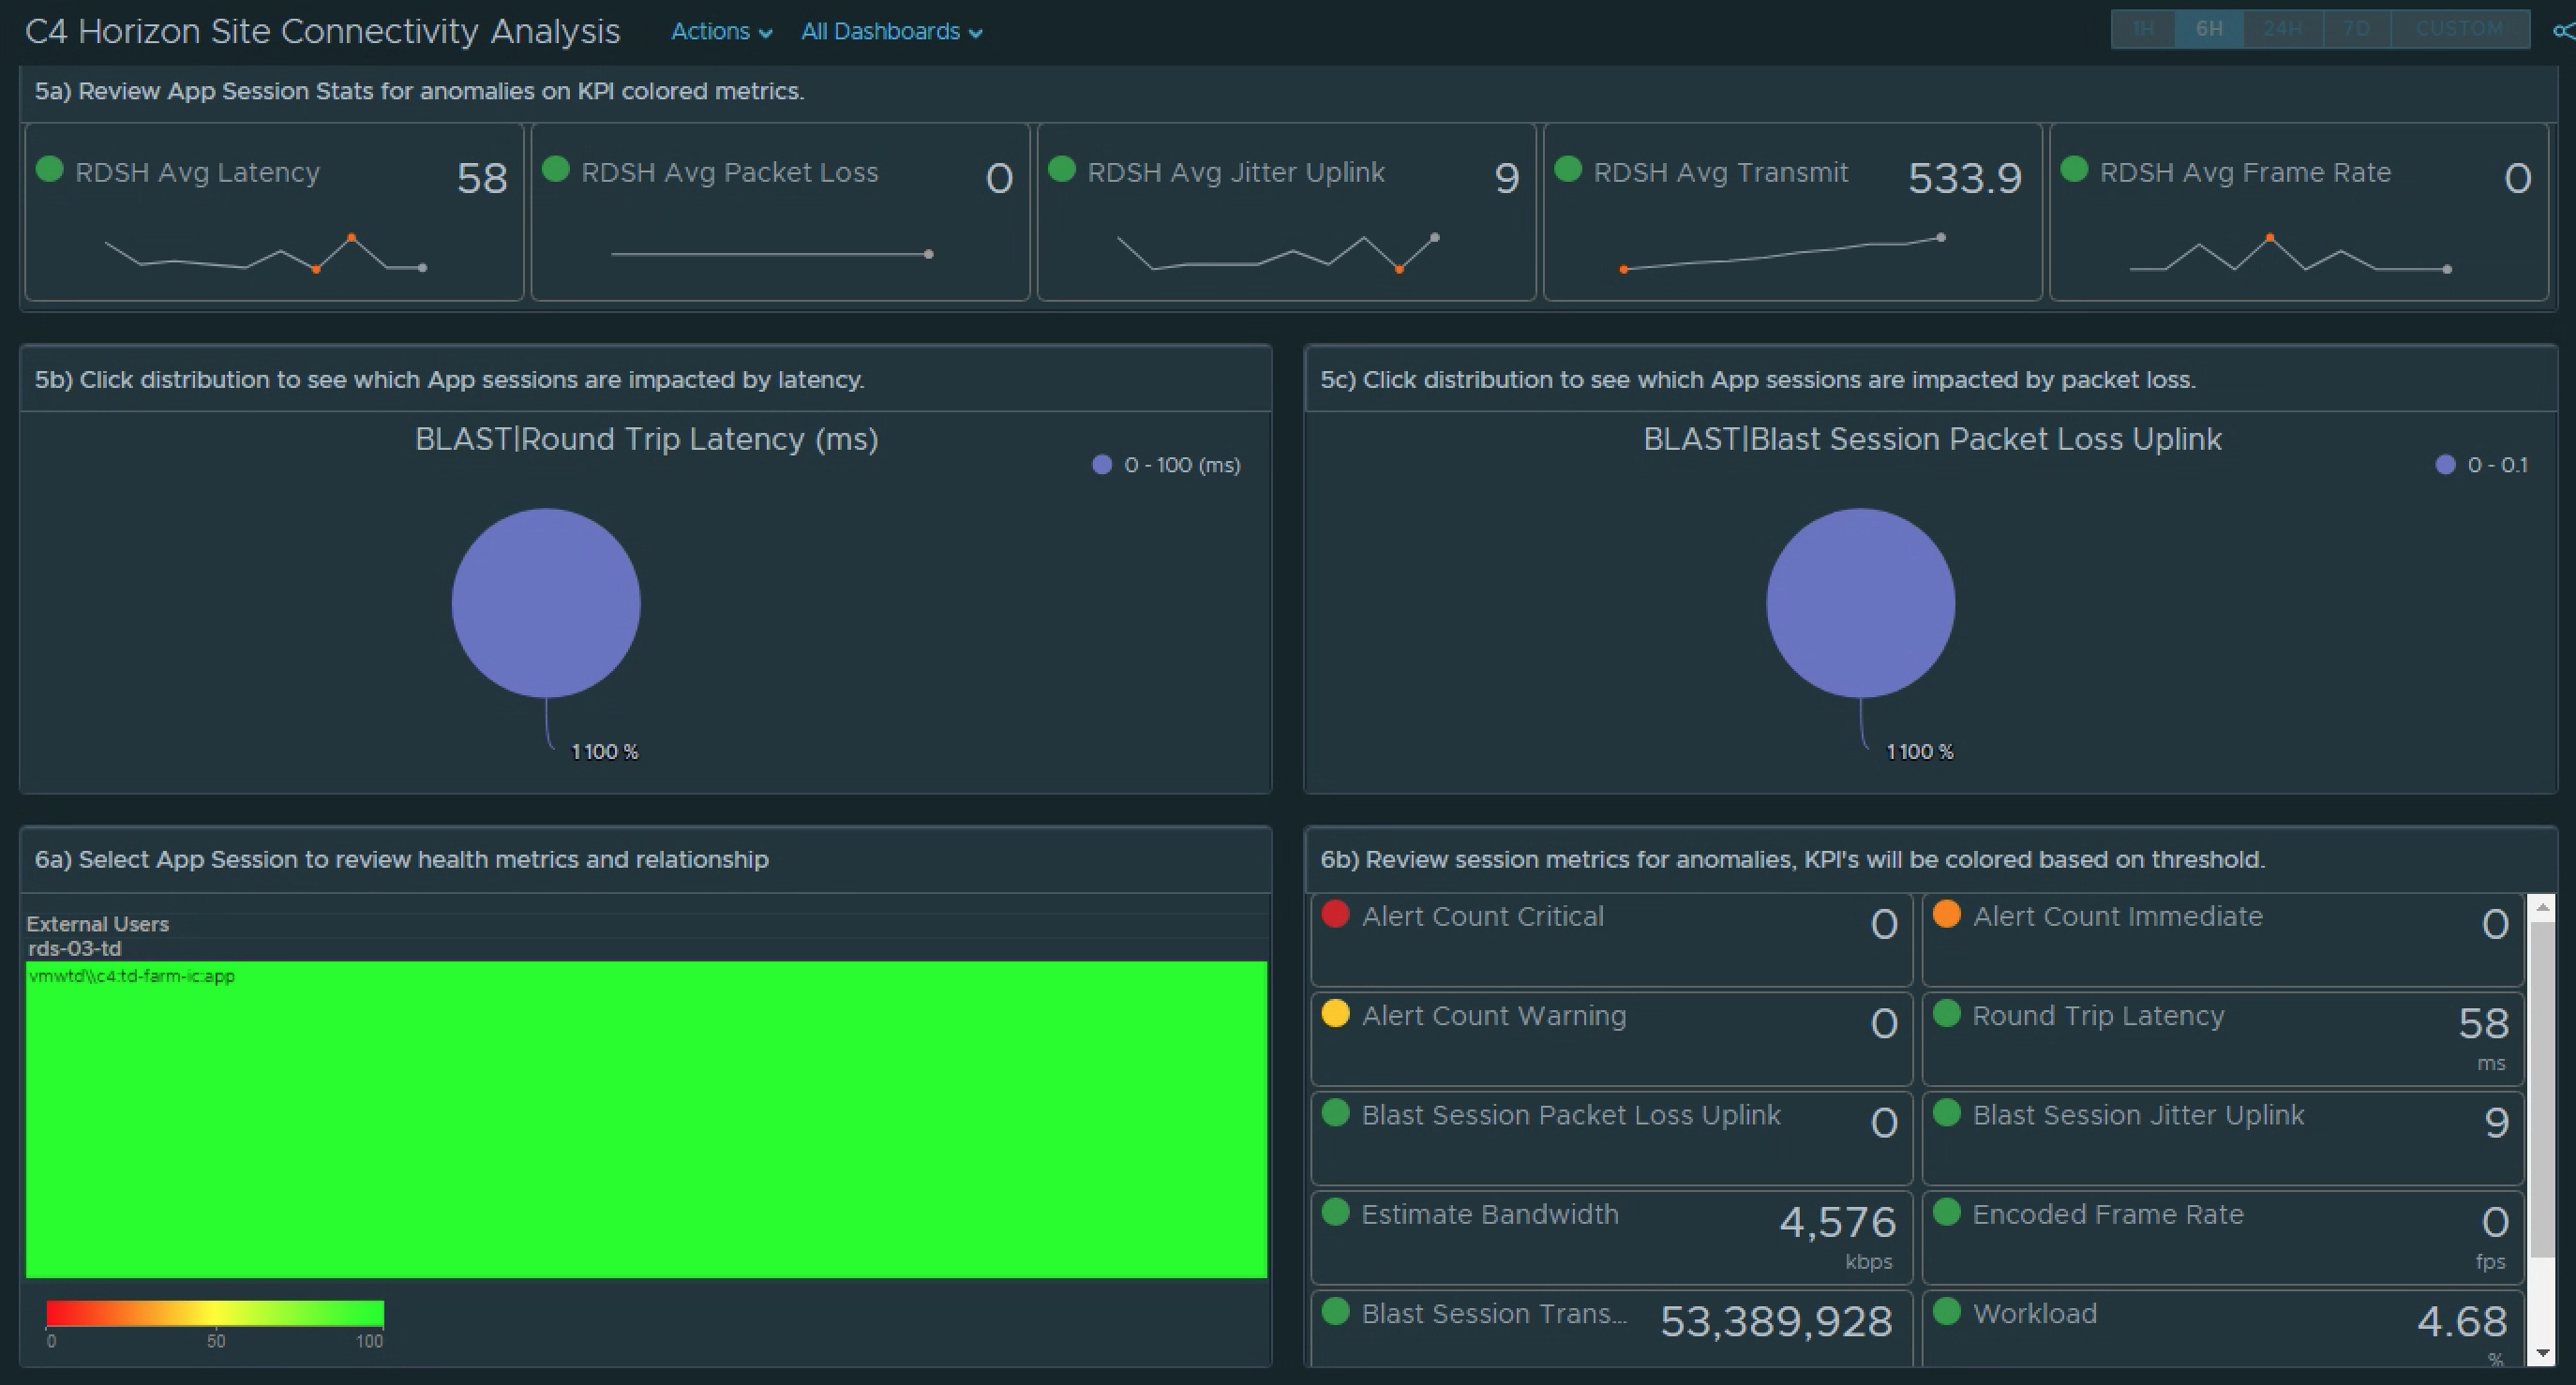
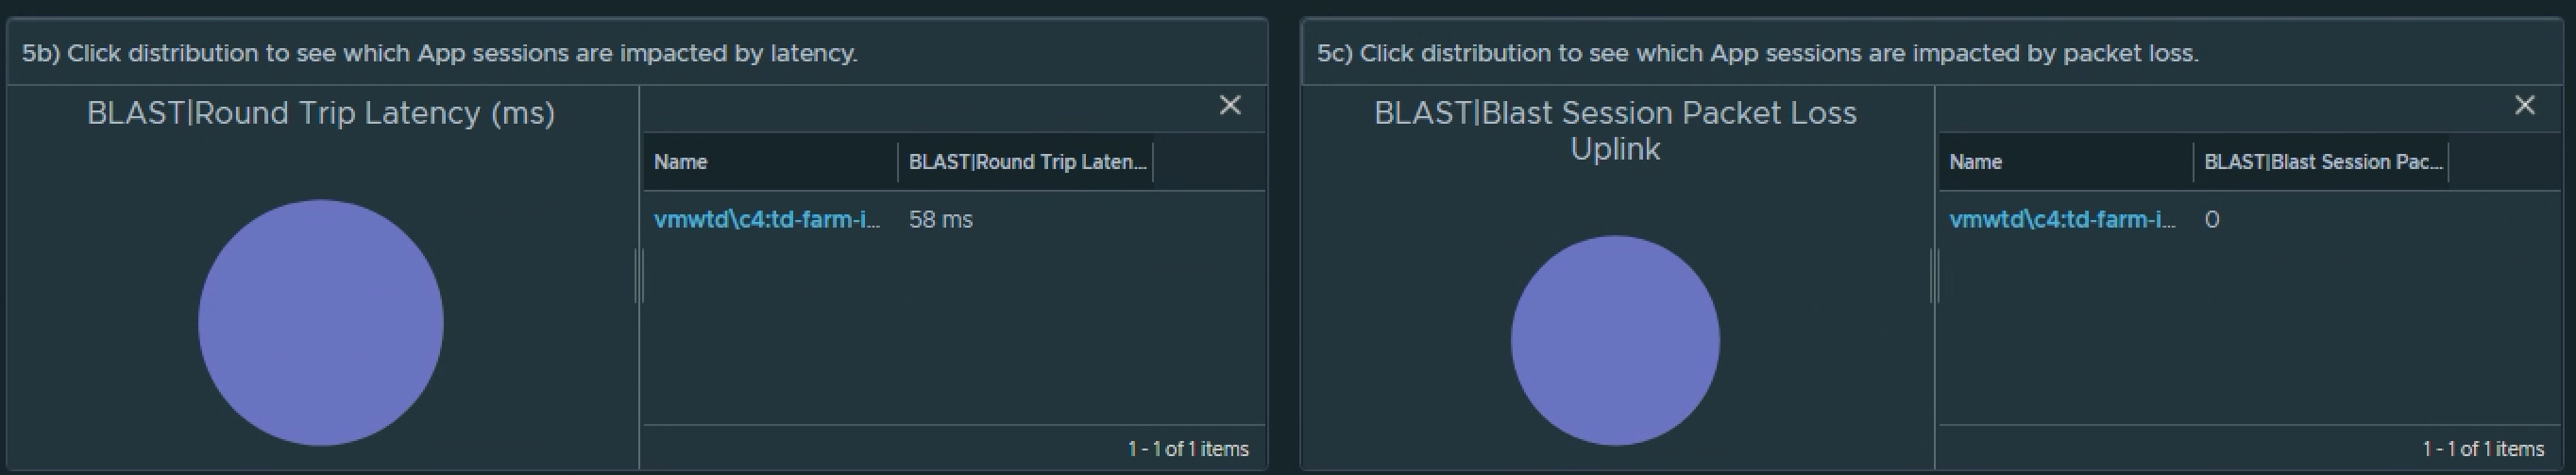
Continue your analysis of the Application Sessions if relevant for your site. The workflow will be the same as the above VDI Session analysis.
Next steps… Download and enjoy! 🏁

Now that we’ve discussed how to create the content and the high-level strategy for performing the site connectivity analysis, it’s time to download and import the content . The zip file provided in this blog contains all of the content that is required to create the custom dashboard, except for the step on creating the custom group locations. That step will still be required for you to define what “Sites” you want to monitor for connectivity performance.
Contents of the zip include a Dashboard_Horizon Site Location Analysis.zip, Views_Horizon Site Location Analysis.zip, and Supermetric_Horizon Site Analysis.json. All of which need to be imported and at least one Location group defined before the Dashboard will function properly.
Enjoy! Please provide thoughts or feedback on how to make the dashboard and content better.
How to add Historic User Session Latency to vROPs for Horizon.
VROPs for Horizon provides end-to-end visibility into key User session statistics that make it easy for Horizon admins to visualize and alert on performance problems impacting the user’s of their environment. One of the key metrics used in determining how well user’s are connected to their virtual app or desktop session is Session Latency (ms), as it most visually impacts the user’s perspective of their session performance. The lower the session latency, the quicker video, keyboard, and mouse inputs are redirected to and from a user’s endpoint client, giving the user a more native-like PC experience.
As the latency trends higher (>180ms), the experience begins to degrade, and the user can begin to notice “sluggishness“ – slow keyboard, mouse, and video responsiveness.
VROPs for Horizon gives us direct visibility into when these issues are occurring across all of the Active User Sessions of the Horizon View environment. However, once the session becomes inactive, it will go into a stale object state and be removed from vROPs during a clean-up window.
To be able to view this information historically on Pools and User objects, you can create Super Metrics that simply maps the session latency to the objects you want to report on.
Creating the Super Metric
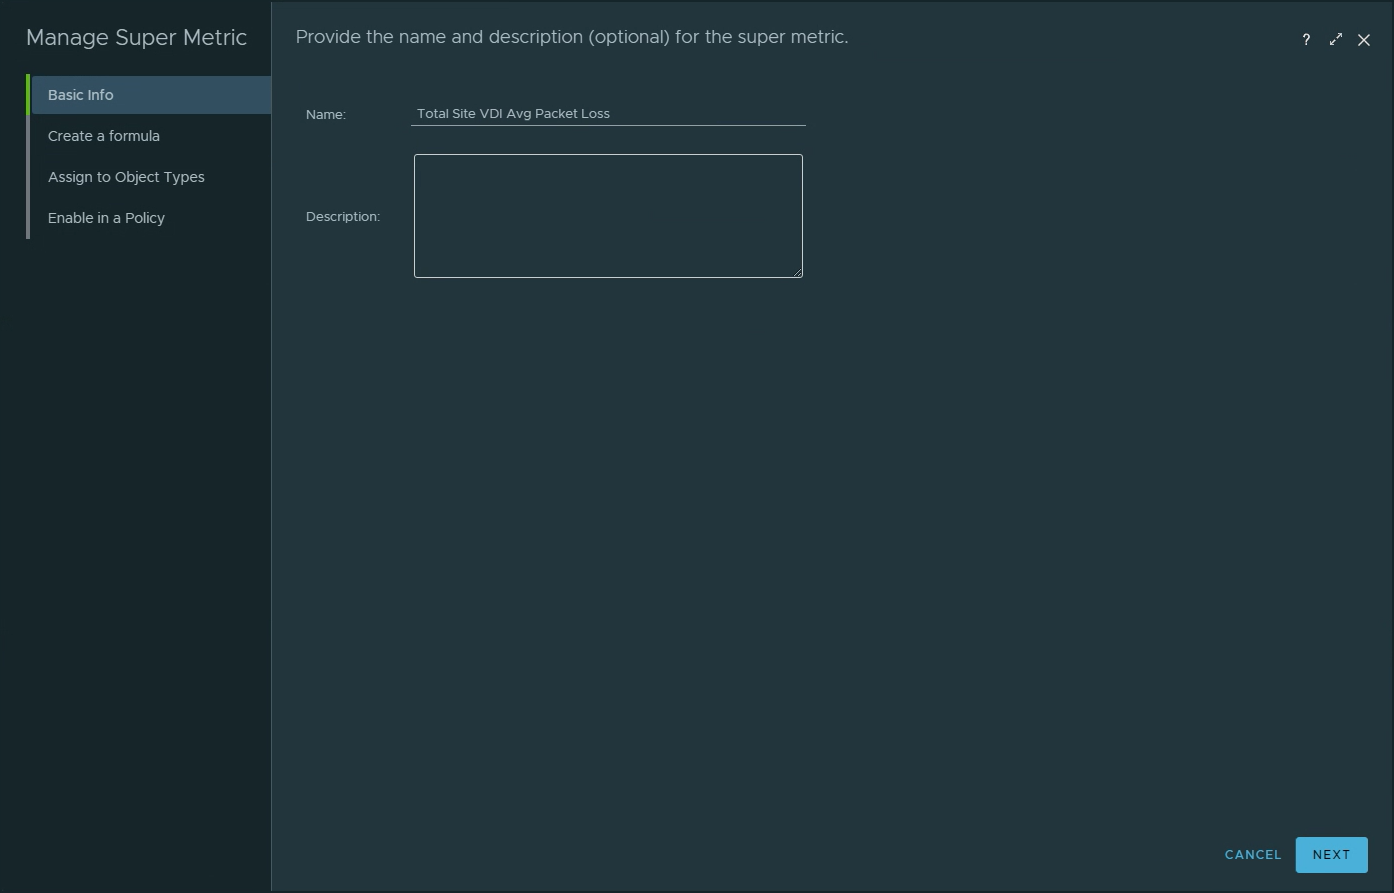
To create the Super Metric, Navigate to Administration -> Configuration -> Super Metrics. Click the green + sign to create a new Super Metric.
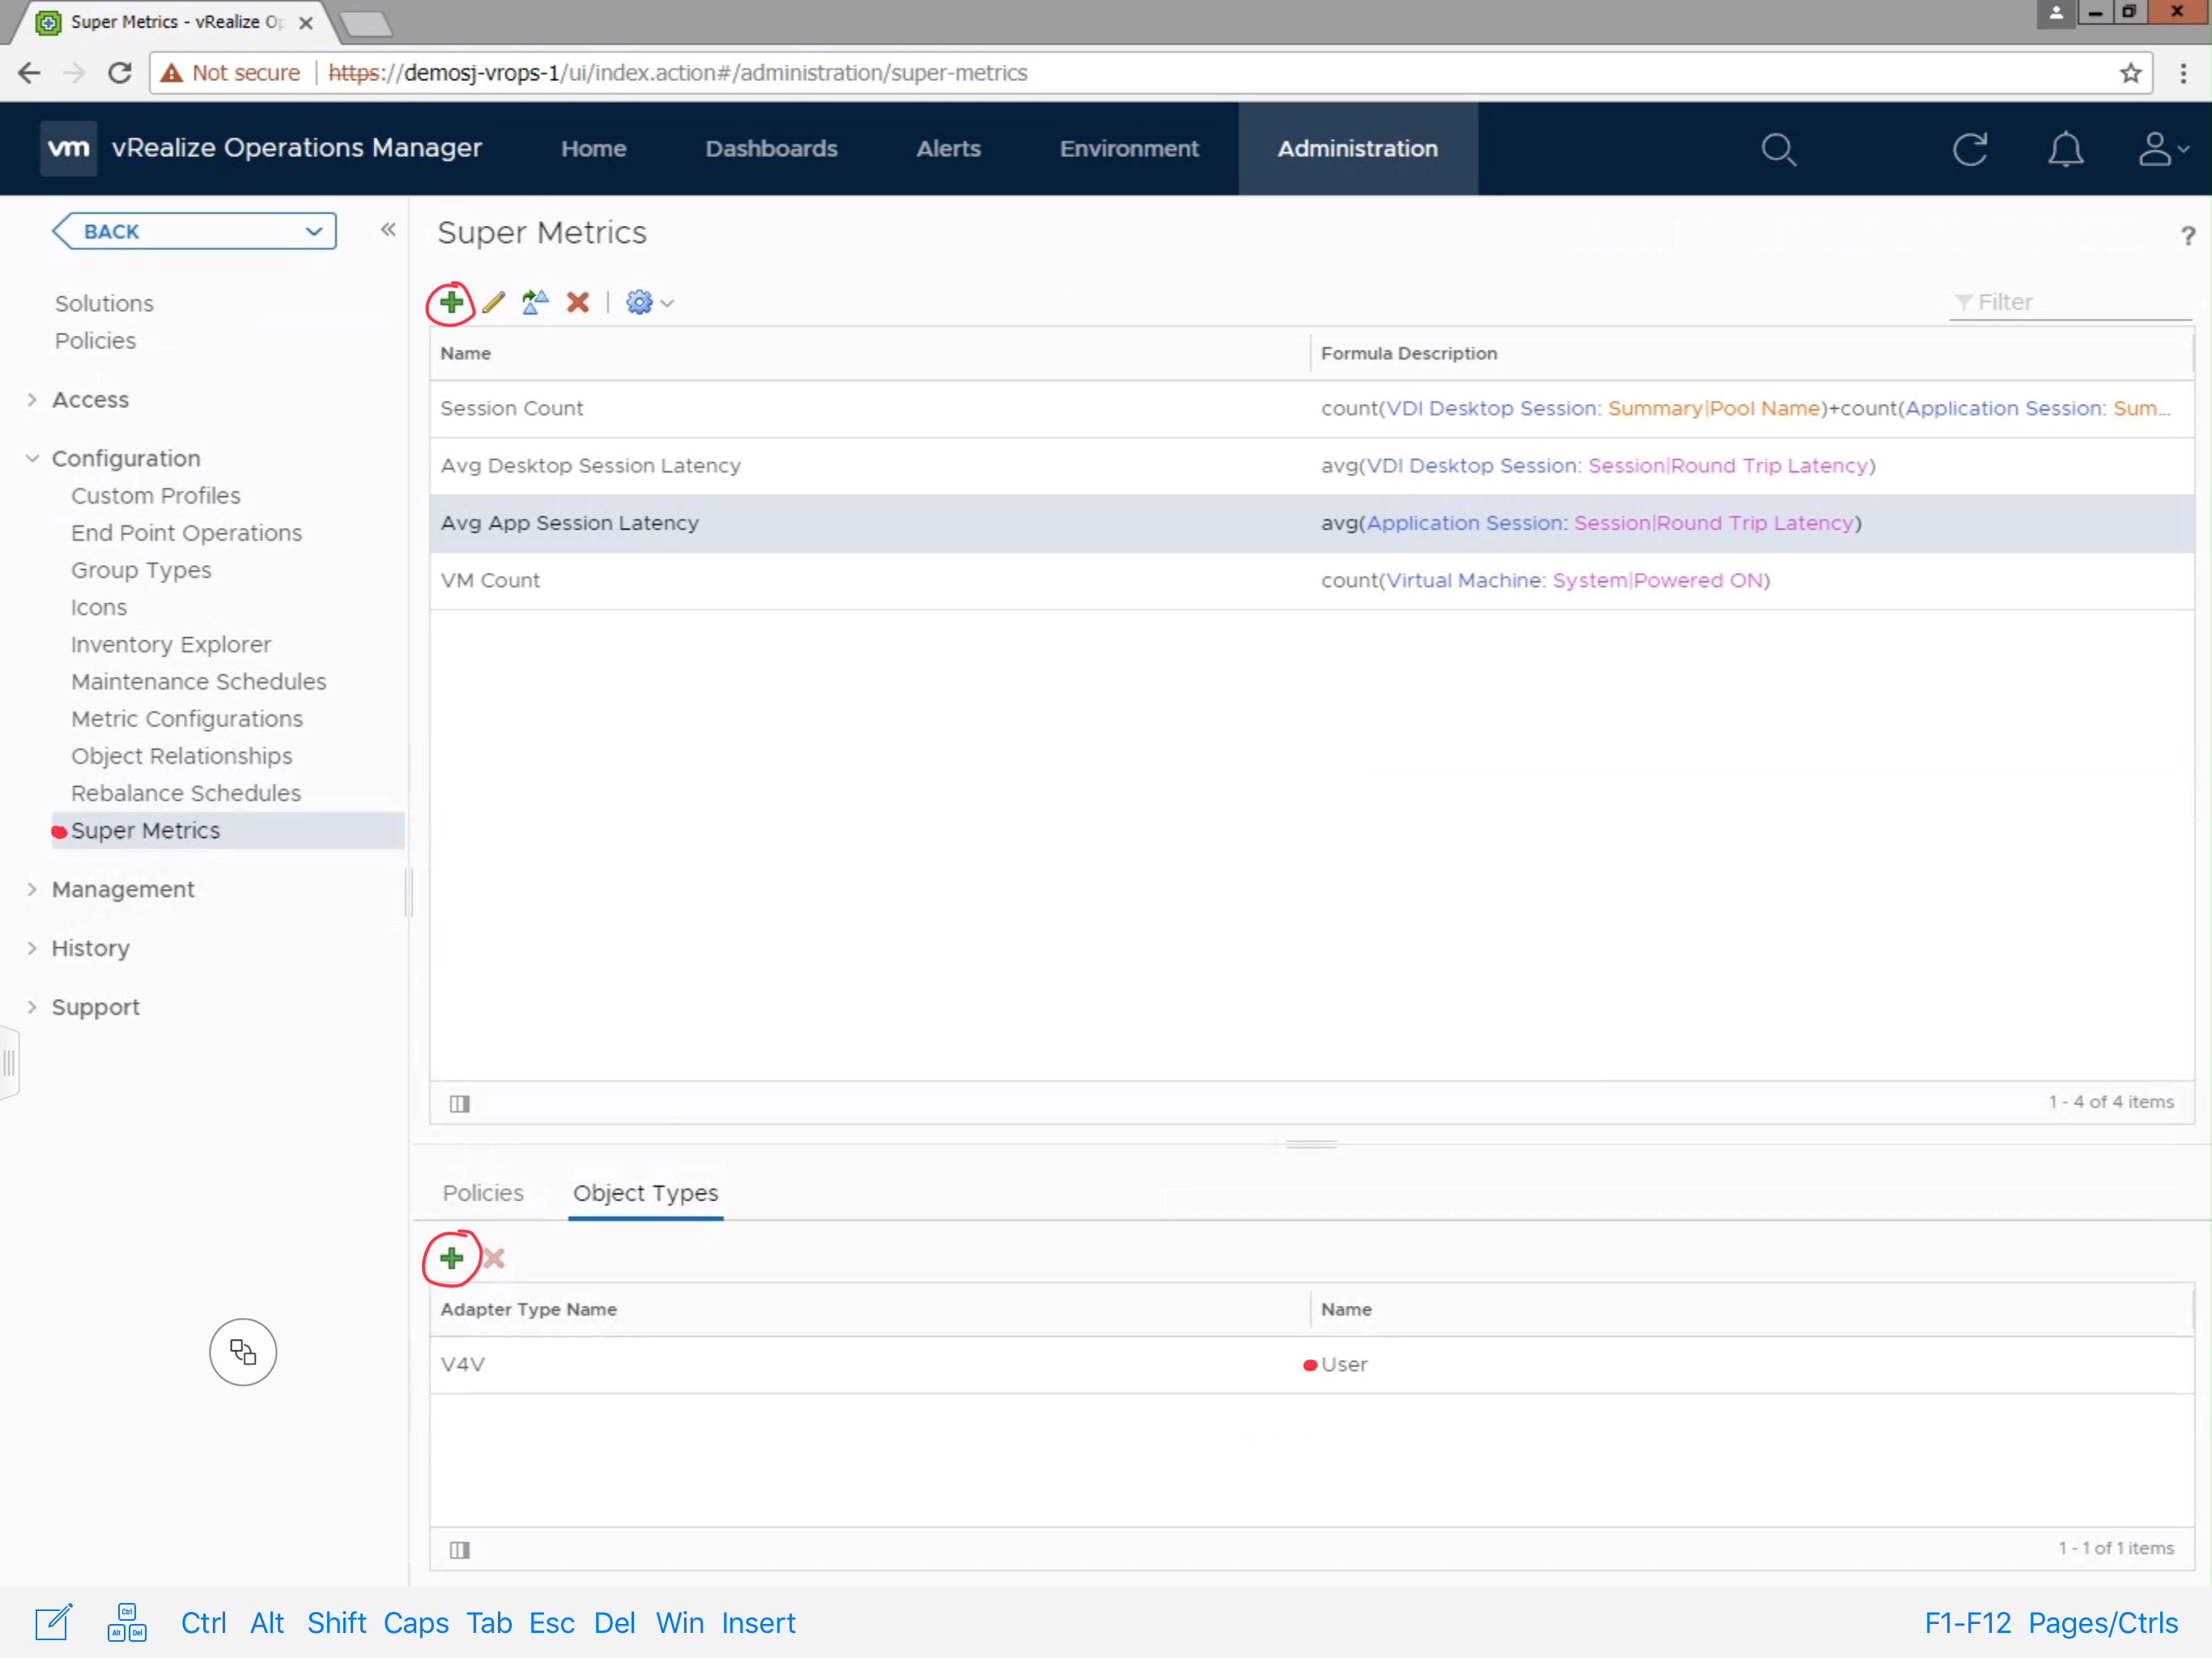
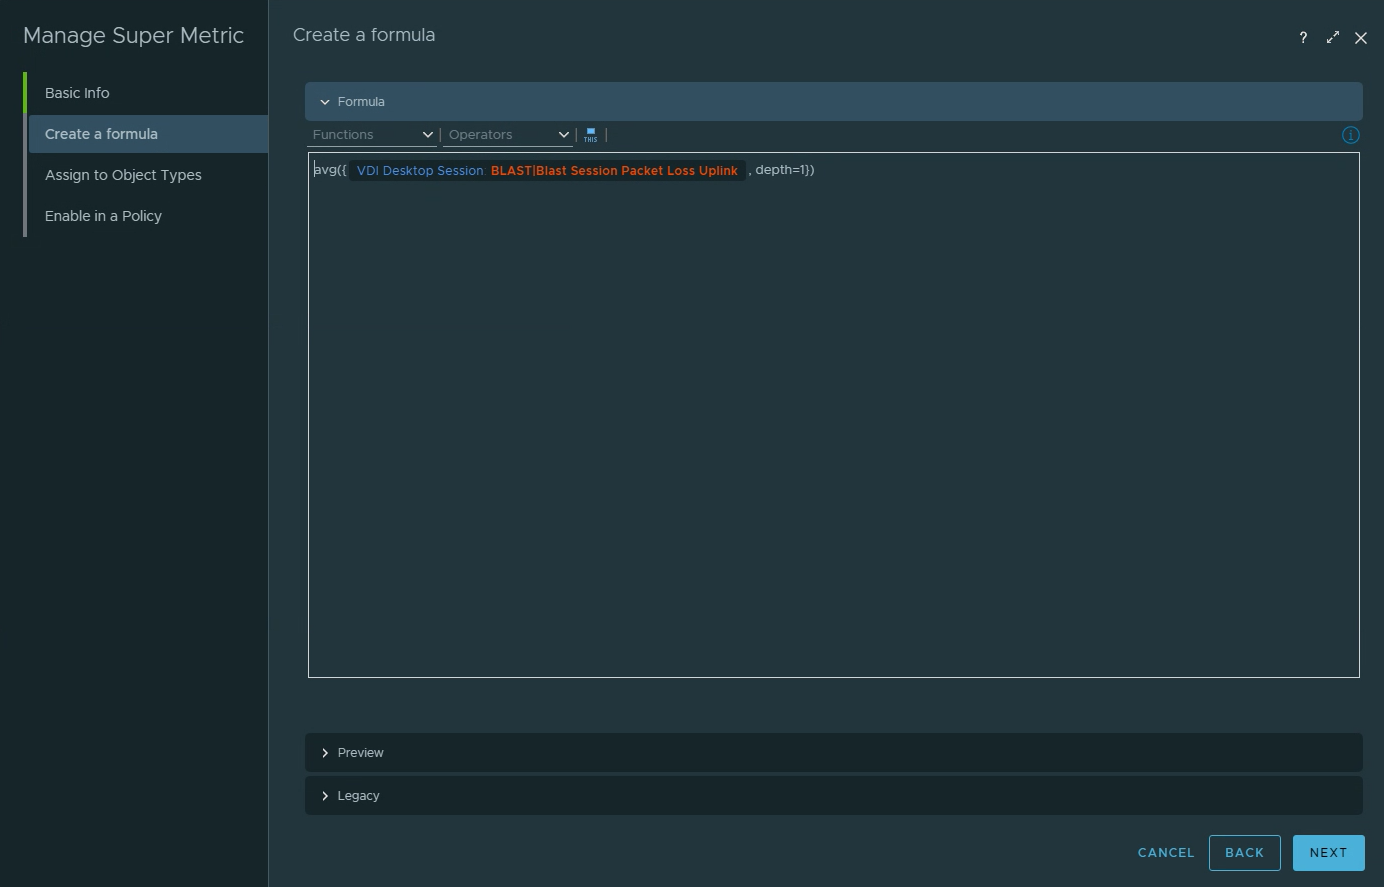
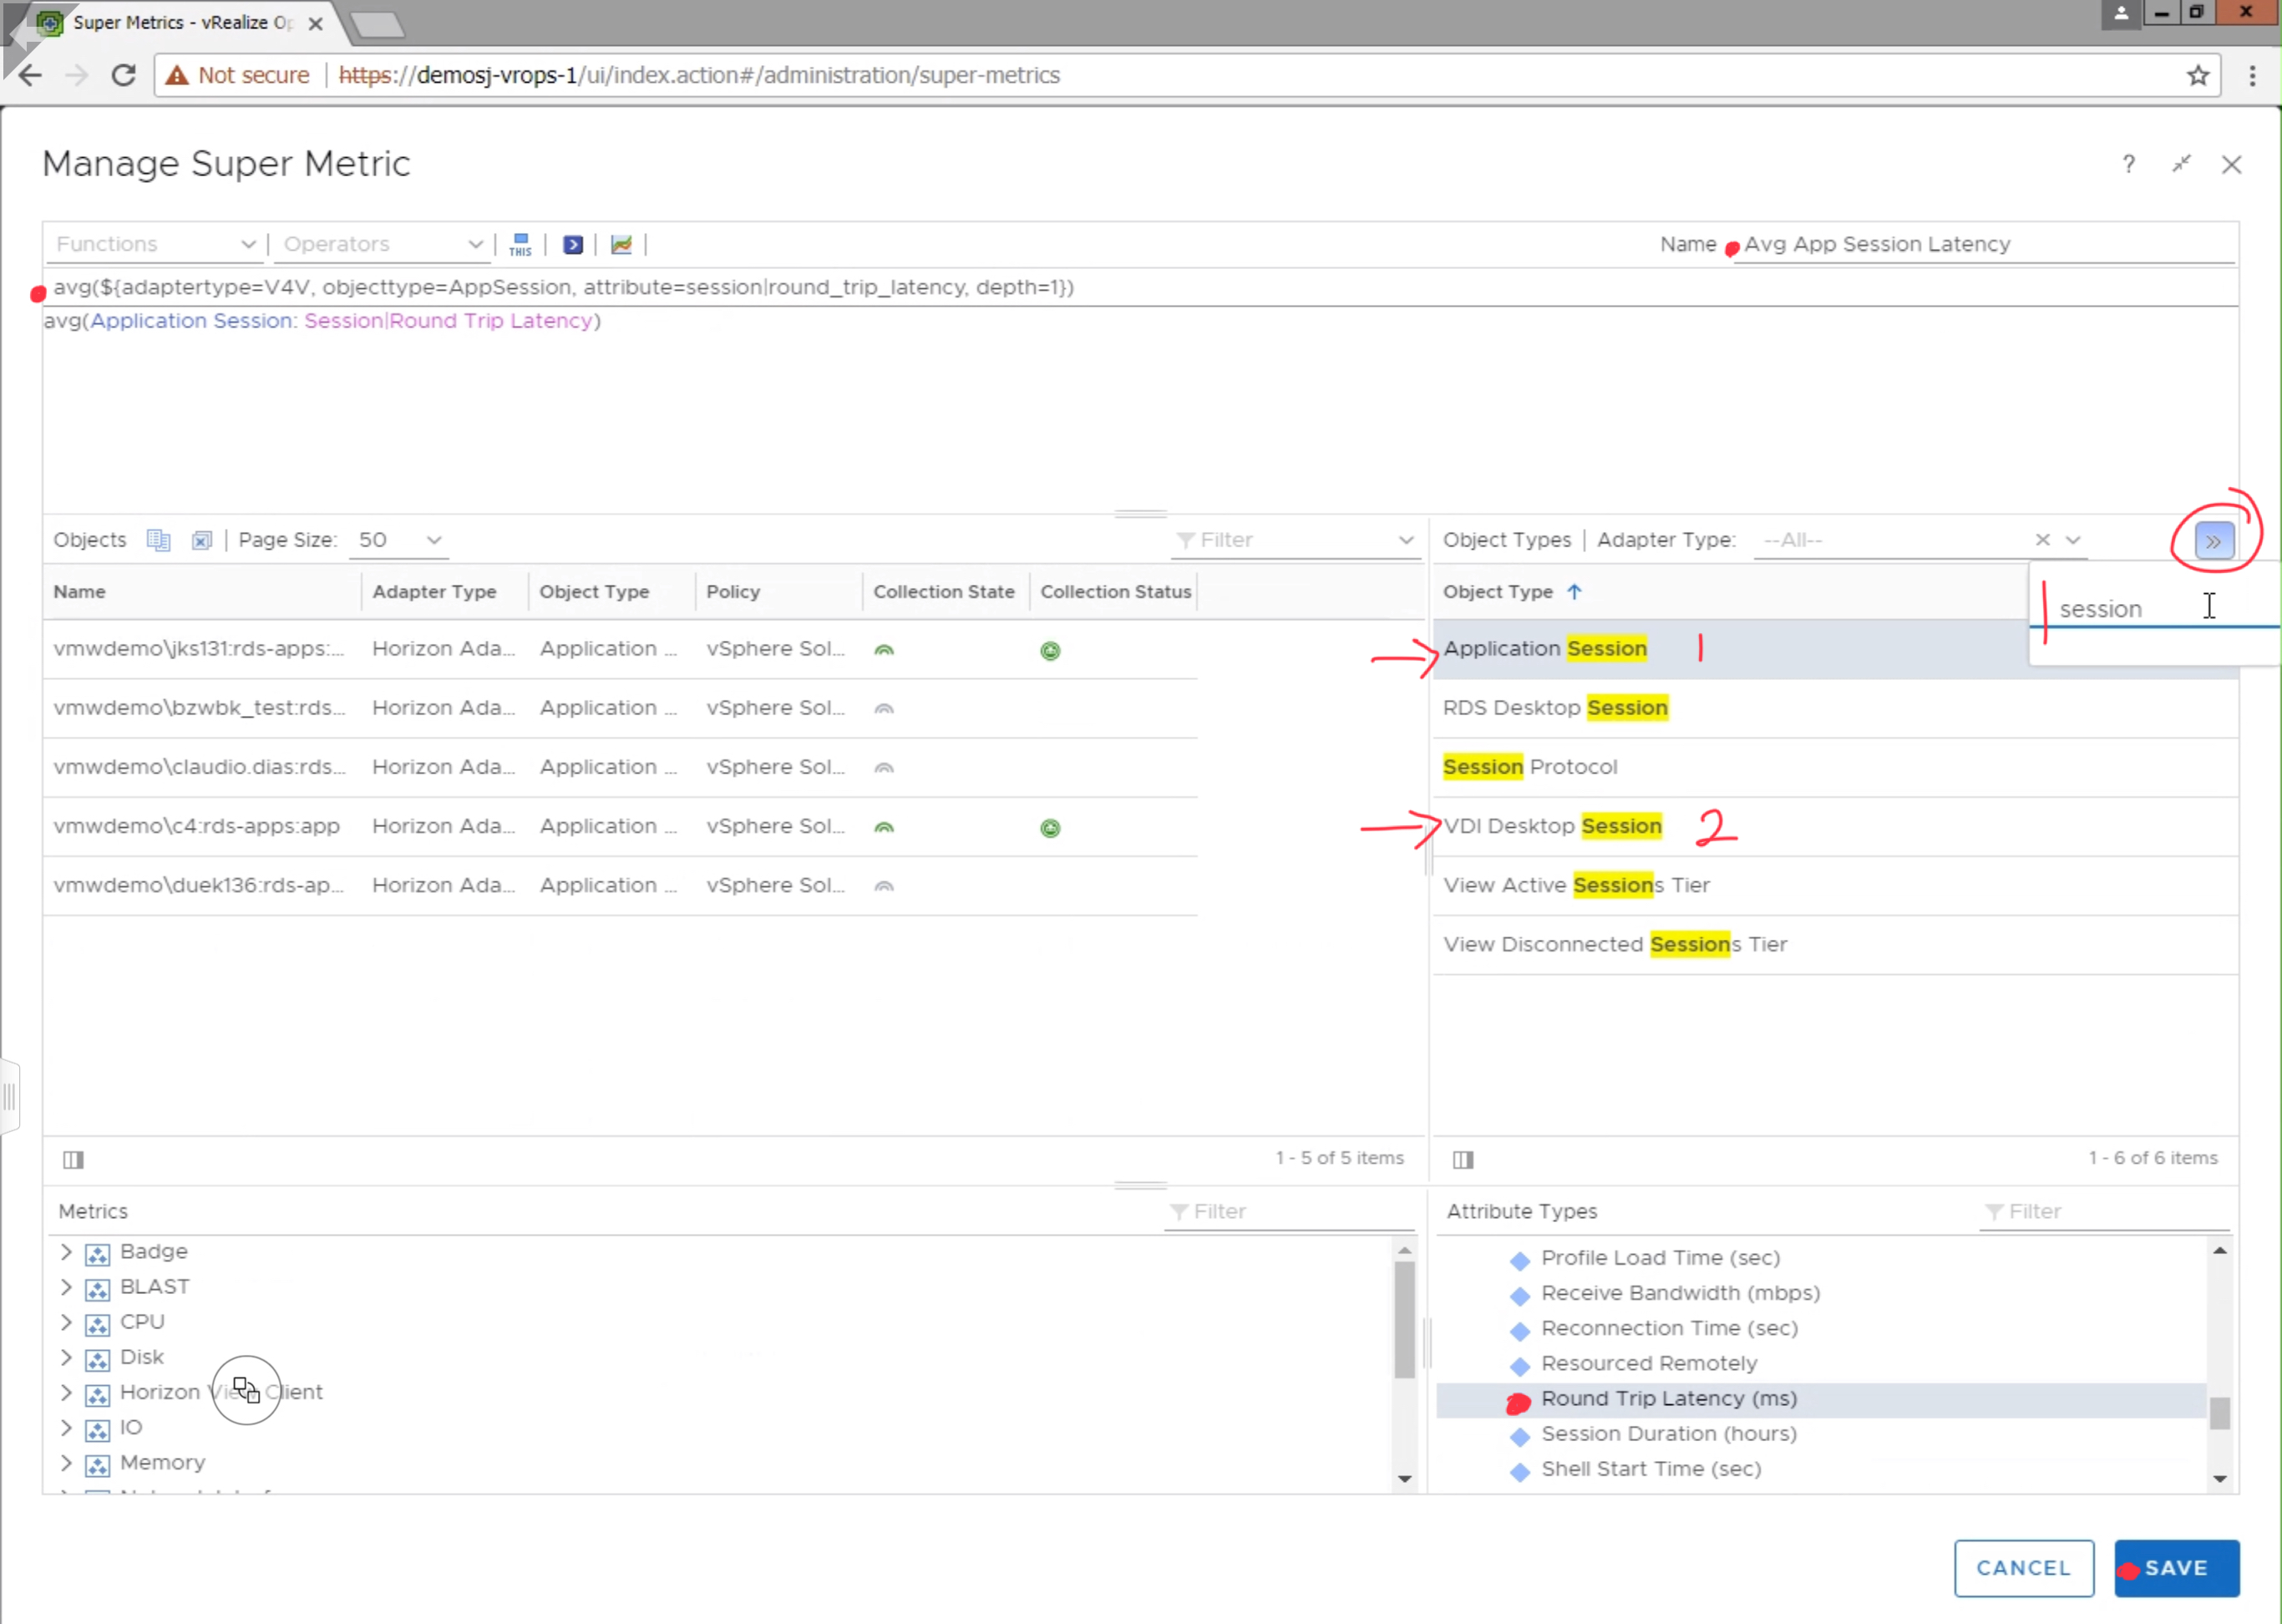
Provide the Super Metric a unique name, in this case we are using “Avg App Session Latency”. Search for the “Application Session” Object Type, and click “Round Trip Latency (ms)” to add it to the Super Metric. Since, we are looking for the average latency, select “avg” from the available functions list, making sure that the average function applies to the metric by encapsulating it parenthesis as demonstrated in the image below. Click Save to finish the Super Metric.
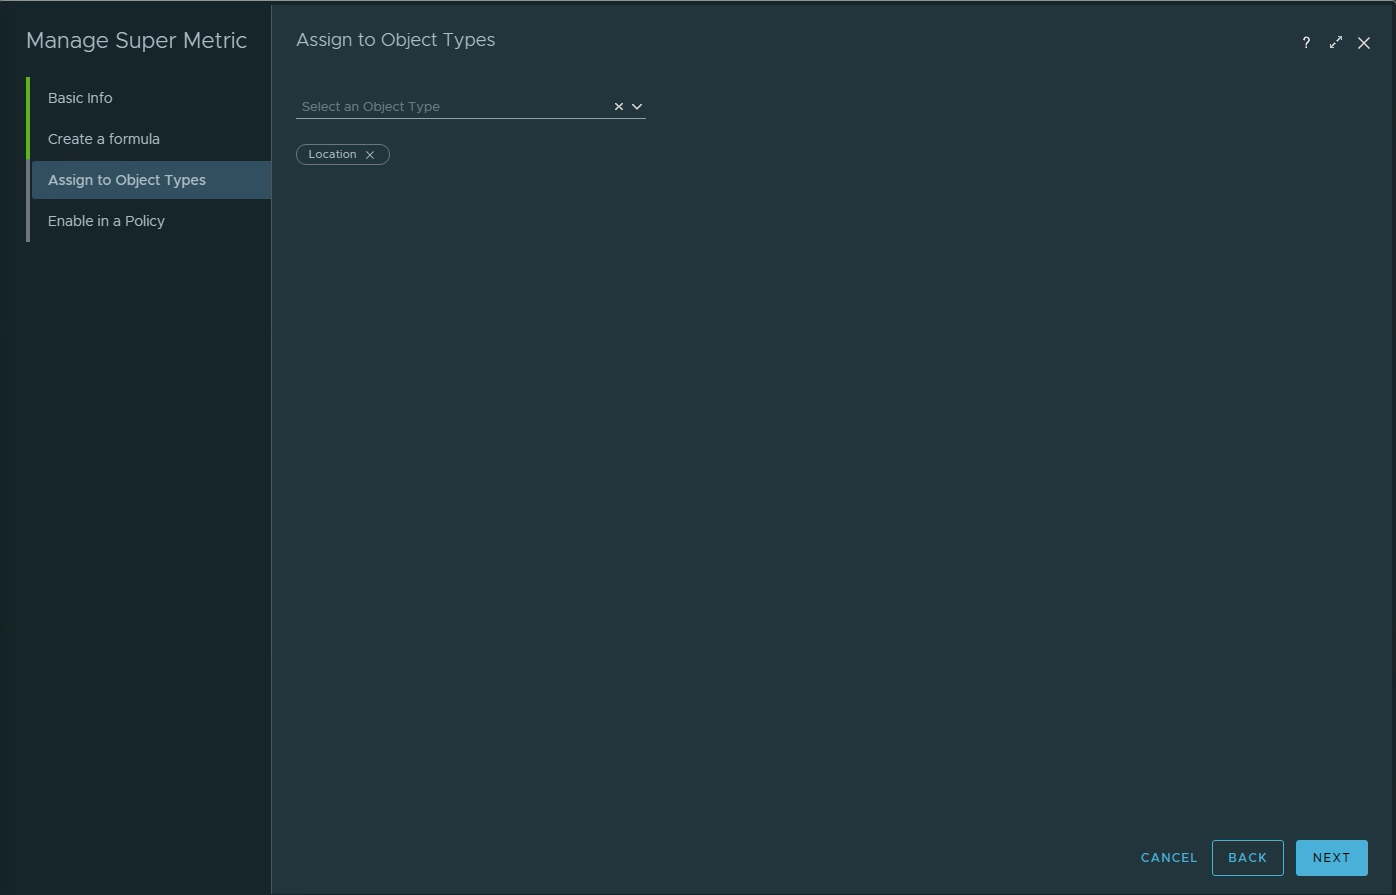
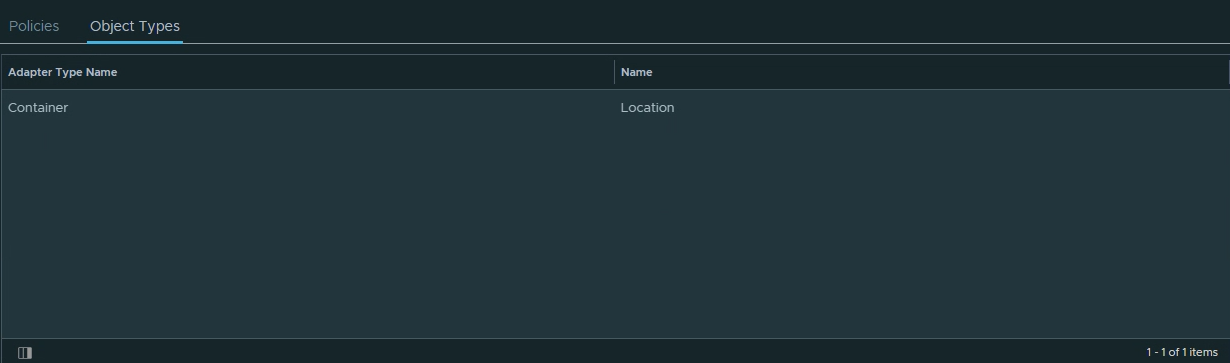
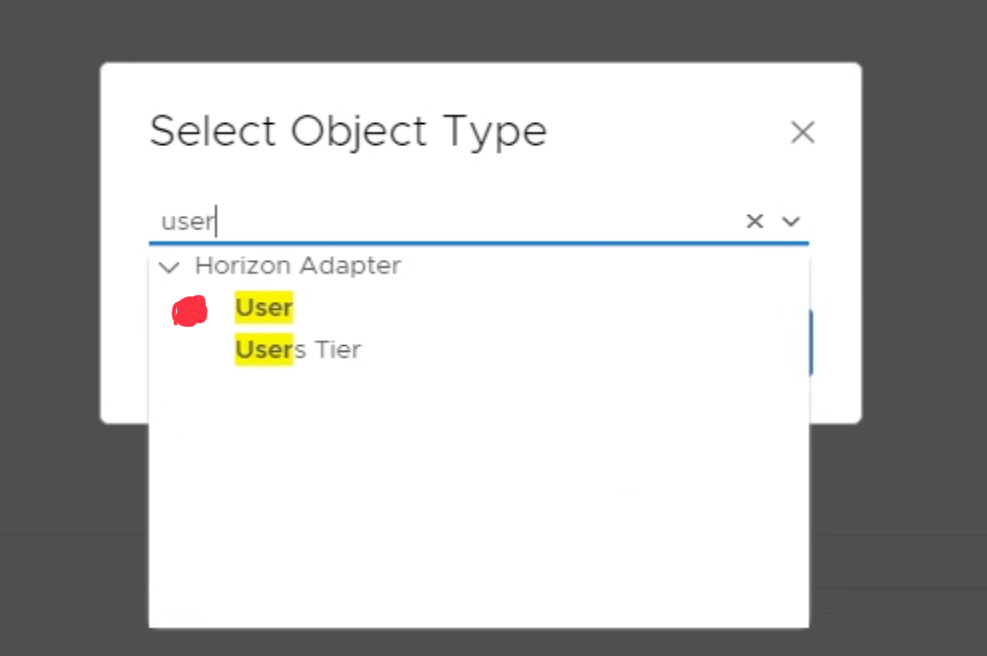
Next, you will need to add the Super Metric to the “User” object type. Click the green + sign under the “Object Types” section. Search and select the “User” object type.
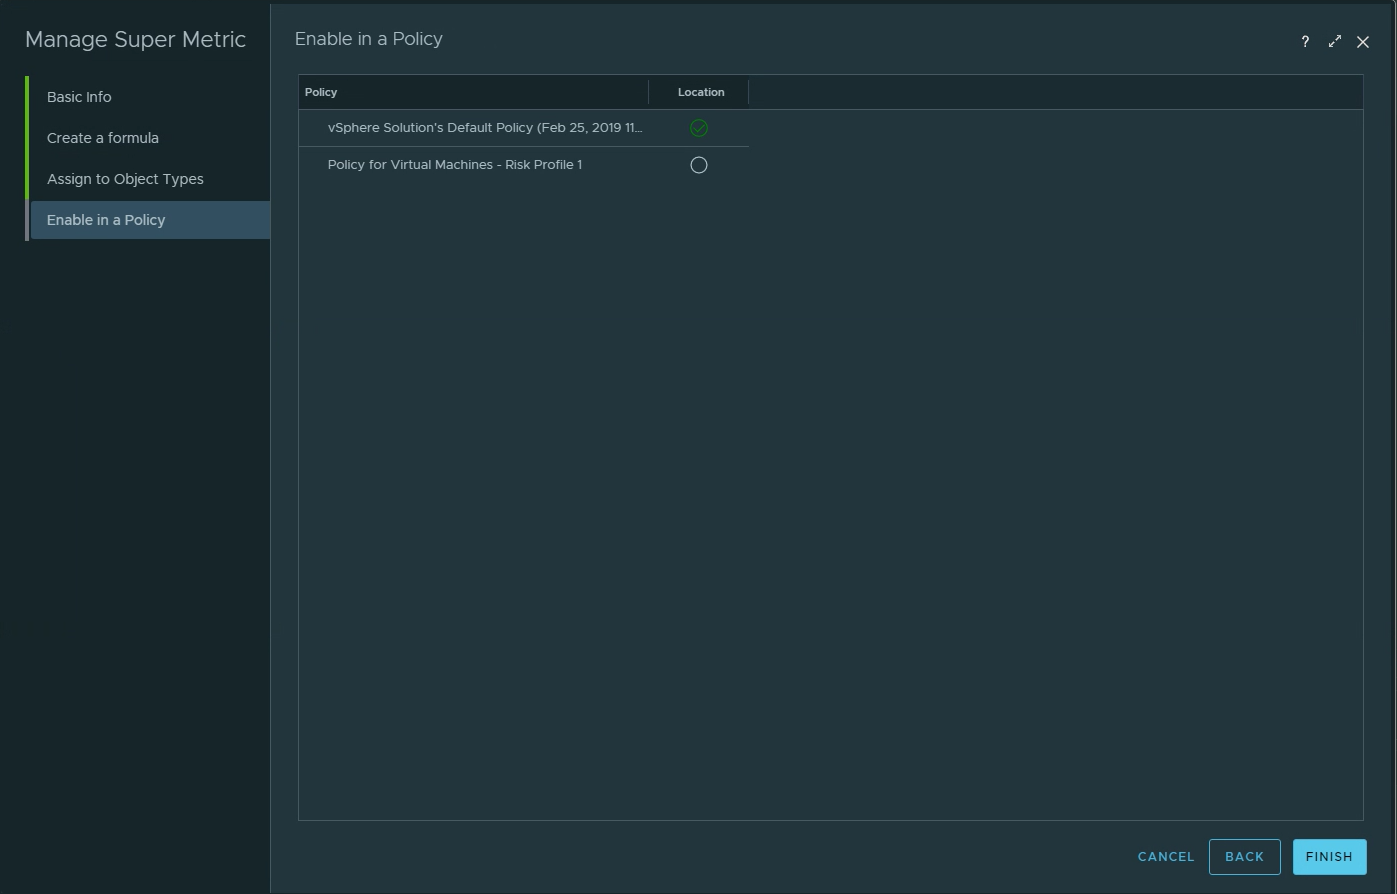
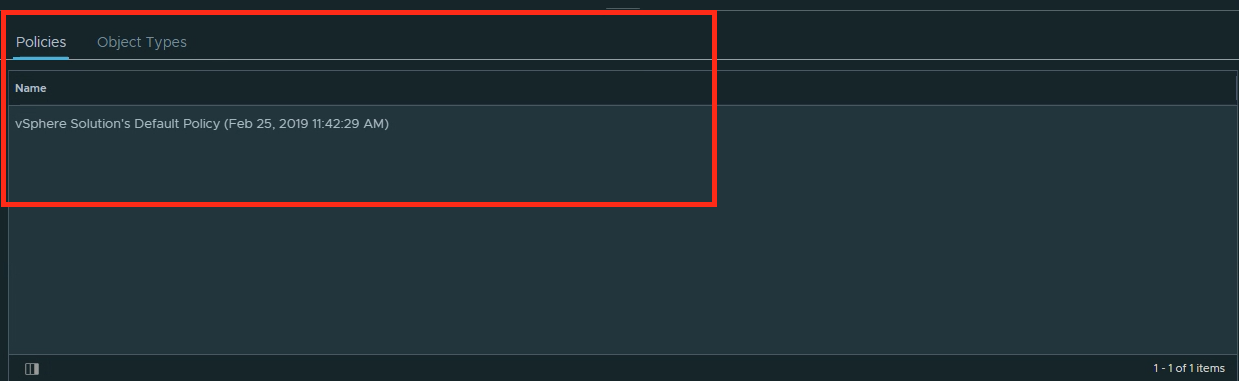
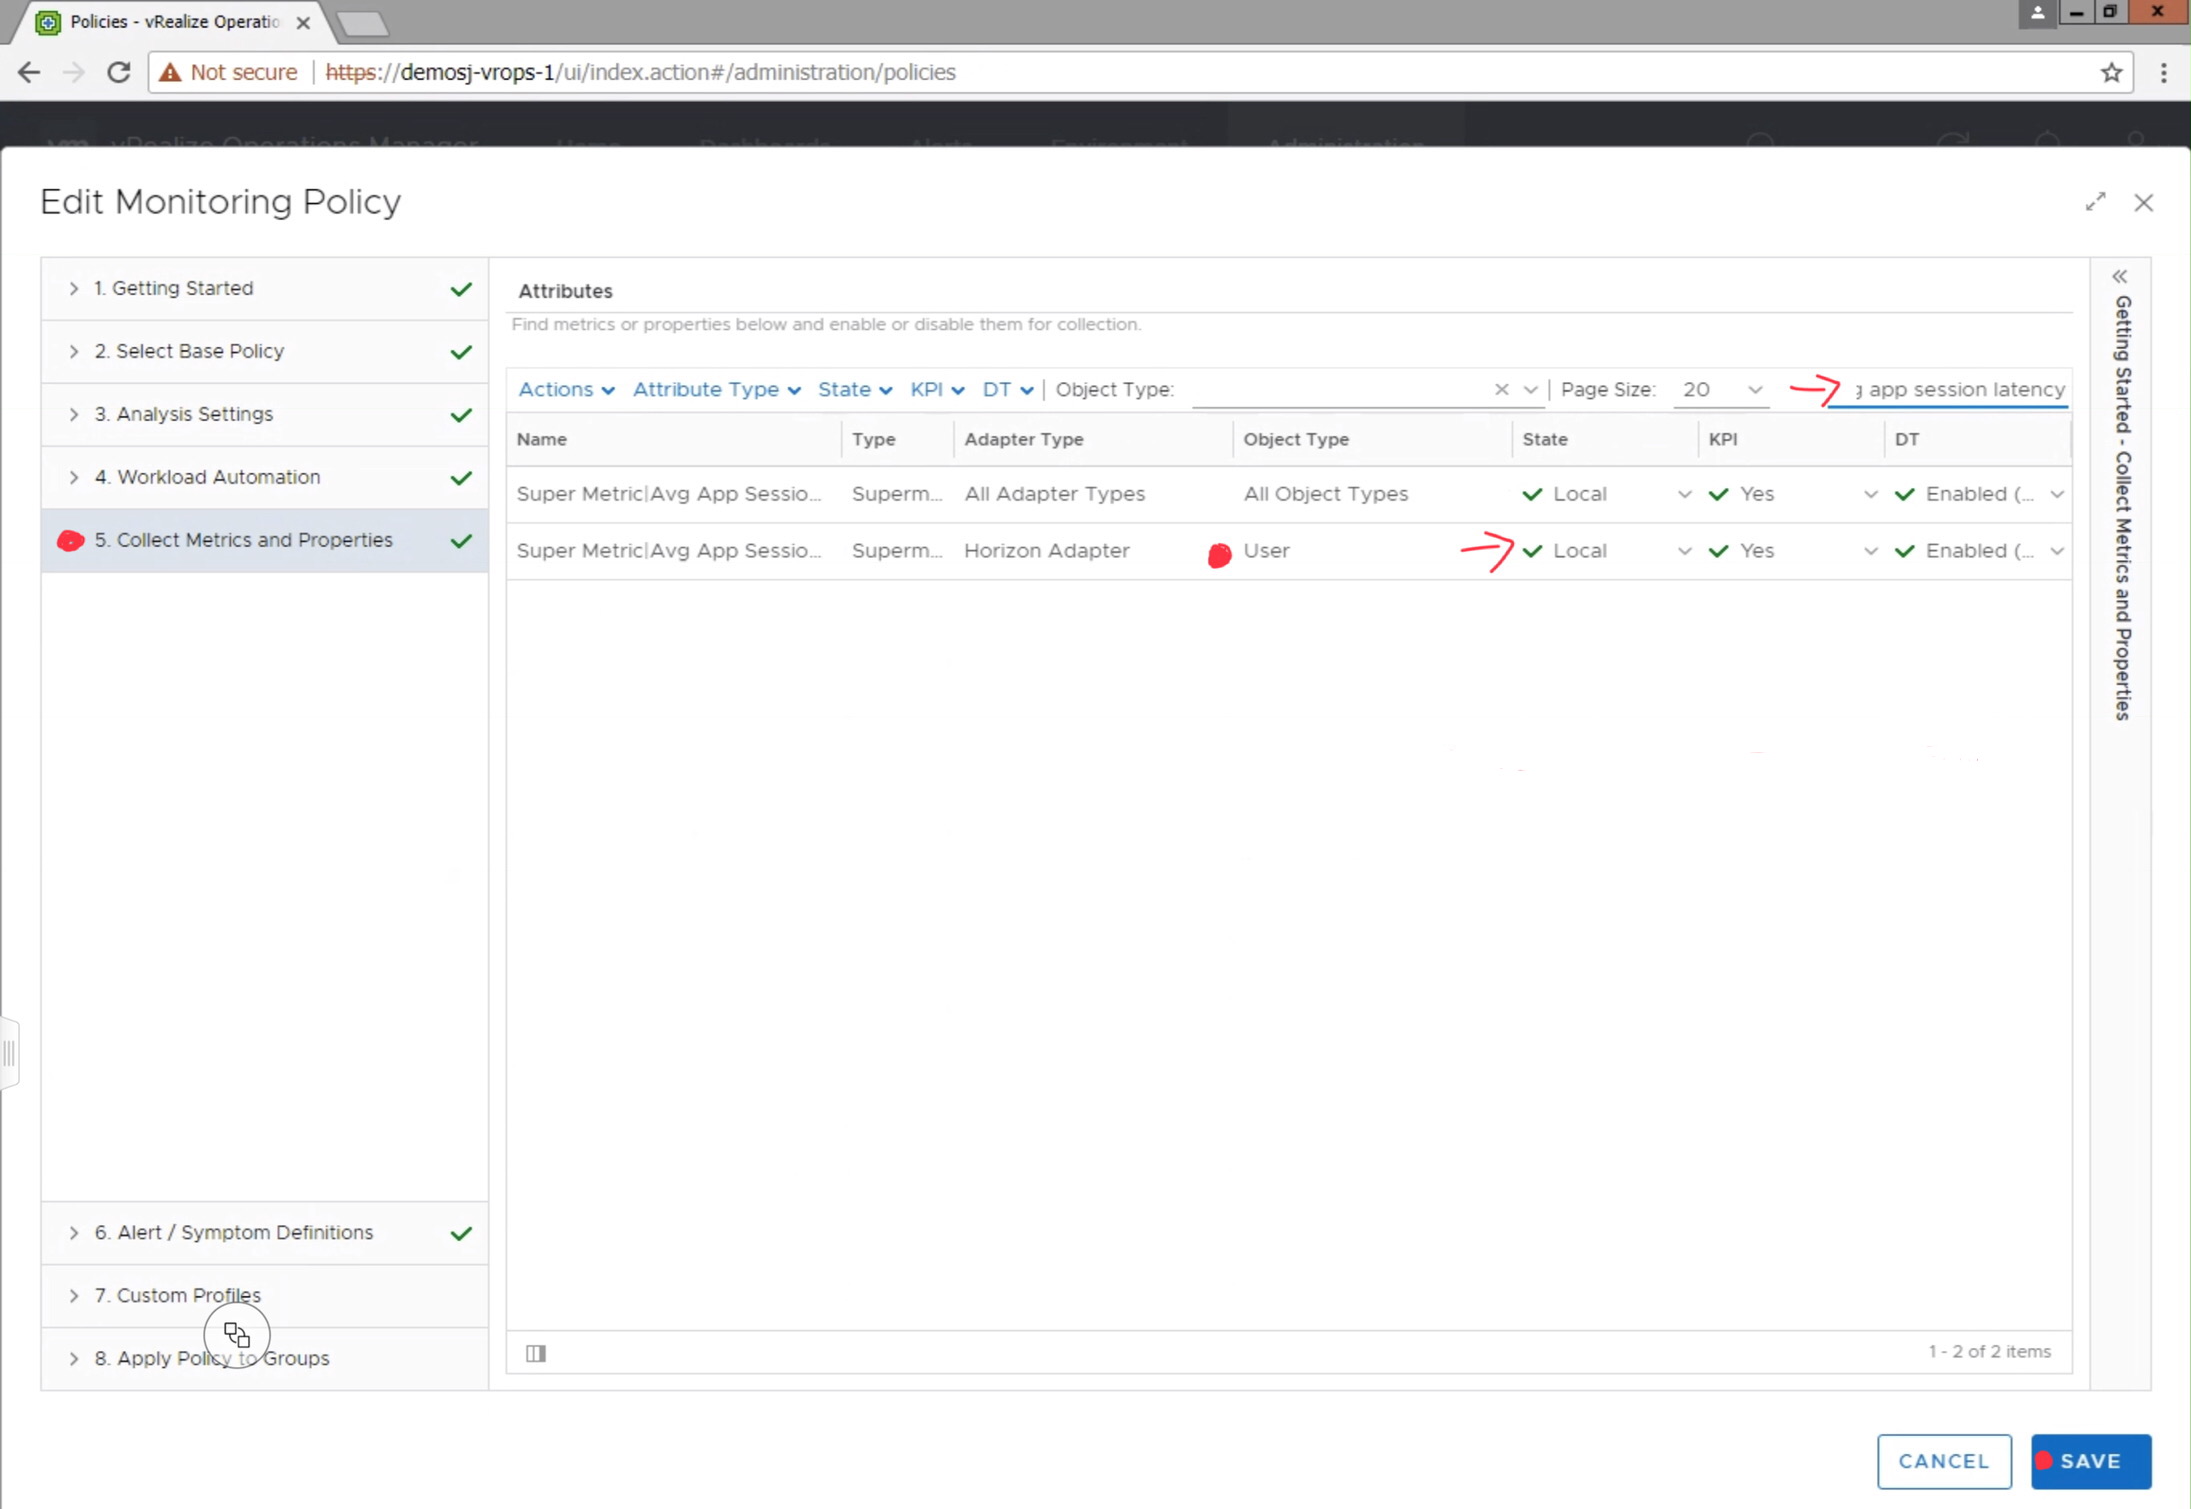
Before the Super Metric will begin collecting data, you will need to navigate to Administration-> Policies, and edit the active monitoring policy to enable the metric for collection.
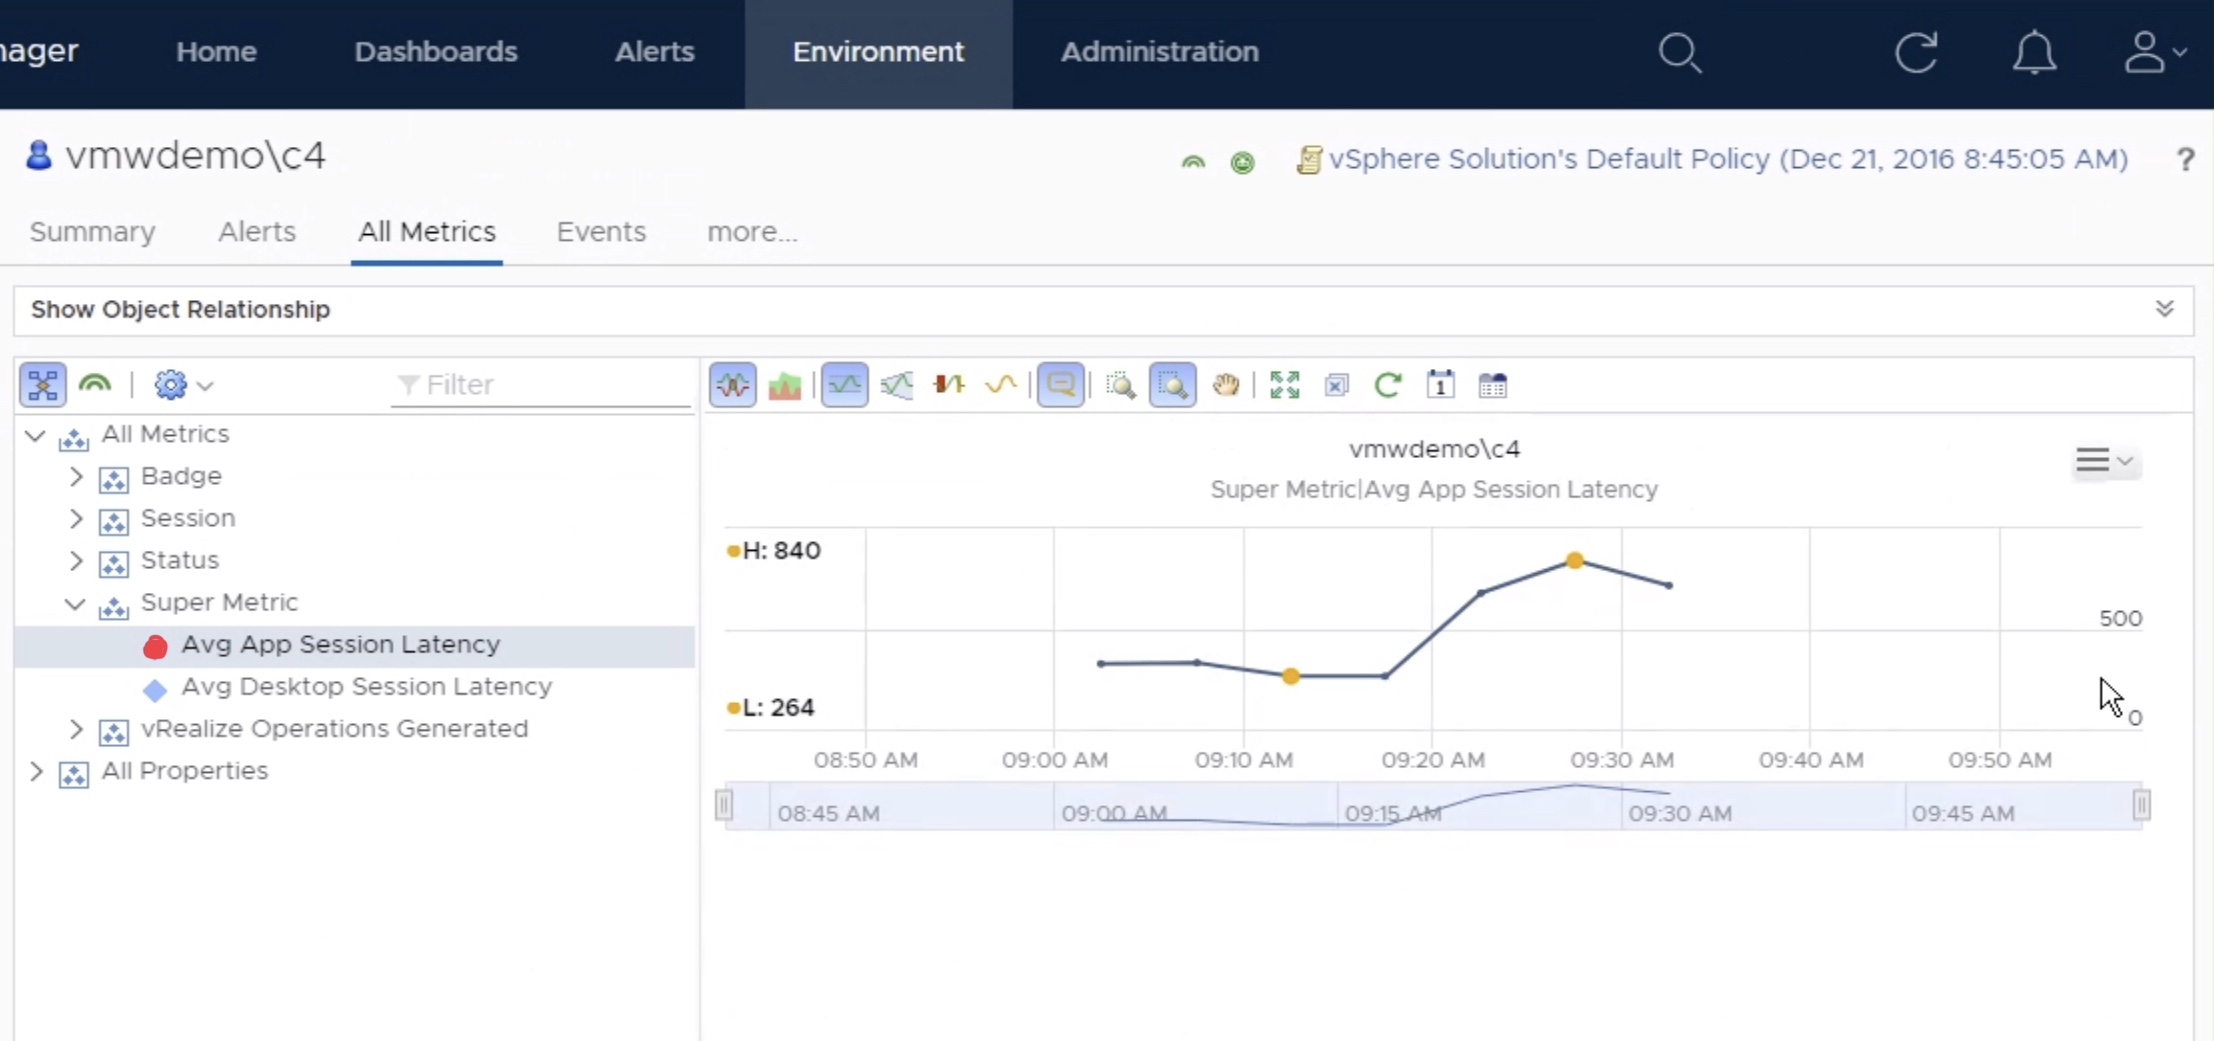
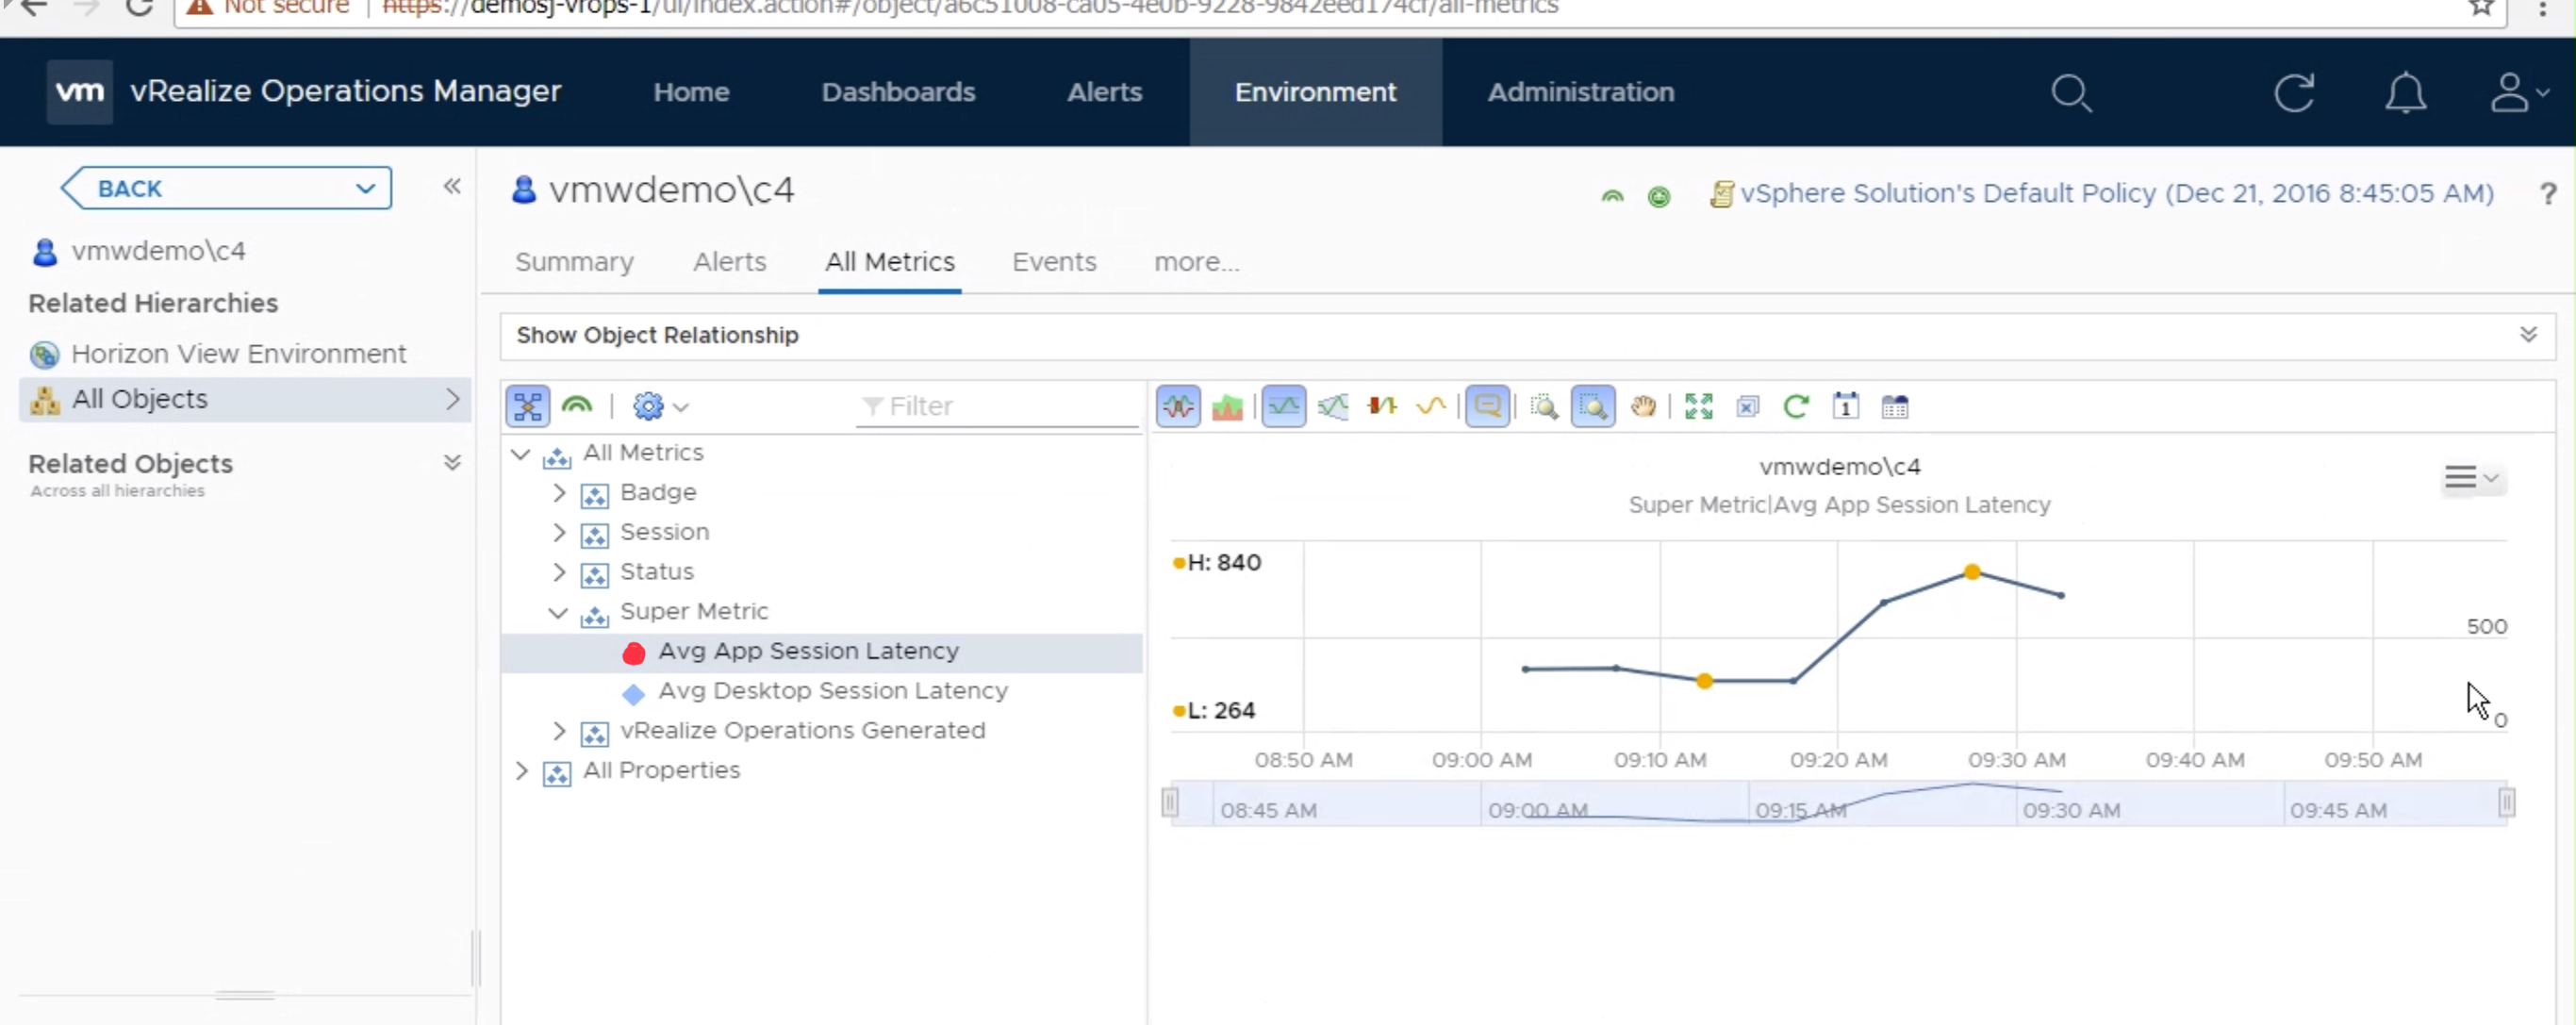
Once the metric has started to collect data, you can view the data on a individual “User” object by selecting “All Metrics” -> Super Metric -> select metric.
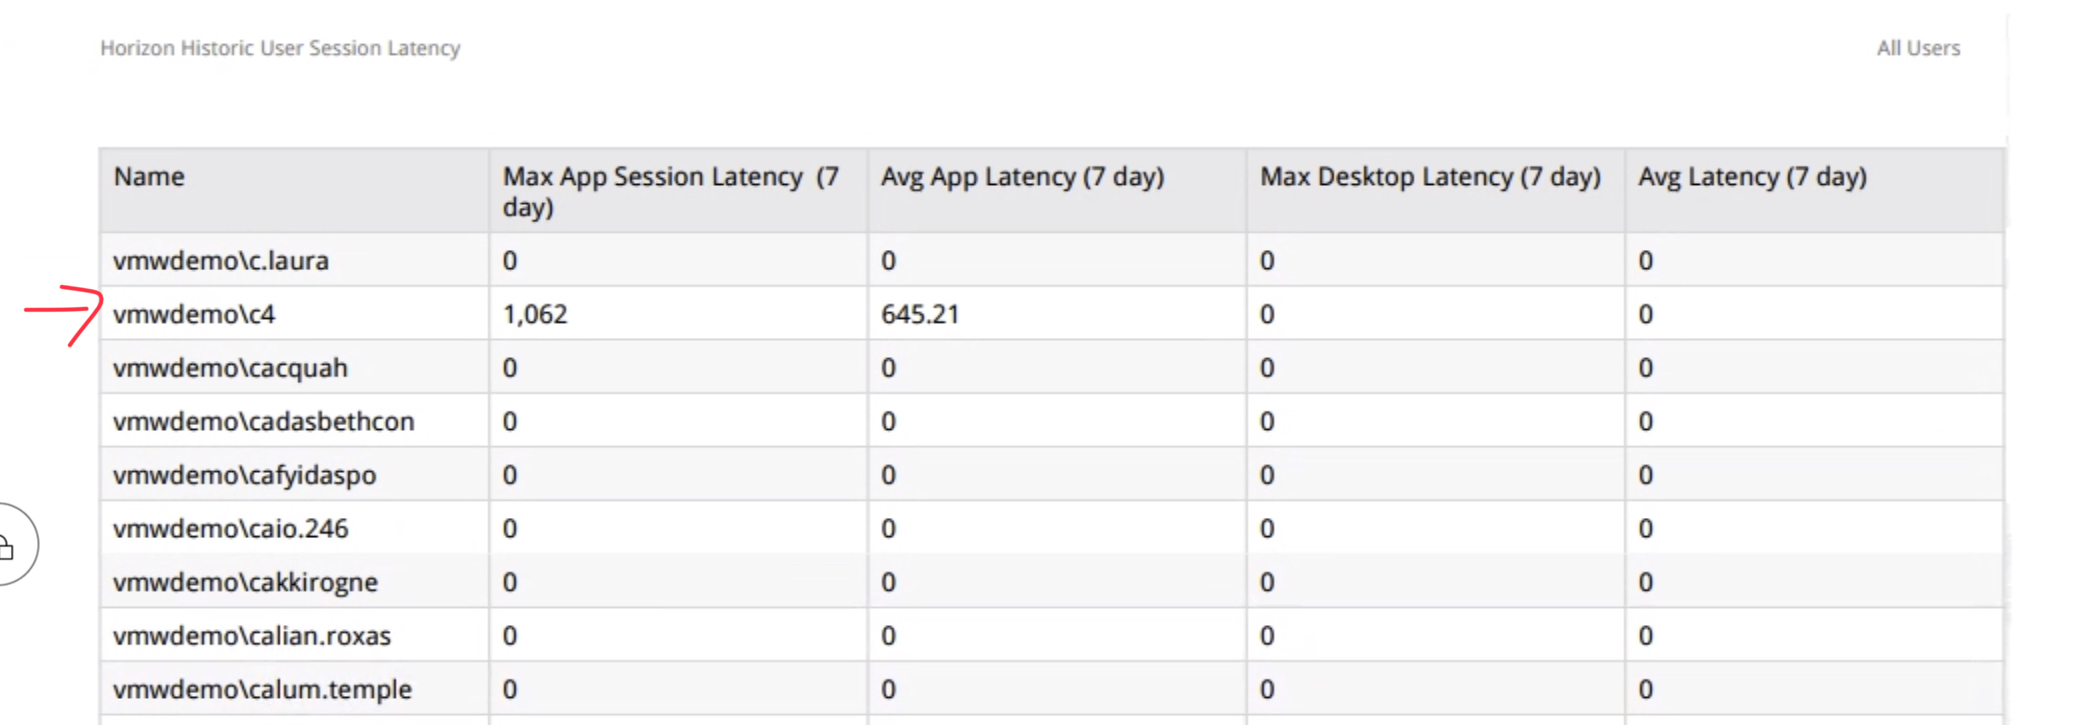
You can also create custom Views that display the historical latency for all users of the environment, as well as perform simple roll-up statistics.
How to leverage Historic User Reporting in vROPs for Horizon 6.5
When it comes to monitoring of a Virtual App environment, having easy access to historic User records is key for management level reporting. Insight into previous pool access, applications launched in a desktop session, and client IP address are just a few key metrics that organizations need the ability to report on user activity.
In the latest vROPs for Horizon 6.5, there were a number of enhancements to User and Desktops Pool related metrics, that make it easier for customers to track historic usage of their Horizon View environment. These enhancements include the ability to track which desktops and application pools a user has accessed, login time, previous machine name, and various other useful metrics.
This post will guide you on how to import a custom Horizon User History Dashboard that leverages these features, as well as how to utilize the widgets to enhance the monitoring and reporting of your Horizon View environment.
Horizon User History Dashboard for Historic User Reporting:
To provide quick access to user historic reporting, I’ve created a new Horizon User History Dashboard that is available for download at the following link:
Download Horizon User History Dashboard
Download Horizon User History View
This dashboard is designed to allow a customer to quickly search for a user’s Active Directory user name, and display all of the relevant historic metrics available.
To use this Dashboard, it will first need to be imported along with the custom Metric Config and View provided in the zip files above. To do this, you will need to be logged into the vROPs console with sufficient rights to import content.
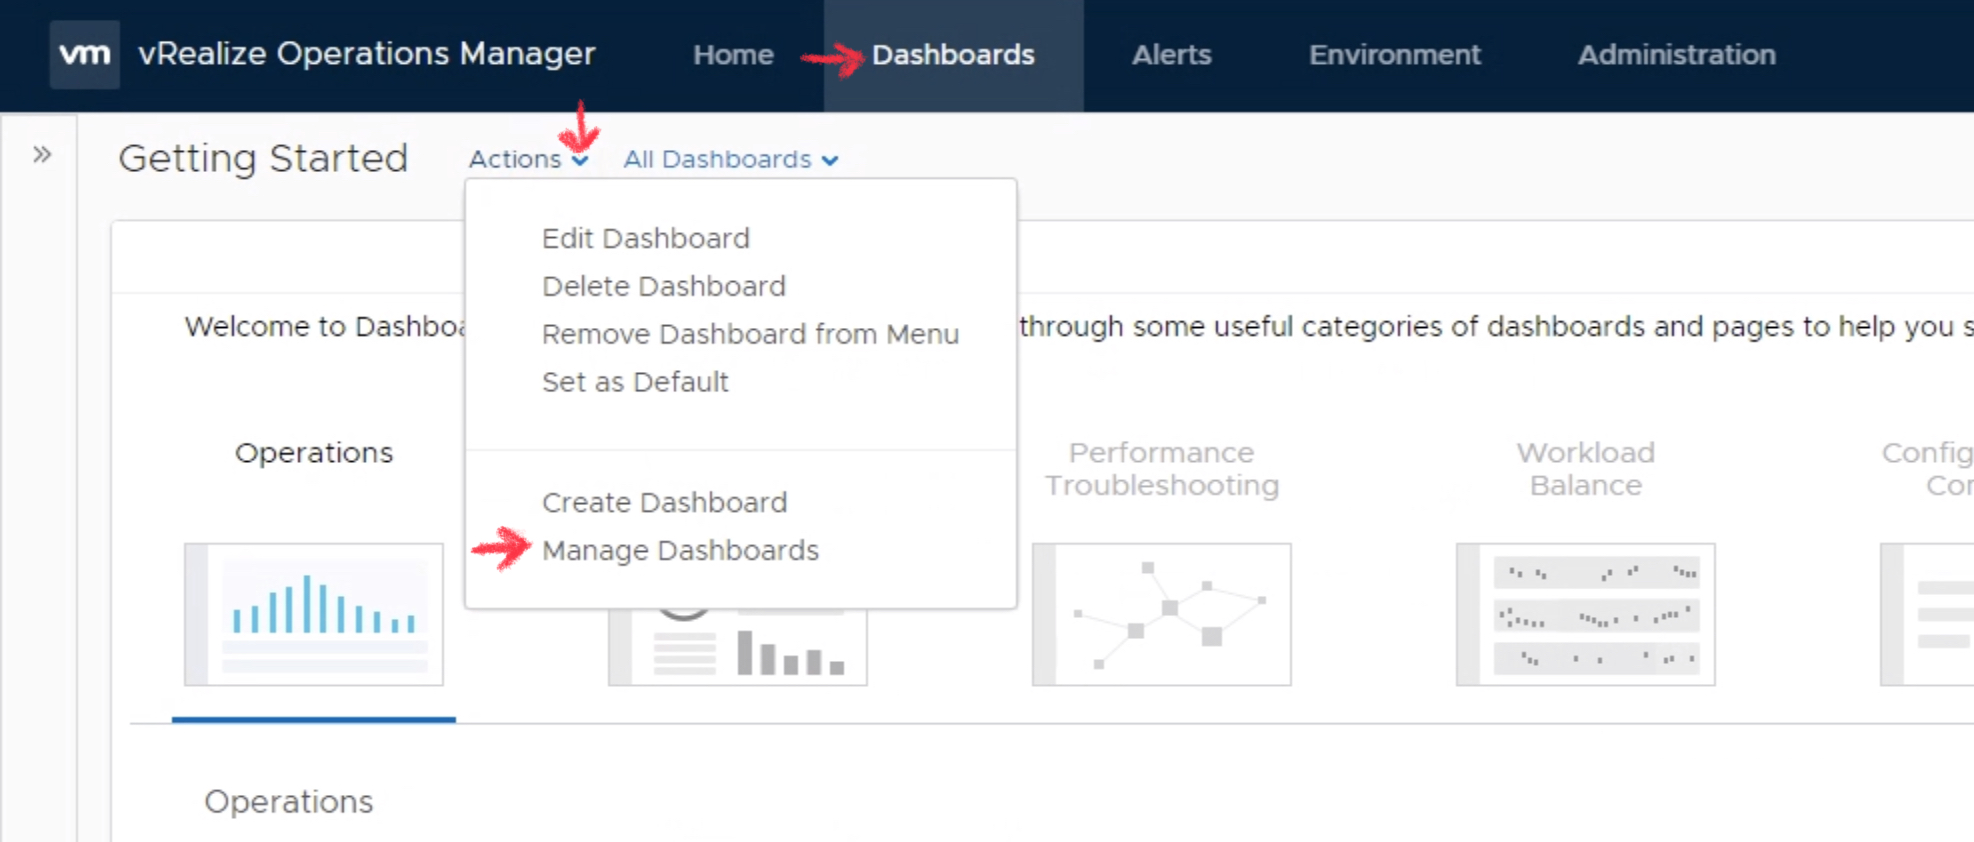
- Navigate to Dashboards -> Actions -> Manage Dashboards.
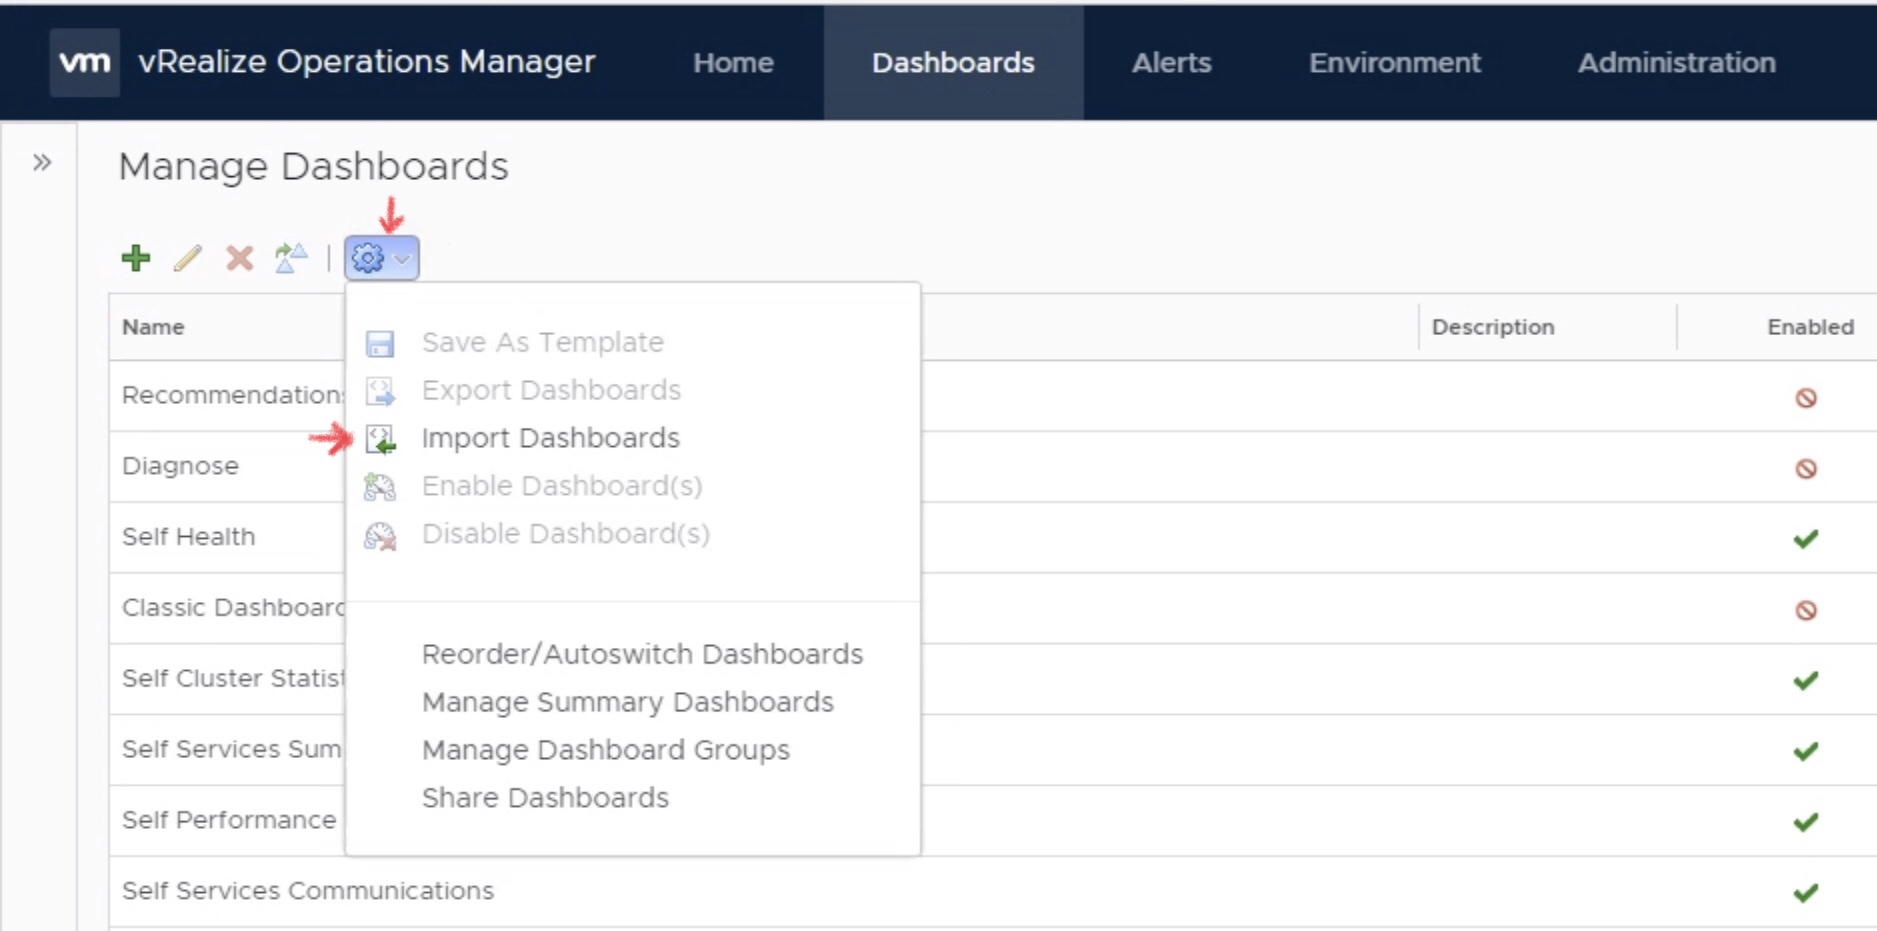
- Click the blue gear icon, navigate to the stored Dashboard file, and select Open to import.
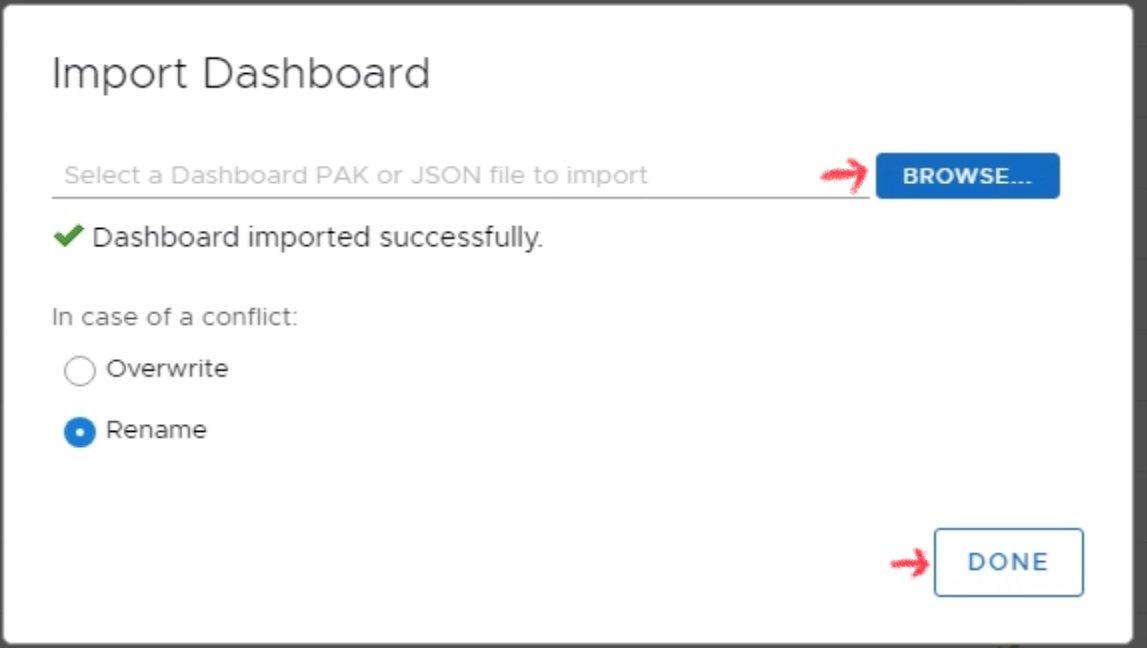
- Click Browse, select the provided XML file, and click Done.
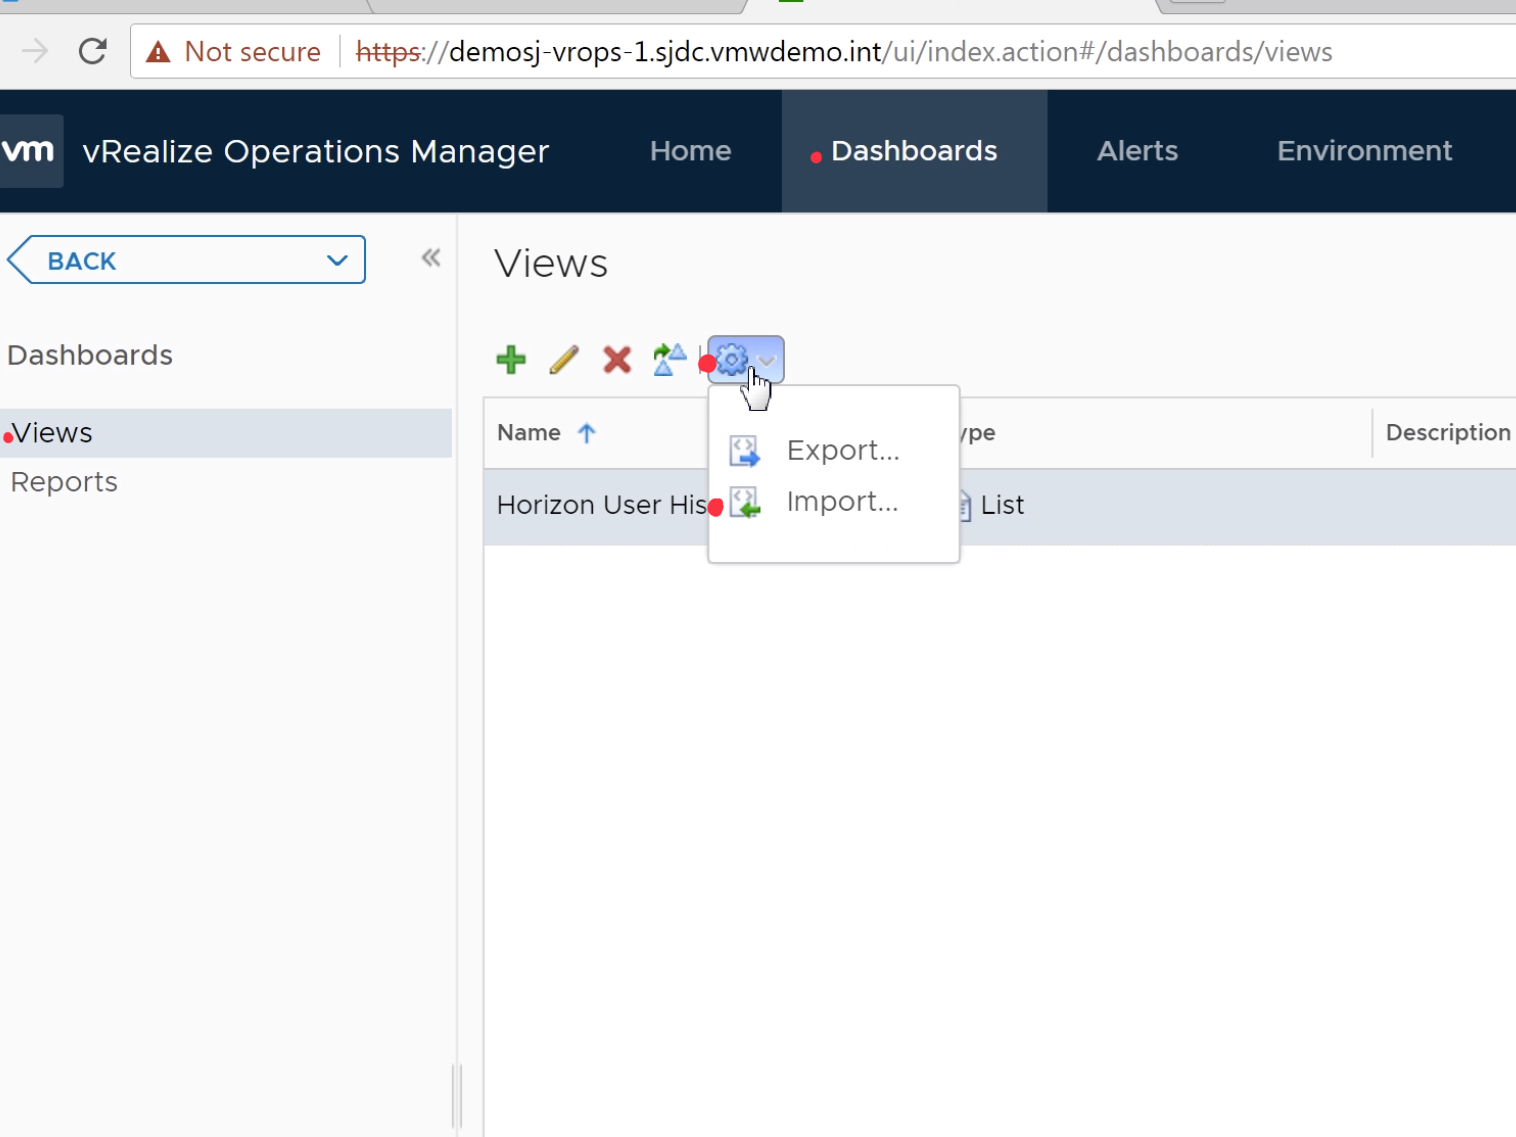
- To import the View, navigate to Dashboards, open the navigation tree, and select Views.
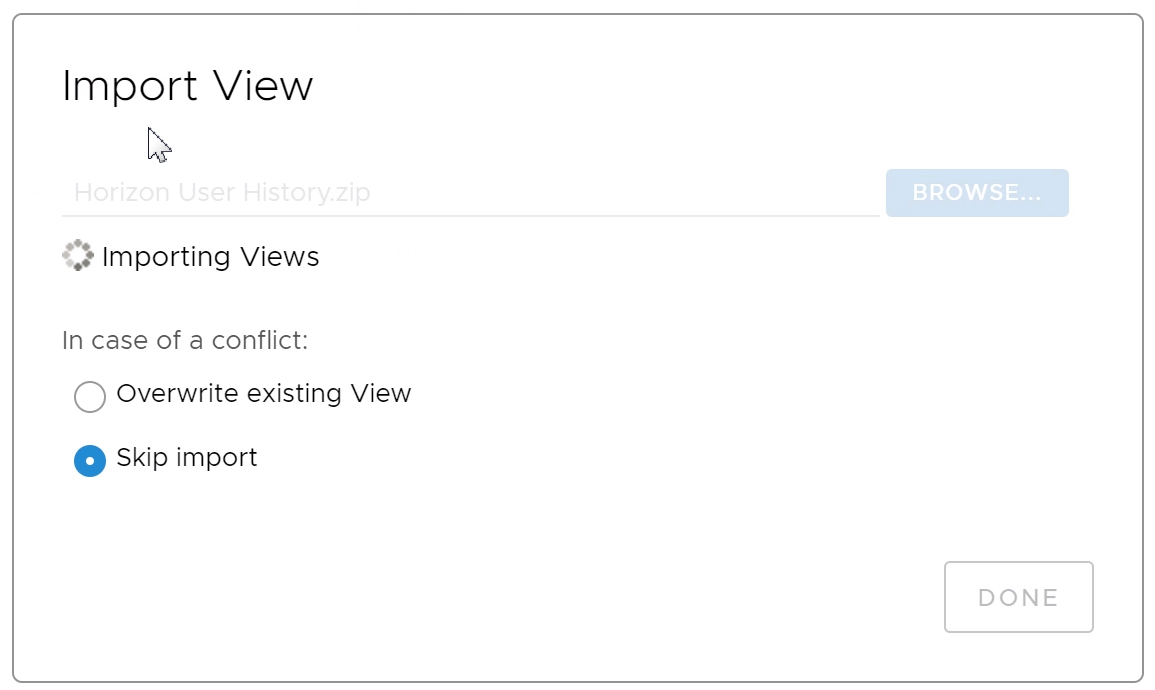
- Click the gear icon to import the Horizon User History.zip file provided above.
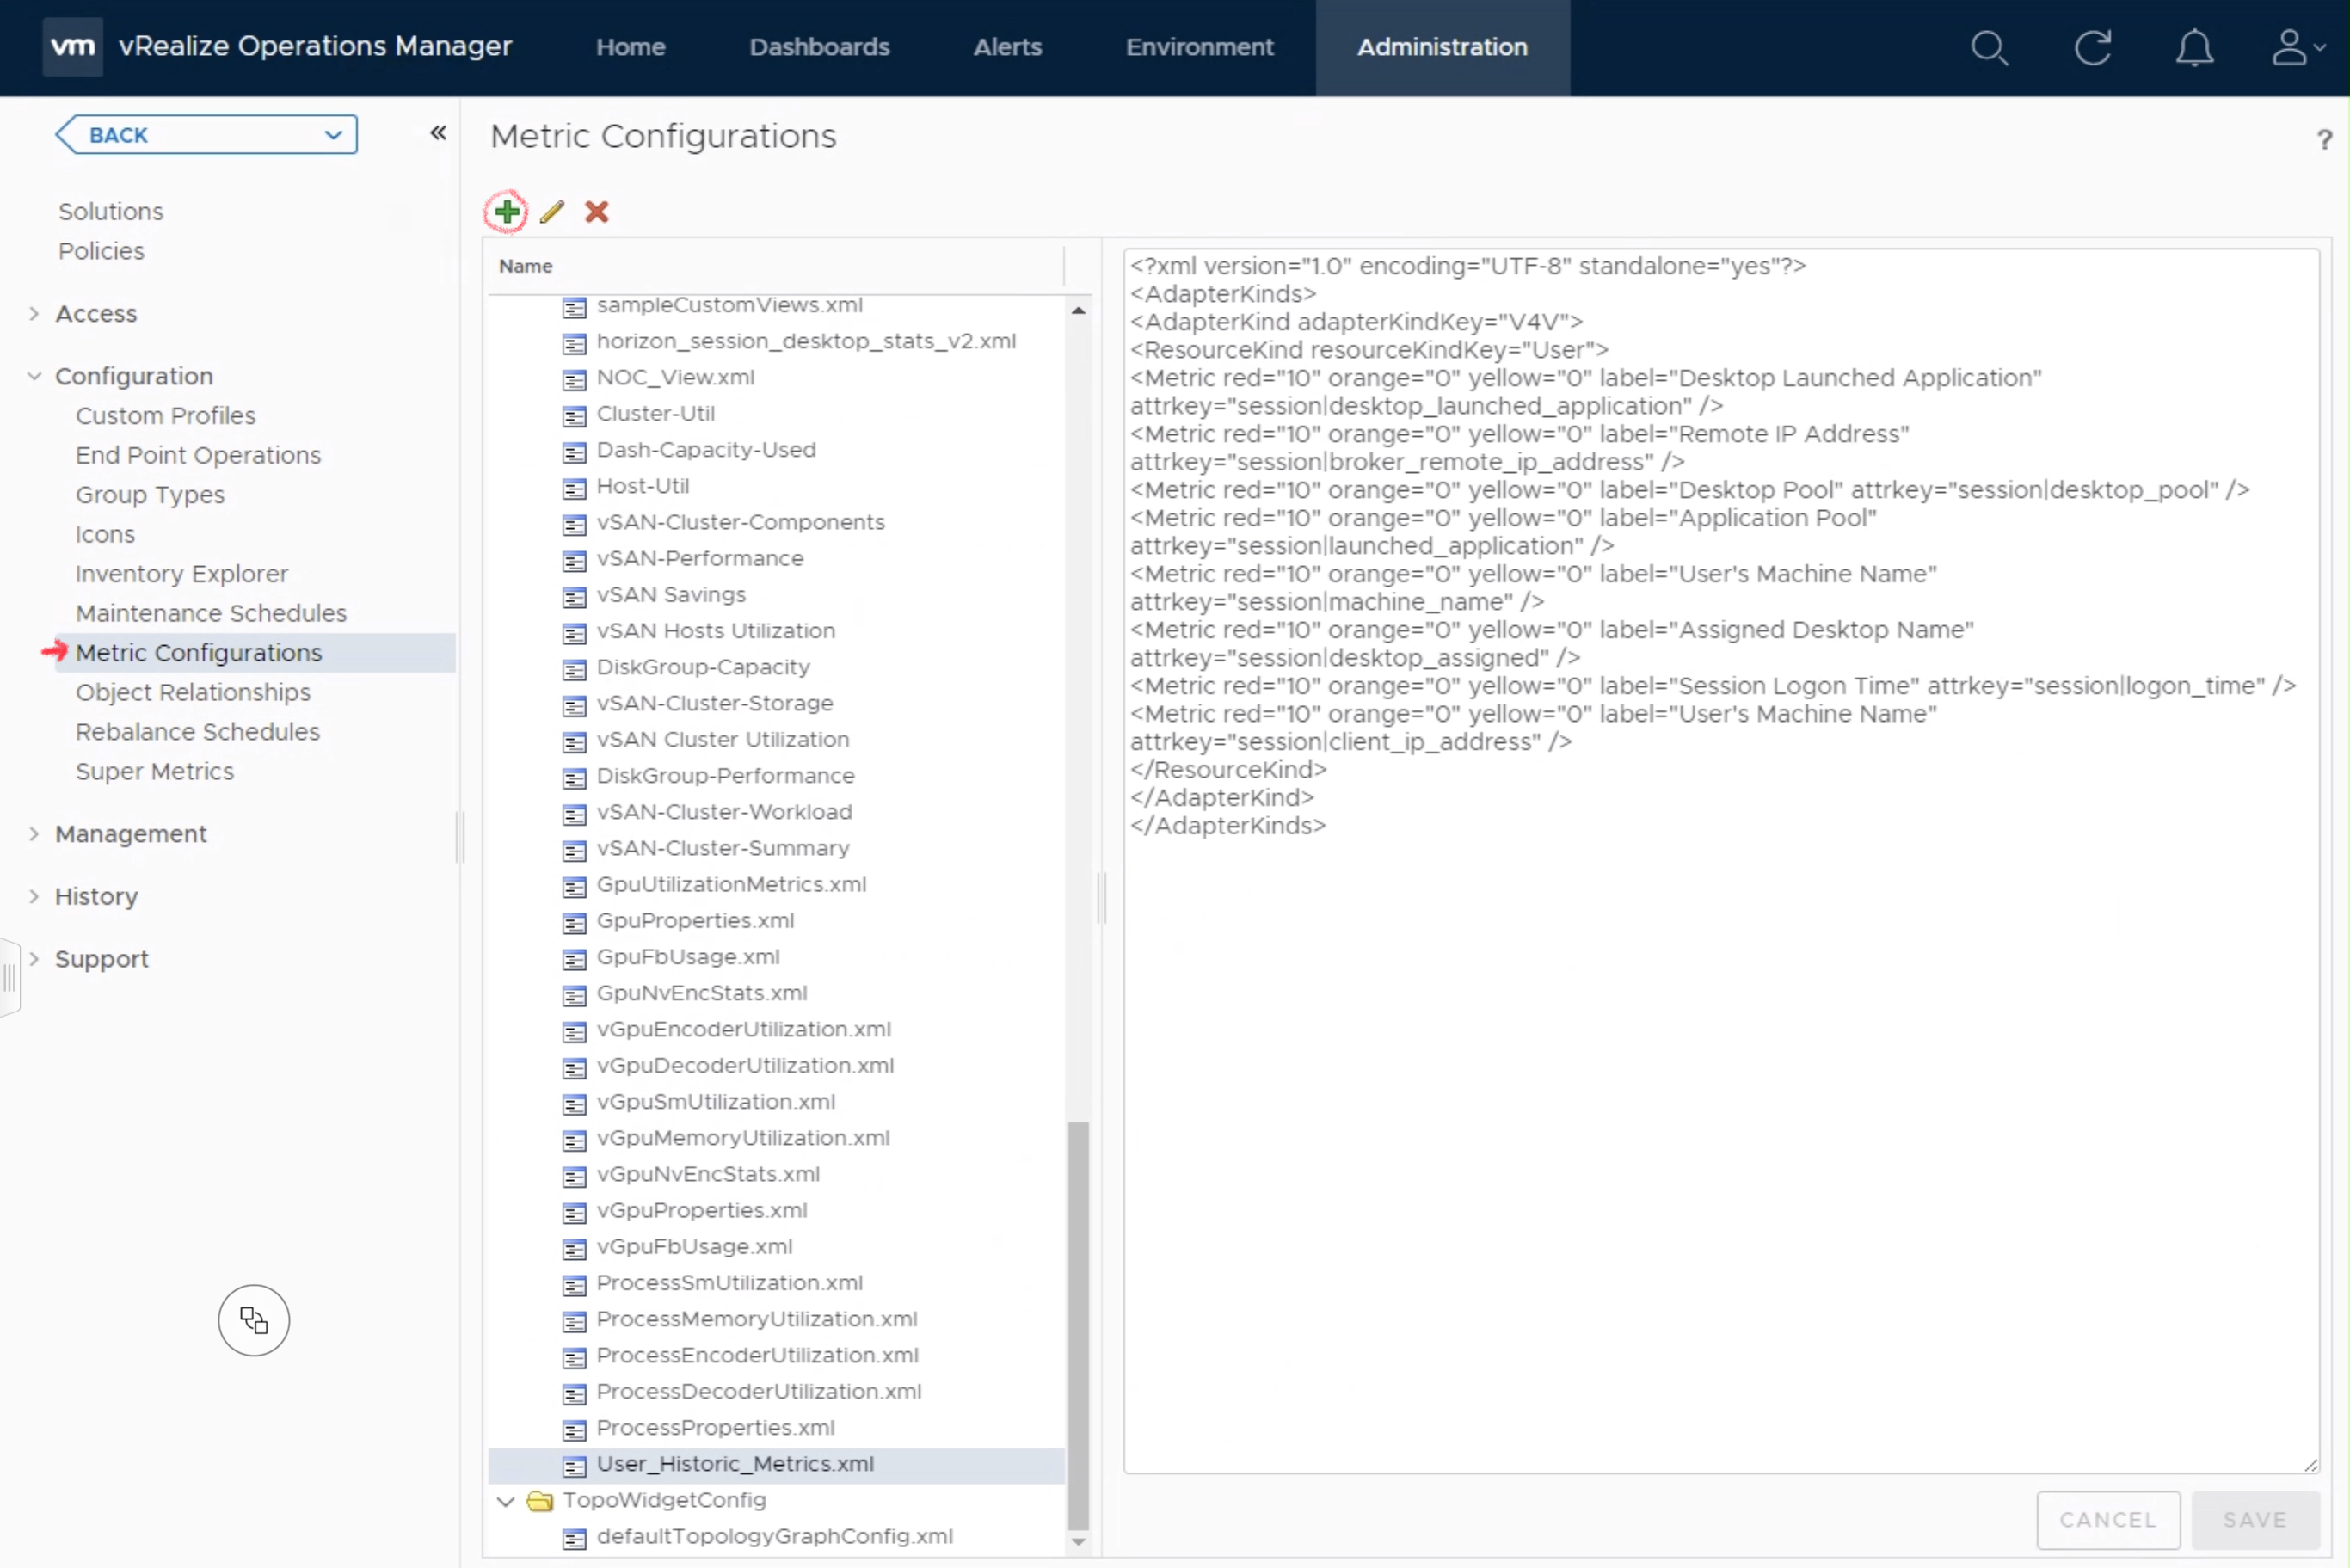
- To import the Metric Config, navigate and select Administration from the main menu.
- Expand the Configuration section, then select Metric Configurations, and select the ReskndMetrics section.
- Next, you will click the + sign to create a new Metric Config file and name the new configuration “User_Historic_Metrics.xml”. **Make sure this name matches exactly, or you will have to manually edit the widget in the dashboard and select the file name you created.
- Copy and paste the content from the provided XML file and click save.
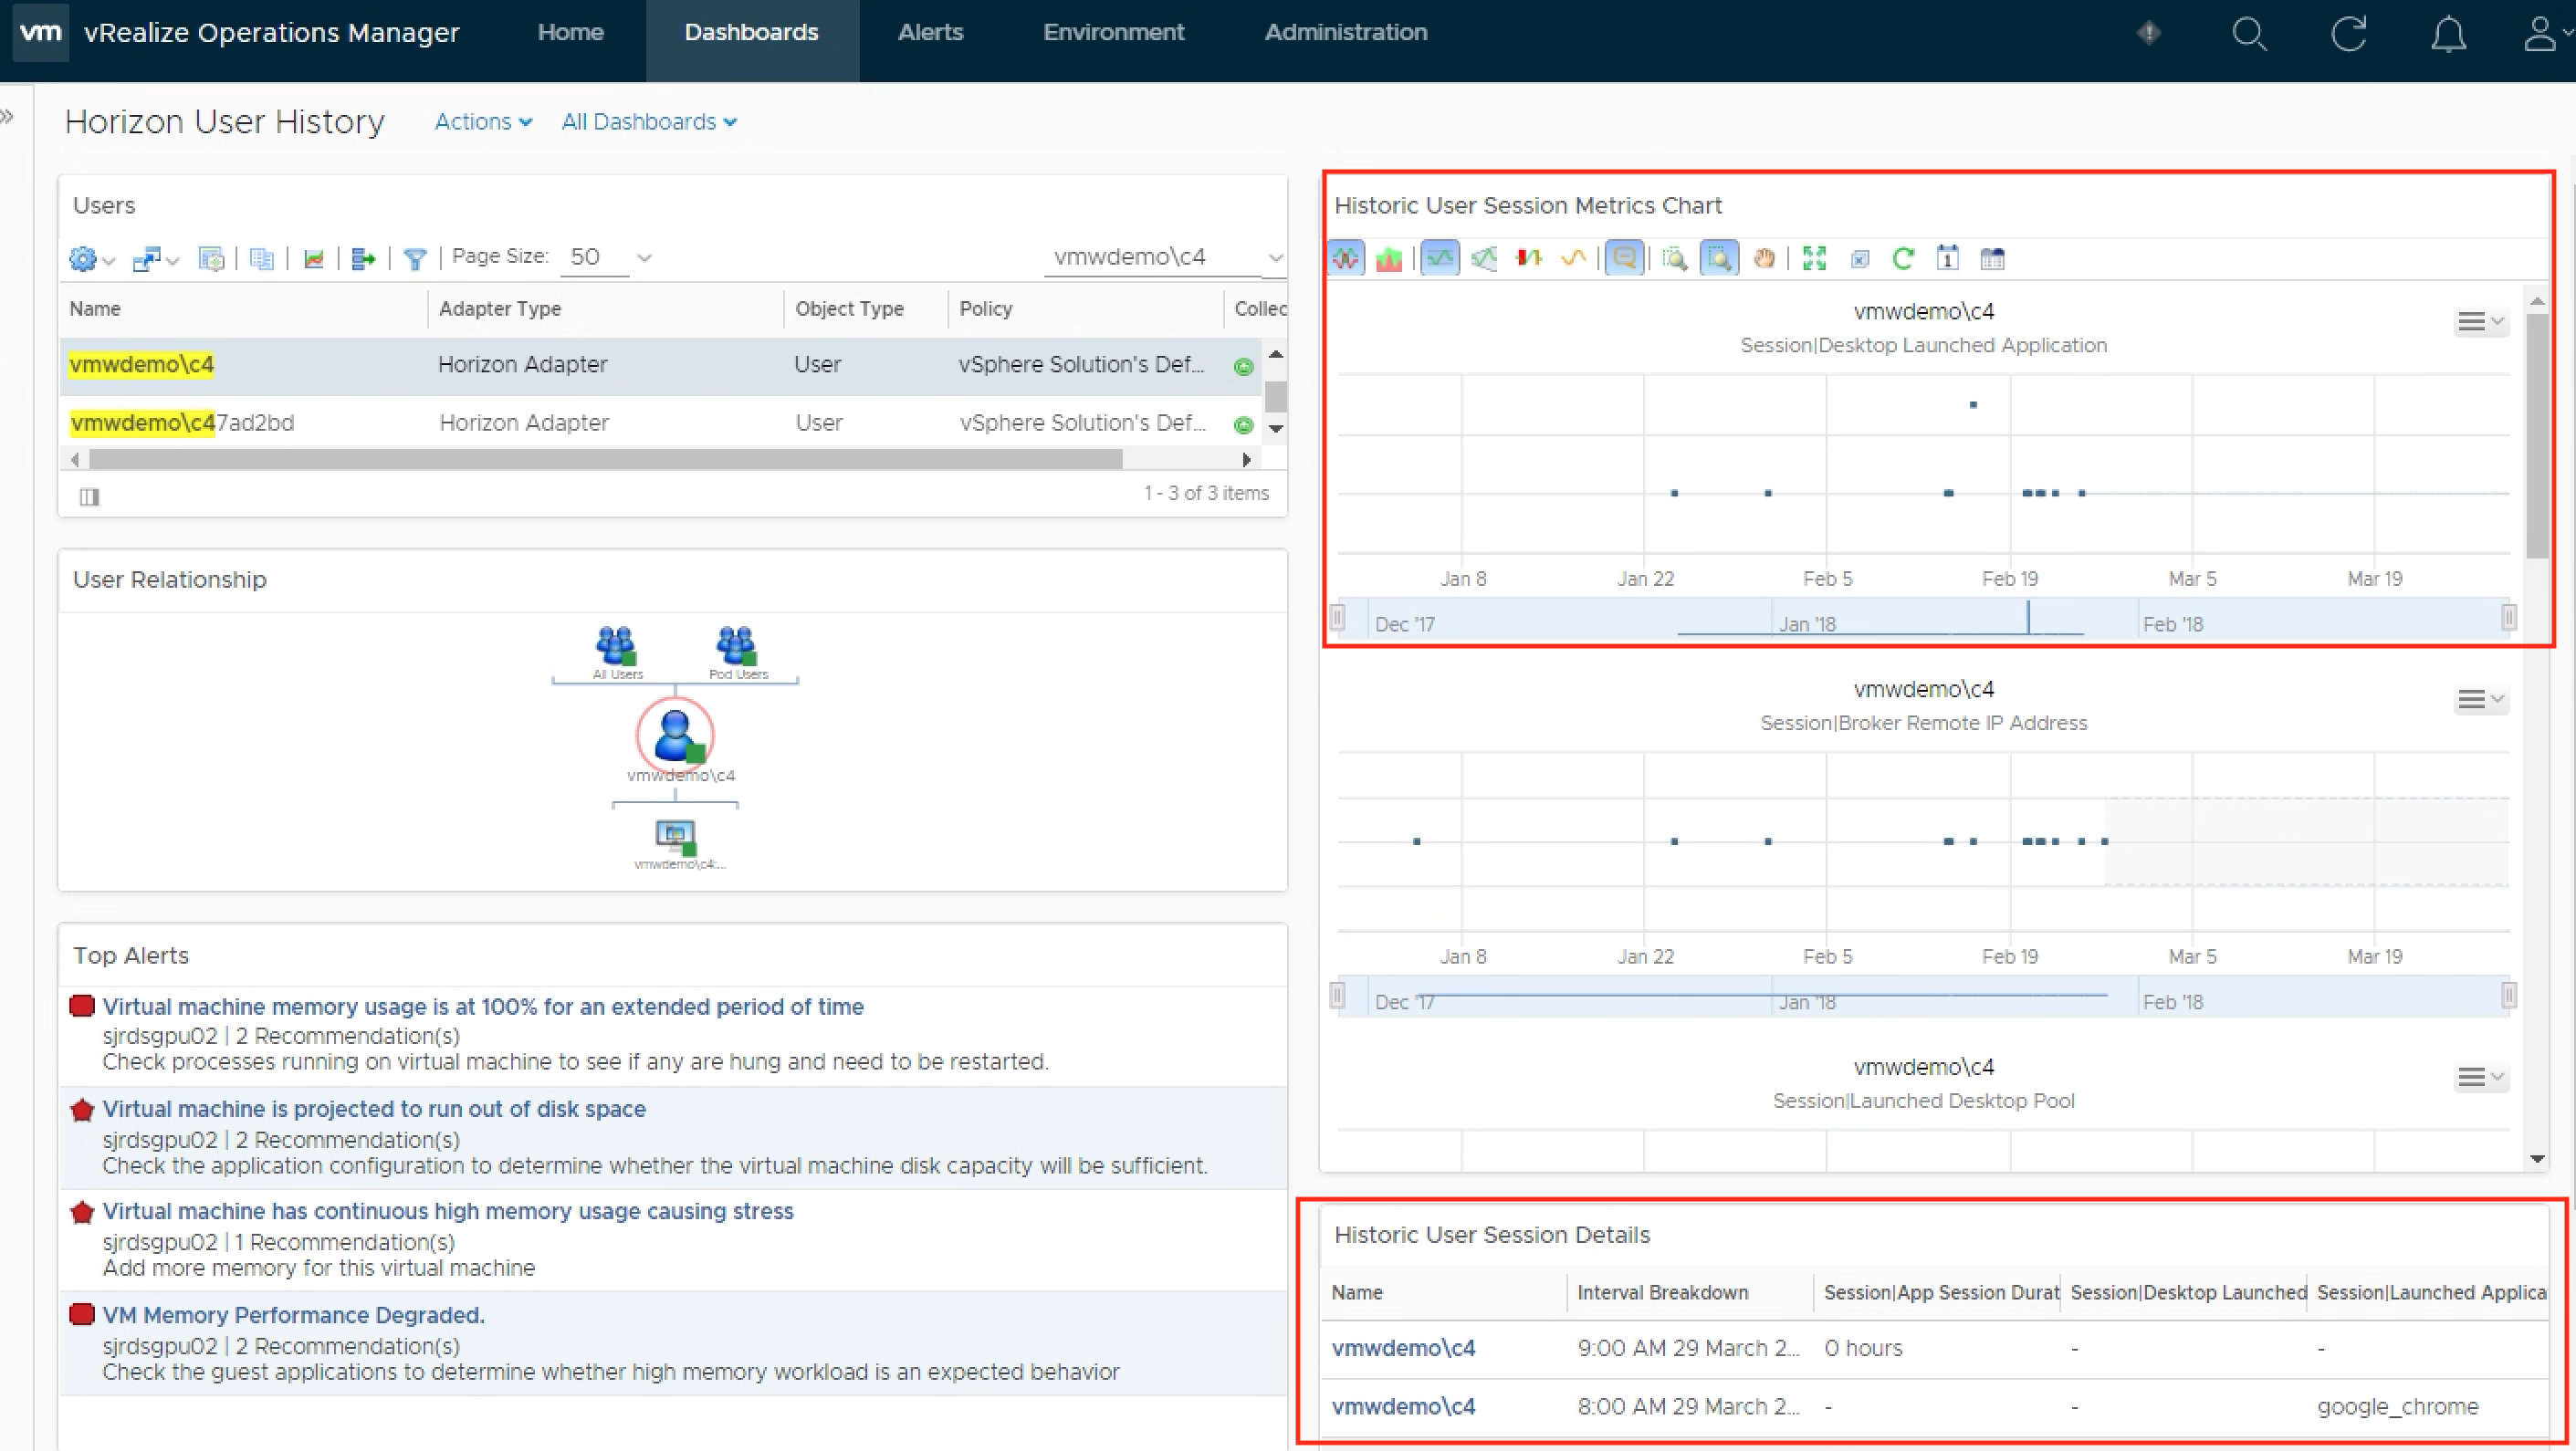
Using the Horizon User History Dashboard:
First navigate to the Dashboard from the main menu:
Click in the user search box to enter the Active Directory user name, and click Enter to lookup the individual user. Click the user’s name from the list, and the Dashboard will update to display the user’s historic metrics.
Scroll to search through the available metrics on the user’s session. By mousing over a data point in the provided charts, you will see the detailed information captured.
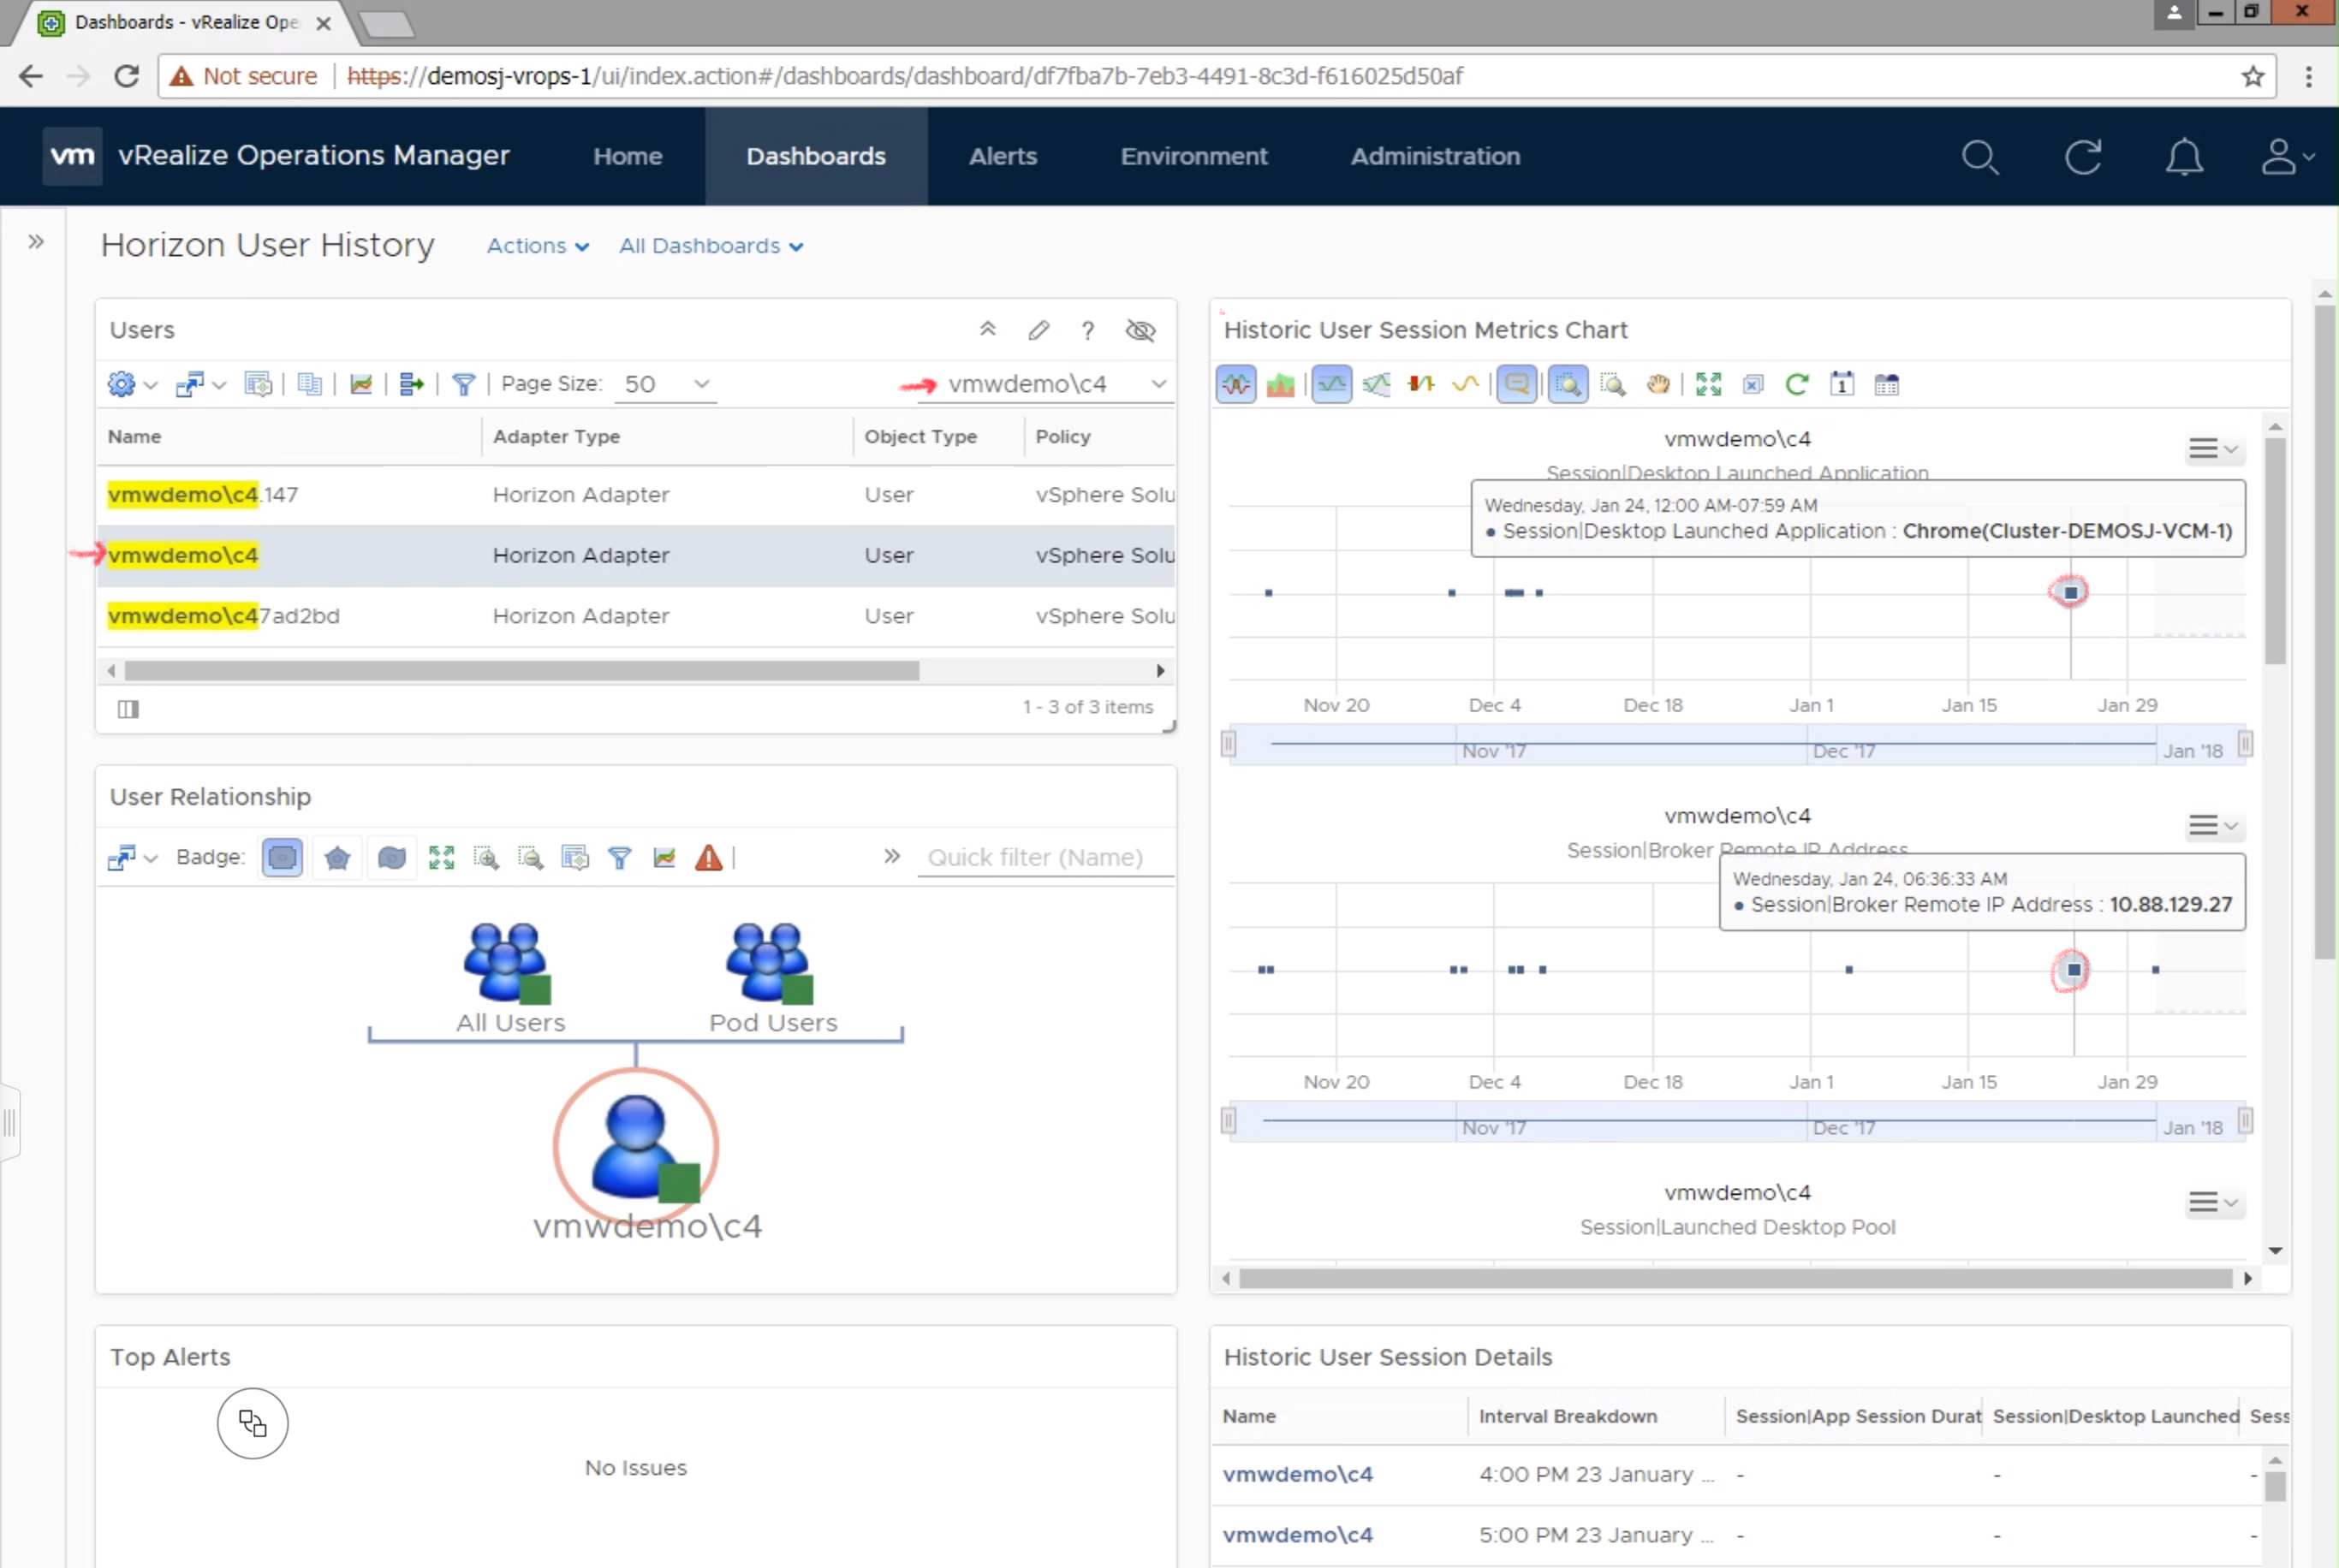
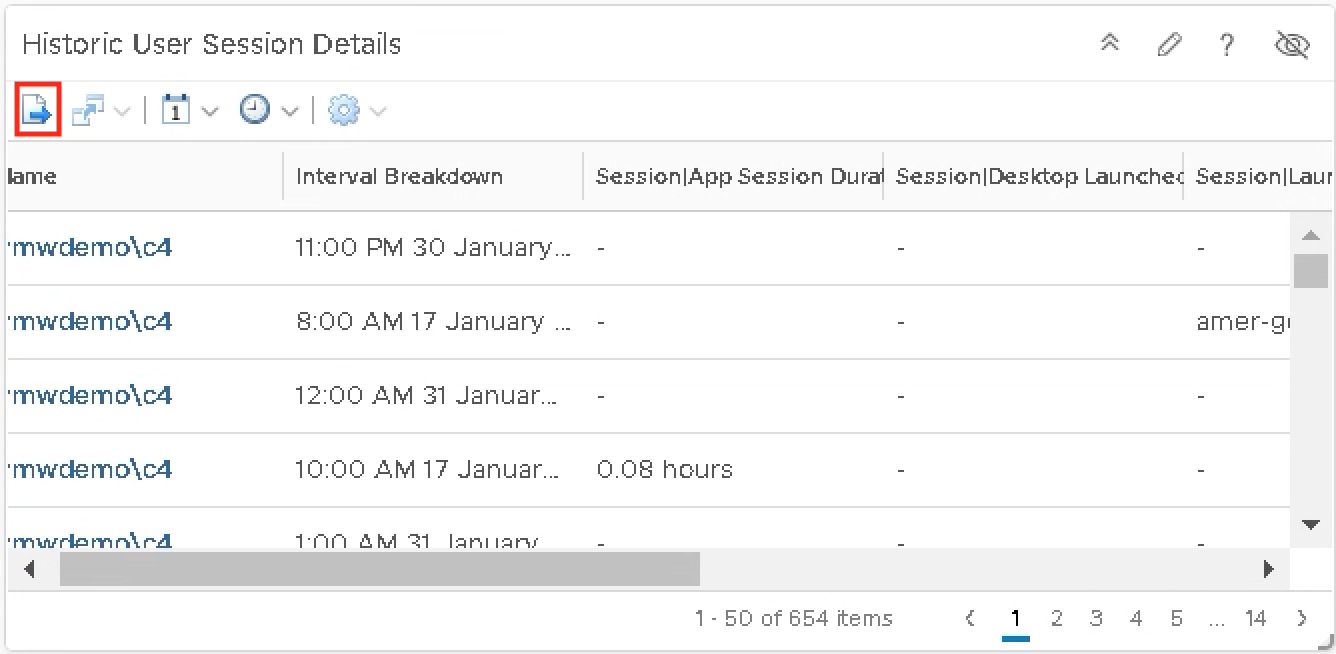
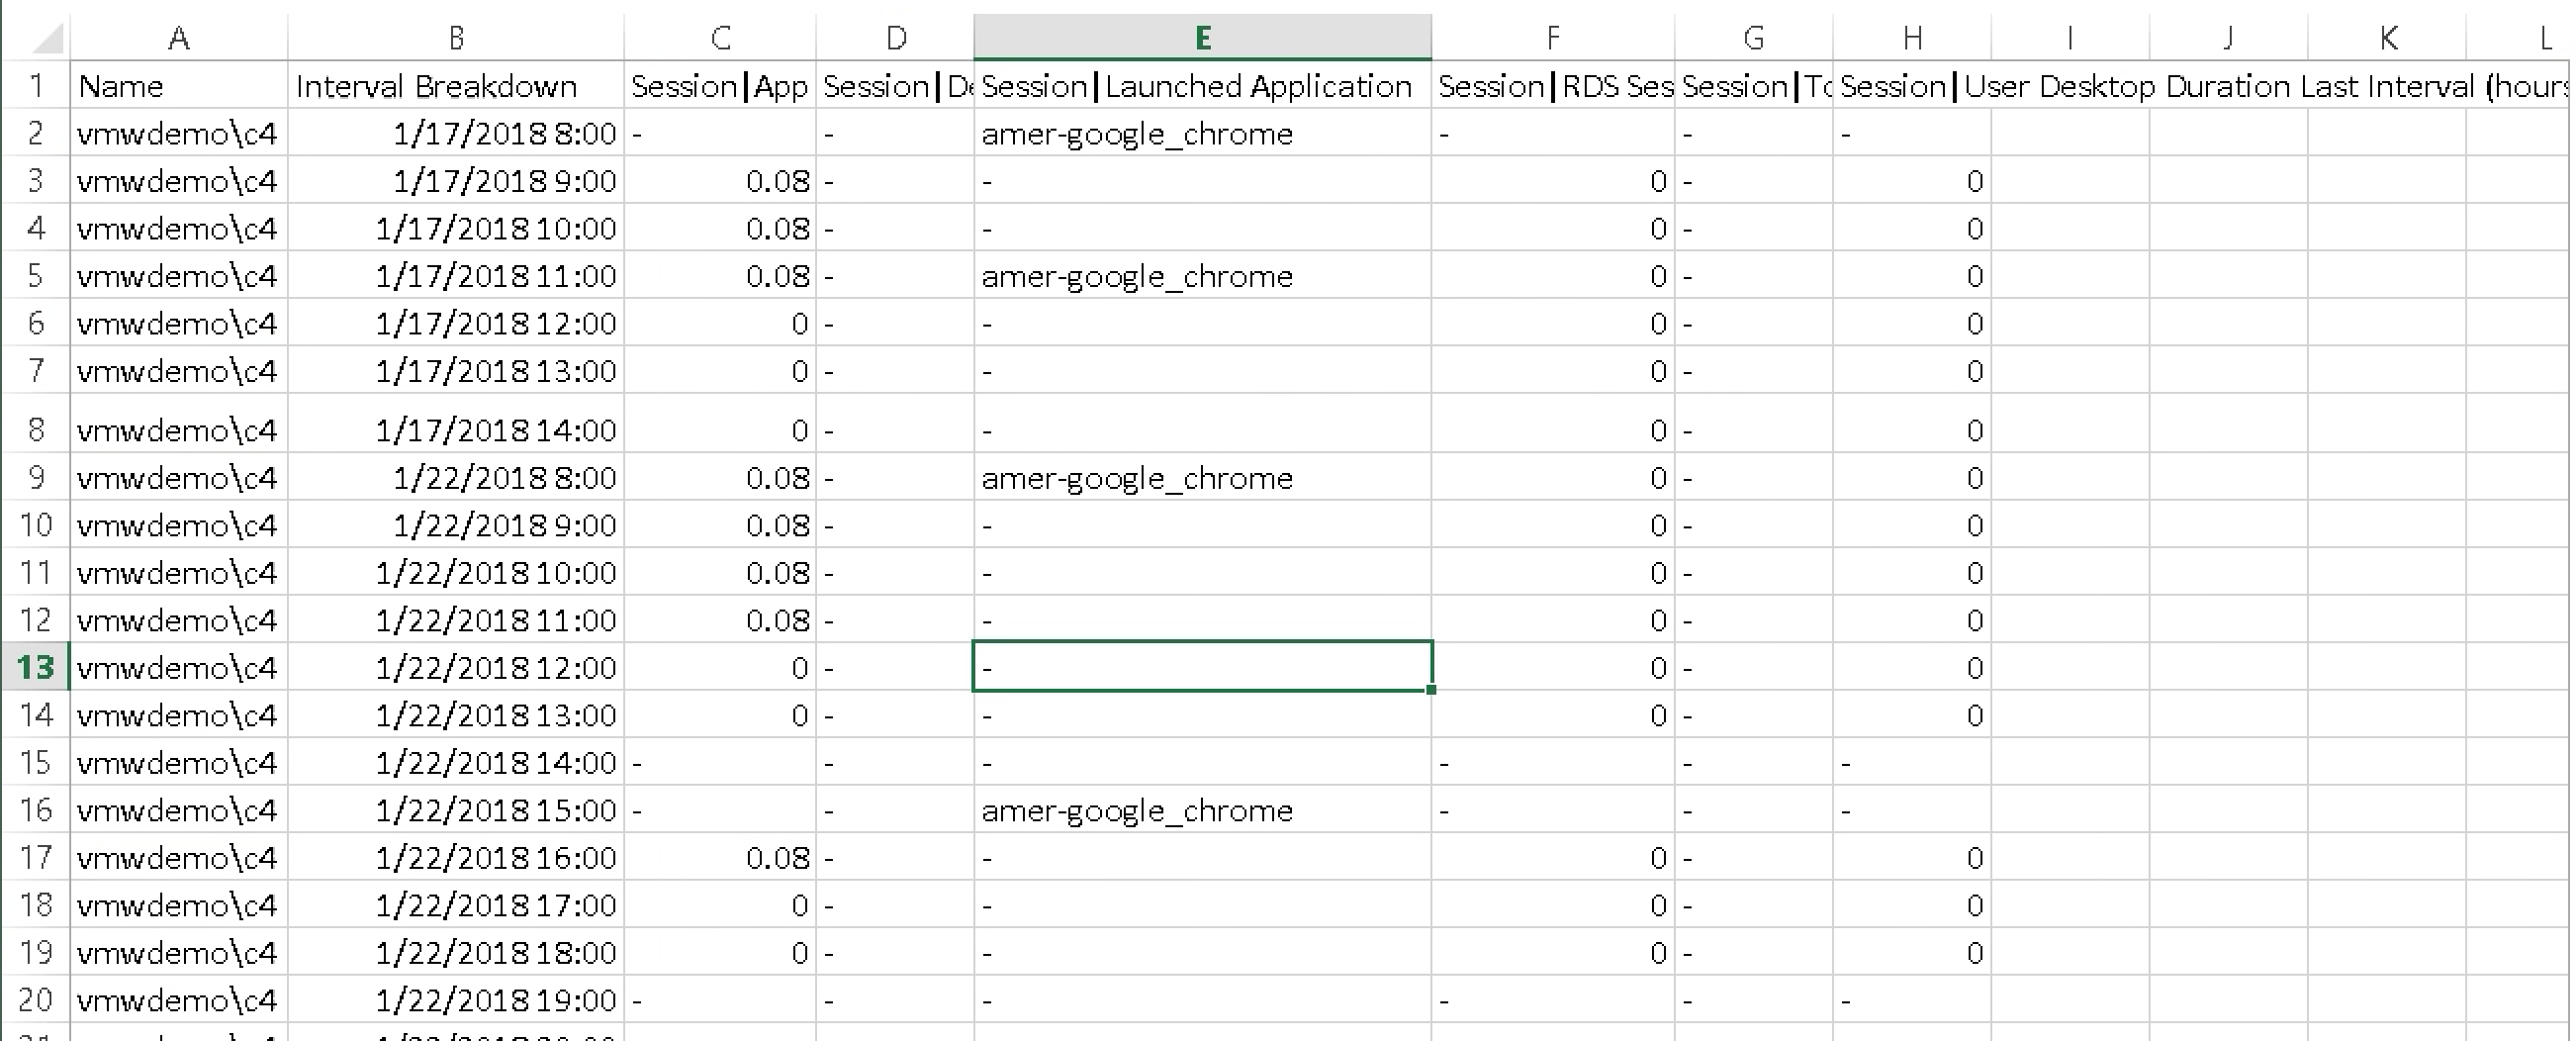
The Historic User Session Details widget provides a summary timeline table view of the data that can be exported into a CSV file:
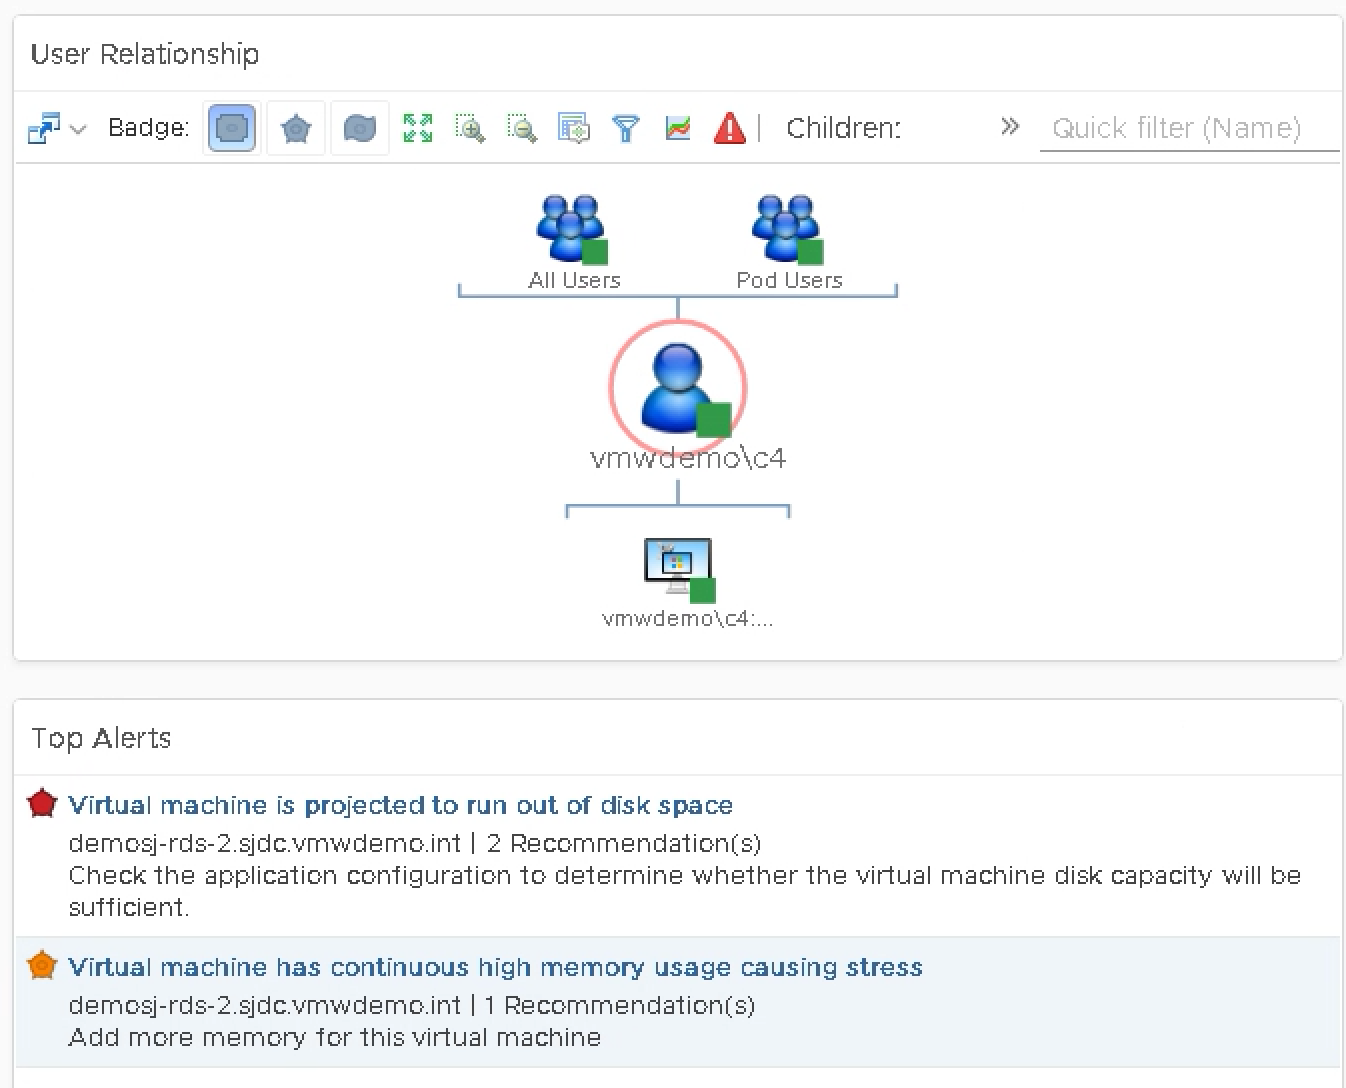
The Related Objects widget shows the health of the current/Active session of the user. The Alerts Widget shows any active alerts for the user as well.
This content is provided “as is”; however, please feel free to provide feedback on the content and how it could be improved for future updates.
vROPs for Horizon Horizon Help Desk Dashboard Overview
This video is a quick demonstration of how to leverage the latest vROPs for Horizon Help Desk dashboard to quickly find and troubleshoot user session performance issues within a Horizon View environment.
Please leave feedback or comments for any additional training videos that you would like to see posted in upcoming blogs.
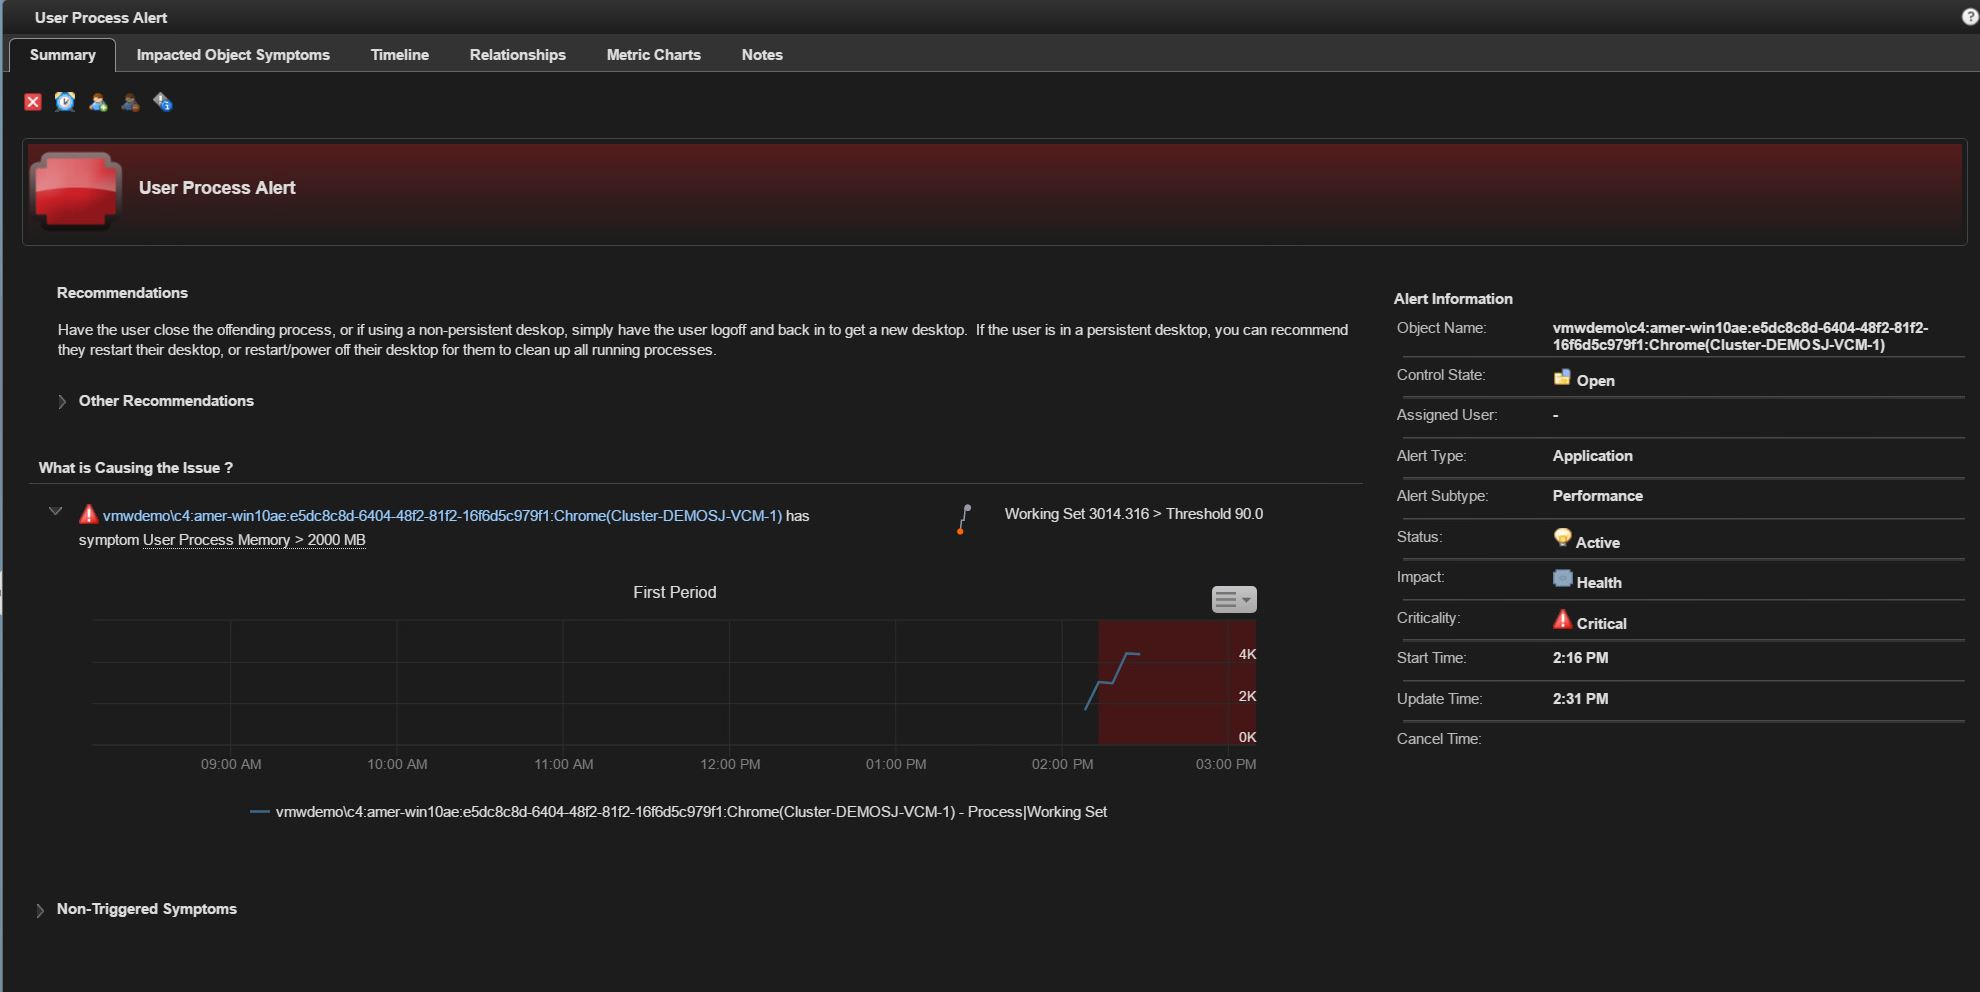
vROPs for Horizon – User Application Threshold Alerts
In the latest vROPs for Horizon 6.4, the ability to track user launched desktop applications was added. (See 6.4 release notes) This new addition gives customers the capability of providing reports of which users have launched specific windows applications over time.
A lesser known capability, is that this new feature also gives customers the ability to alert on these same processes when they have reached a certain CPU and Memory threshold. To take advantage of this feature, the vROPs administrator needs to perform the following steps:
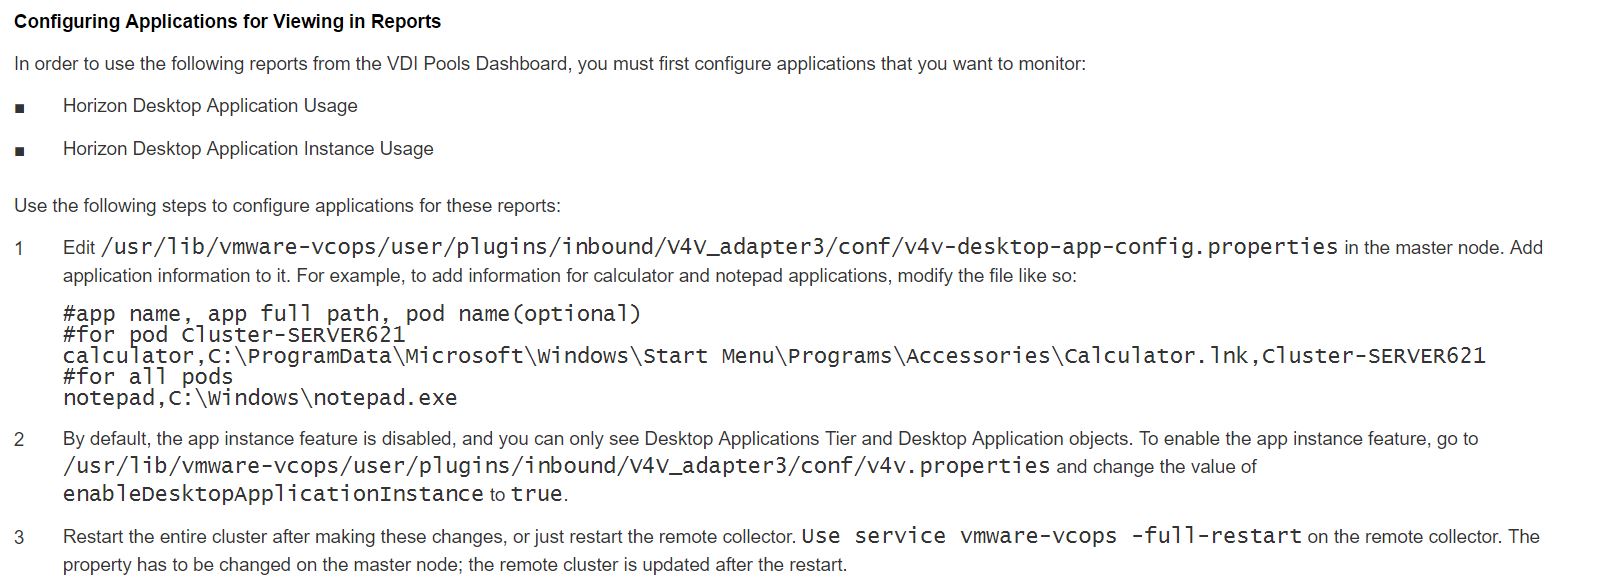
- Add the specific processes that you want to monitor to your vROPs for Horizon configuration. (Process Outline Click Here).
- Create a new alert, and the define the appropriate CPU and Memory symptom thresholds that you want to track.
A sample alert can be downloaded using the following link: User Process Alert.xml
To import my sample Alert and customize it for your environment, follow these steps:
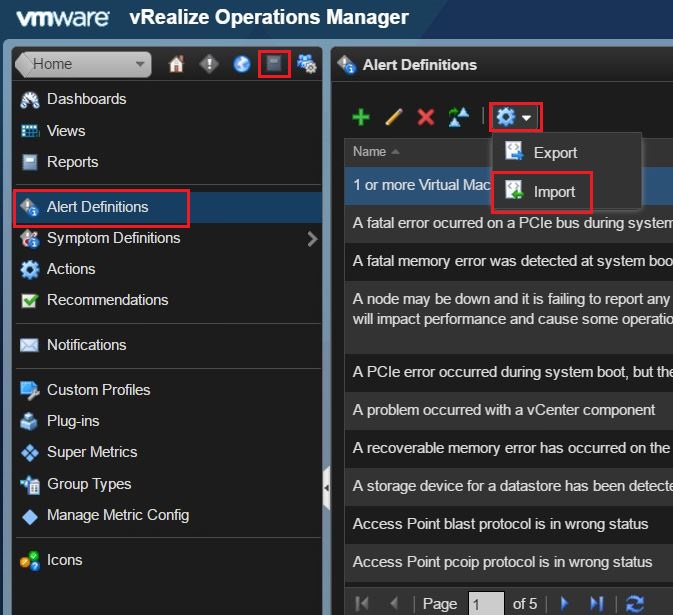
- Navigate to Content-> Alert Definitions, and click Import.
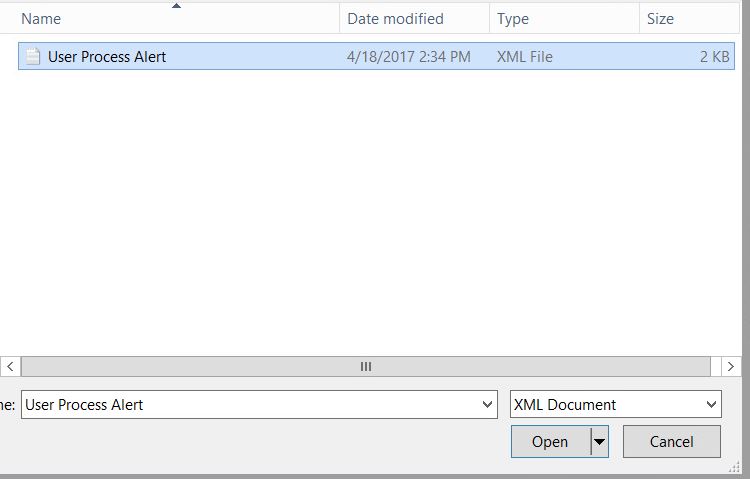
- Click Browse and select the User Process Alert.xml file previously downloaded, and click Open to import.
- Confirm that the Alert Definition was imported successfully. If the alert was skipped for some reason, you can re-attempt the process and select the “Overwrite existing Alert Definition” option before clicking Browse and opening the file.
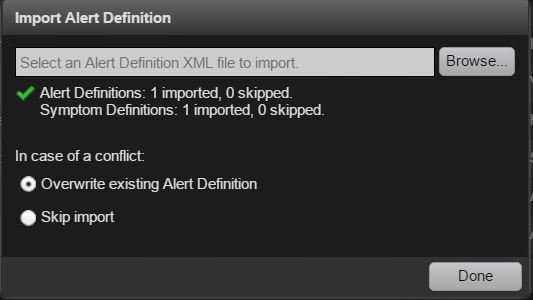
- Click Done to finish the import process.
Congratulations! You now have visibility into in-guest processes, and how they are impacting the users of your Horizon View environment.

Self-service Published Applications via Workspace ONE + vRA/vRO
This is a quick demo video showing Self-Service Published Application requests, via the Workspace ONE portal integrated with vRA+vRO.
How to deliver a persistent desktop experience with mandatory profiles and UEM
Disclaimer:
This document is not intended to show the complete process of how to setup and install UEM, or highlight all of the possible AD policies that can be leveraged for customer deployments. It is intended to show a simplified process of turning a Default Windows profile into a Mandatory profile, recommend GPO polices to simplify management and clean up of profiles, and redirect key folders to keep user data after logoff. UEM will be used to deliver as well as capture user application settings.
App Volumes Notice: If leveraging this methodology for an App Volumes deployment, make sure that the agents are installed in the correct order. The order of installation is View Agent, UEM agent, and App Volumes respectively.
** As new versions of UEM are released, some steps maybe simplified over time.
Creating the Mandatory Profile:
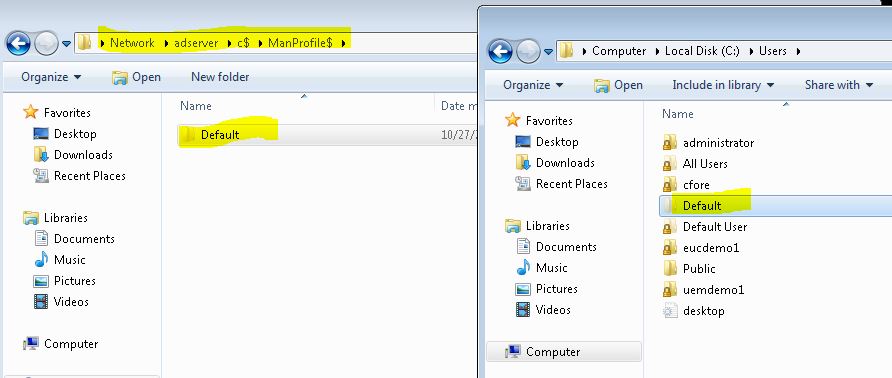
Step 1: From a Windows 7 Desktop, navigate to C:\users\.
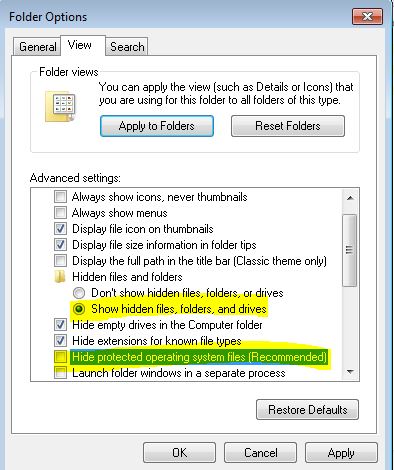
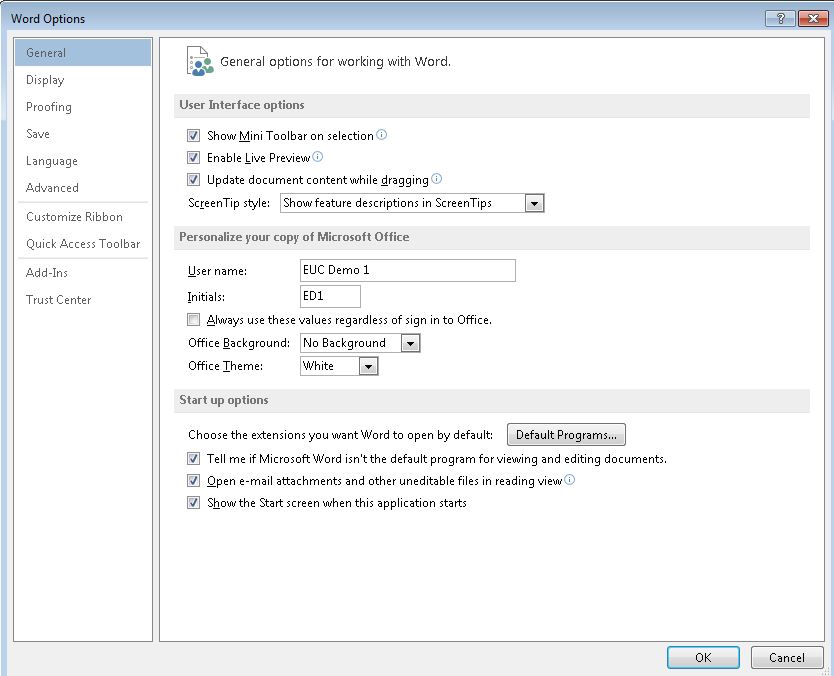
If the Default profile folder is not visible, change your default folder view options. Choose Show hidden files, folders, and drives, and uncheck Hide protected operating system files (Recommended).
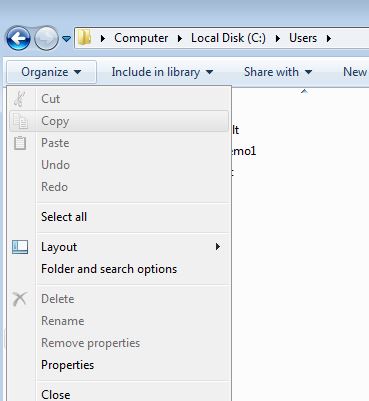
Step 2: Copy the Windows 7 Default folder to your Mandatory profile network share.
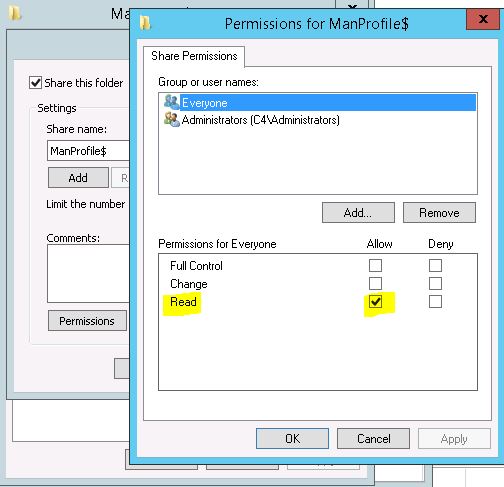
Make sure the share is set for Everyone to have a minimum of Read access.
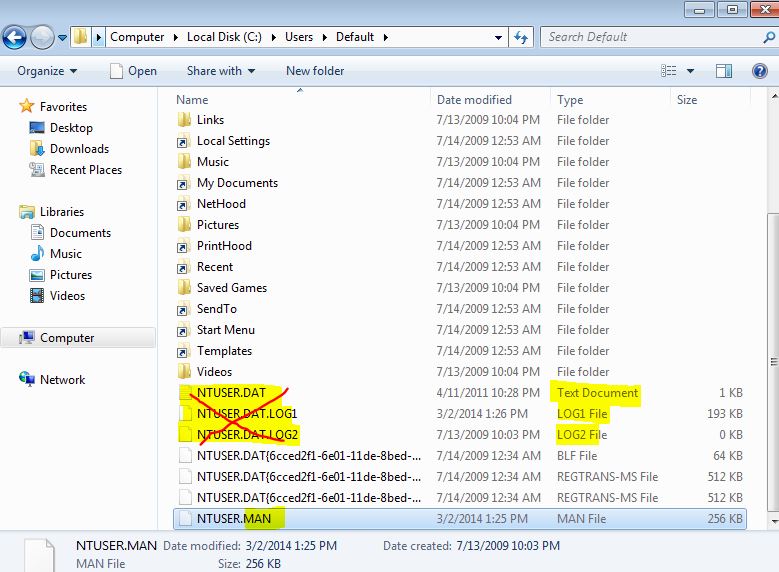
Step 3: Open the Default folder copied to your network share. Rename ntuser.dat to ntuser.man. It is also recommended to delete the following files:
- DAT Text Document
- DAT.LOG1 LOG1 File
- DAT.LOG2 LOG2 File
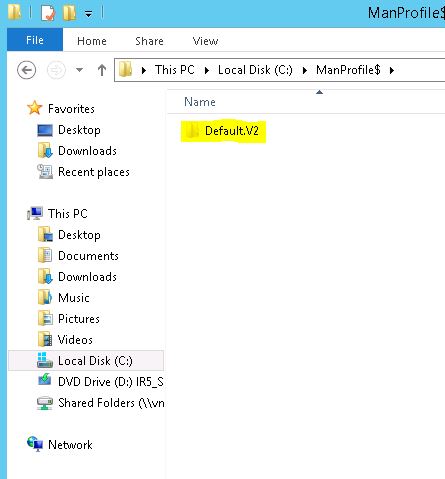
Step 4: Rename the Default folder to Default.V2 for Windows 7+ OS users.
Optionally you can create a copy of the folder and leave the Default name without the .V2 for XP users.
Create Mandatory Profile Summary:
At this point you should have clean mandatory profile that was generated from the Default profile available in Windows 7. That profile was copied to a network share, and we verified that the Everyone group has the Read permissions on that share. The ntuser.dat file was renamed to ntuser.man, and the extra files were deleted. The folder was renamed to Default.V2 for Windows 7 + OS users.
By leveraging the Default profile, we have removed a lot of steps typically involved in the creation of a mandatory profile. This will also help to speed up user logins, as well remove additional variability from the desktop environment.
Enabling Active Directory group policies to leverage the Mandatory profile and folder redirection.
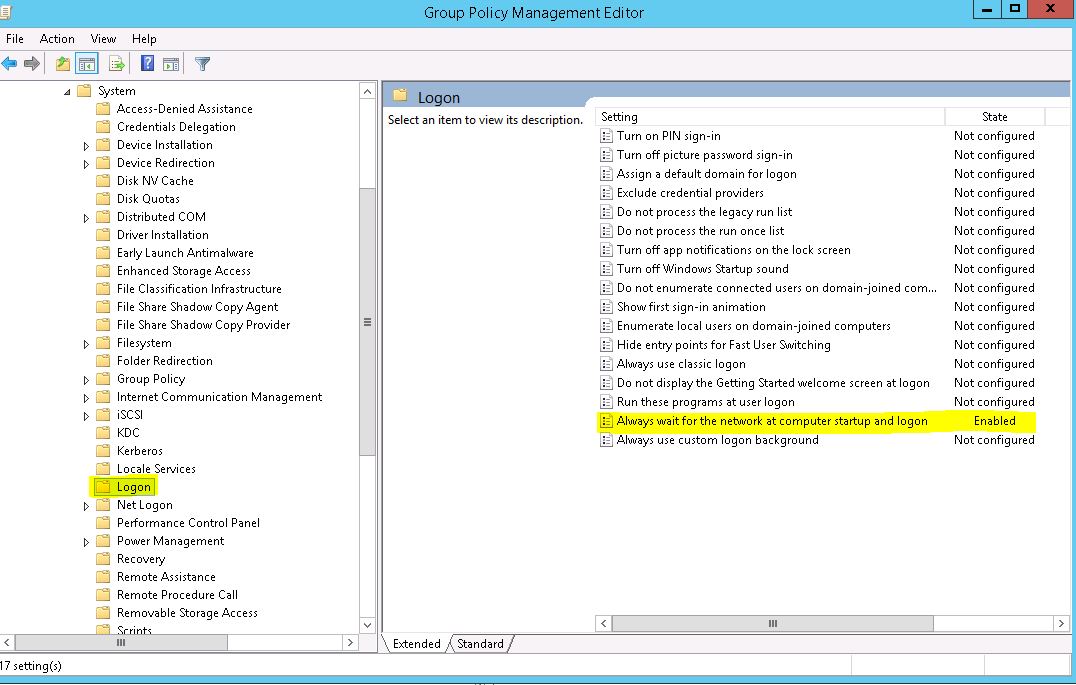
Step 1: Set the OU Computer Configuration policy to “Always wait for the network at computer startup and logon” to Enabled.
In the group policy editor, navigate to Computer Configuration-> Policies -> Administrative Templates-> System-> Logon, and change the policy setting to Enabled.
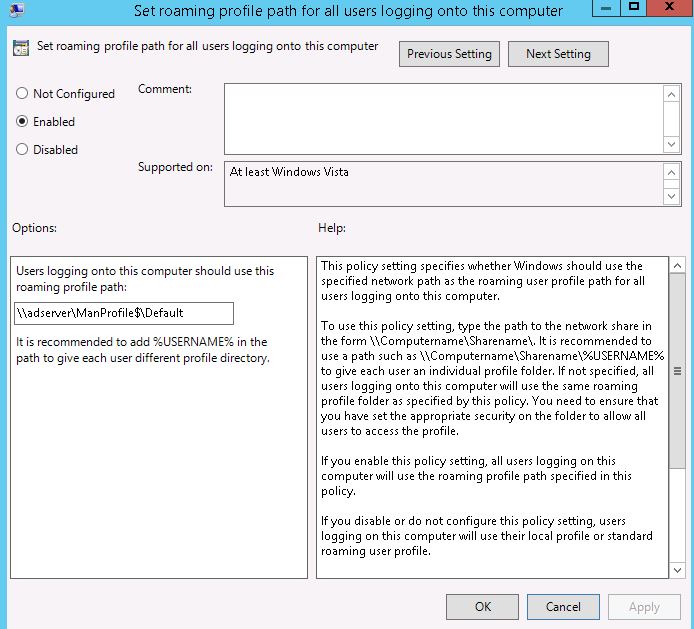
Step 2: Edit the Computer User Profiles policy, “Set roaming profile path for all users logging onto this computer” to Enabled, and specify the network share path.
In our example the share path is\\adserver\ManProfile$\Default. **Do not include the .V2 in the folder path.
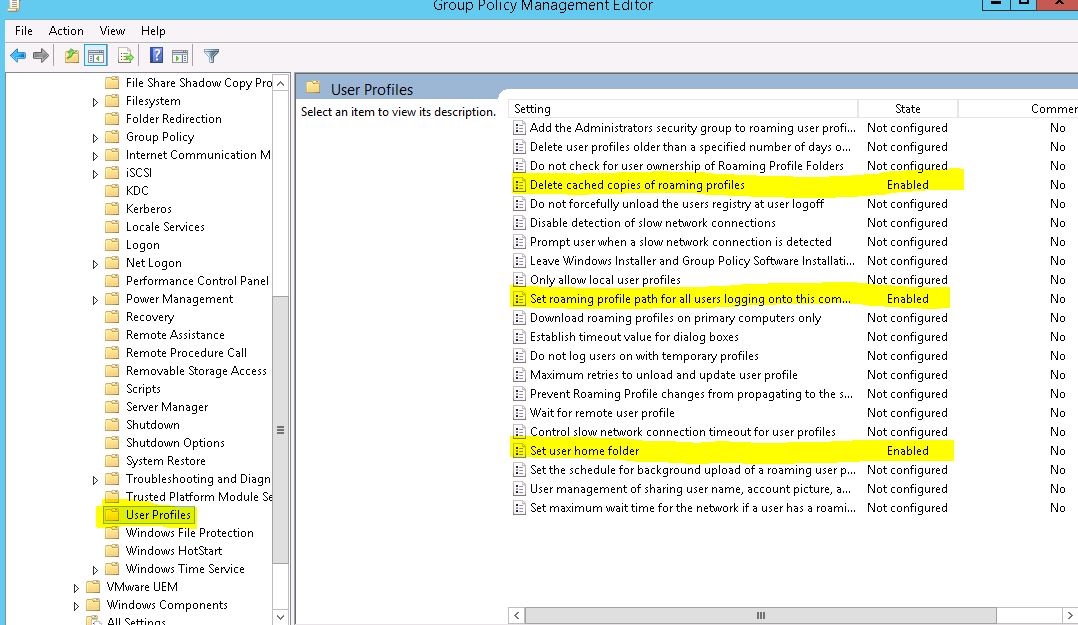
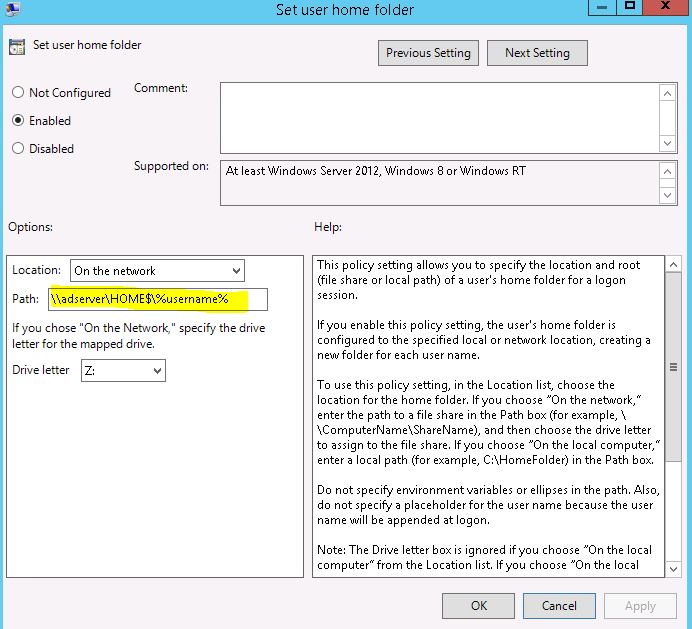
Step 3: Edit the Computer User Profiles policy to configure the user’s home directory path.
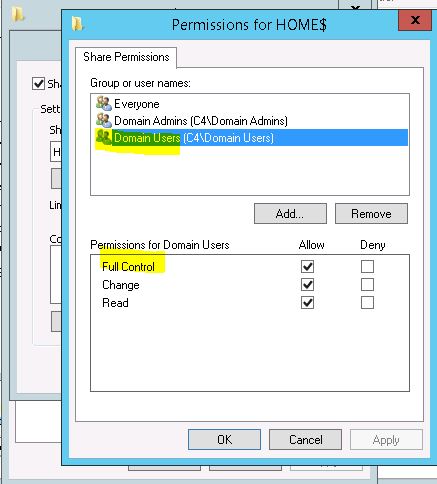
In our example the path is \\adserver\HOME$\%username%. You will need to make sure to set the proper sharing and security settings, so that the users can properly access their home folder. This process is not covered in this document, but can be found through various resources. Domain Users should have Full Control access to the share as shown in the pictures below.
Step 4: Optionally you can set the Computer policy “Delete cached copies of roaming profiles” to Enabled.
This feature will make sure the users profile folder is automatically deleted on logoff. If you are implementing a non-persistent virtual desktop environment and the refresh on logoff feature is enabled, this feature may be considered redundant, as the refresh process will automatically get rid of the user’s profile folder.
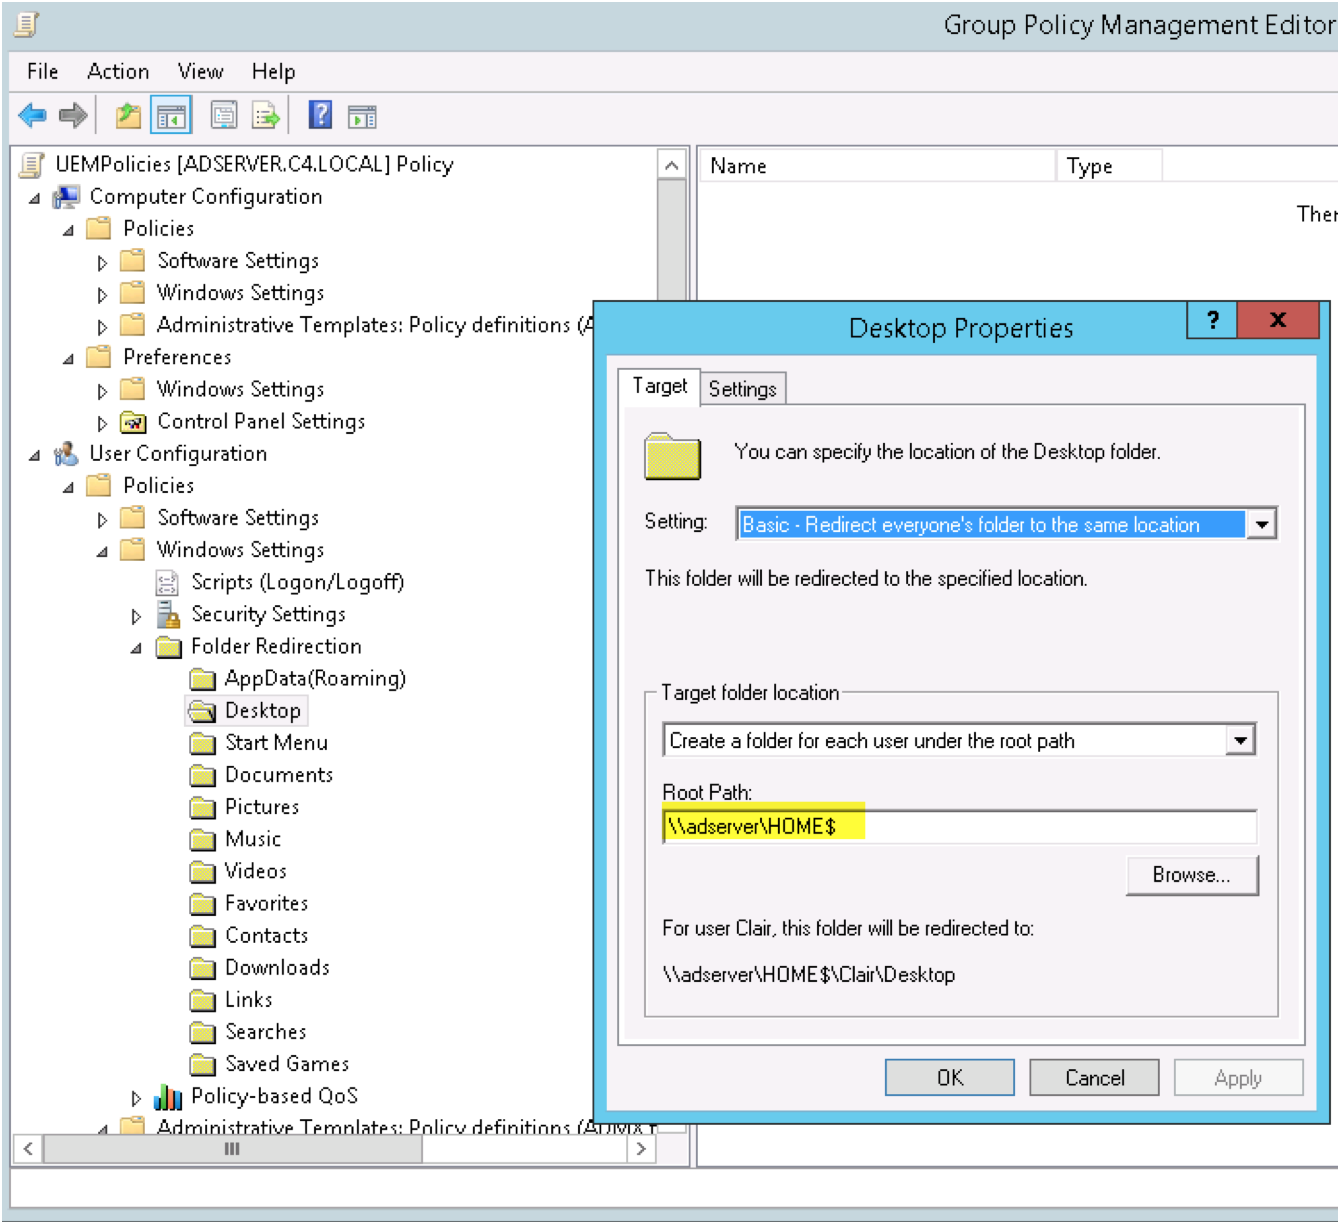
Step 5: Now we must set the User Configuration policy to redirect the users Desktop and Documents.
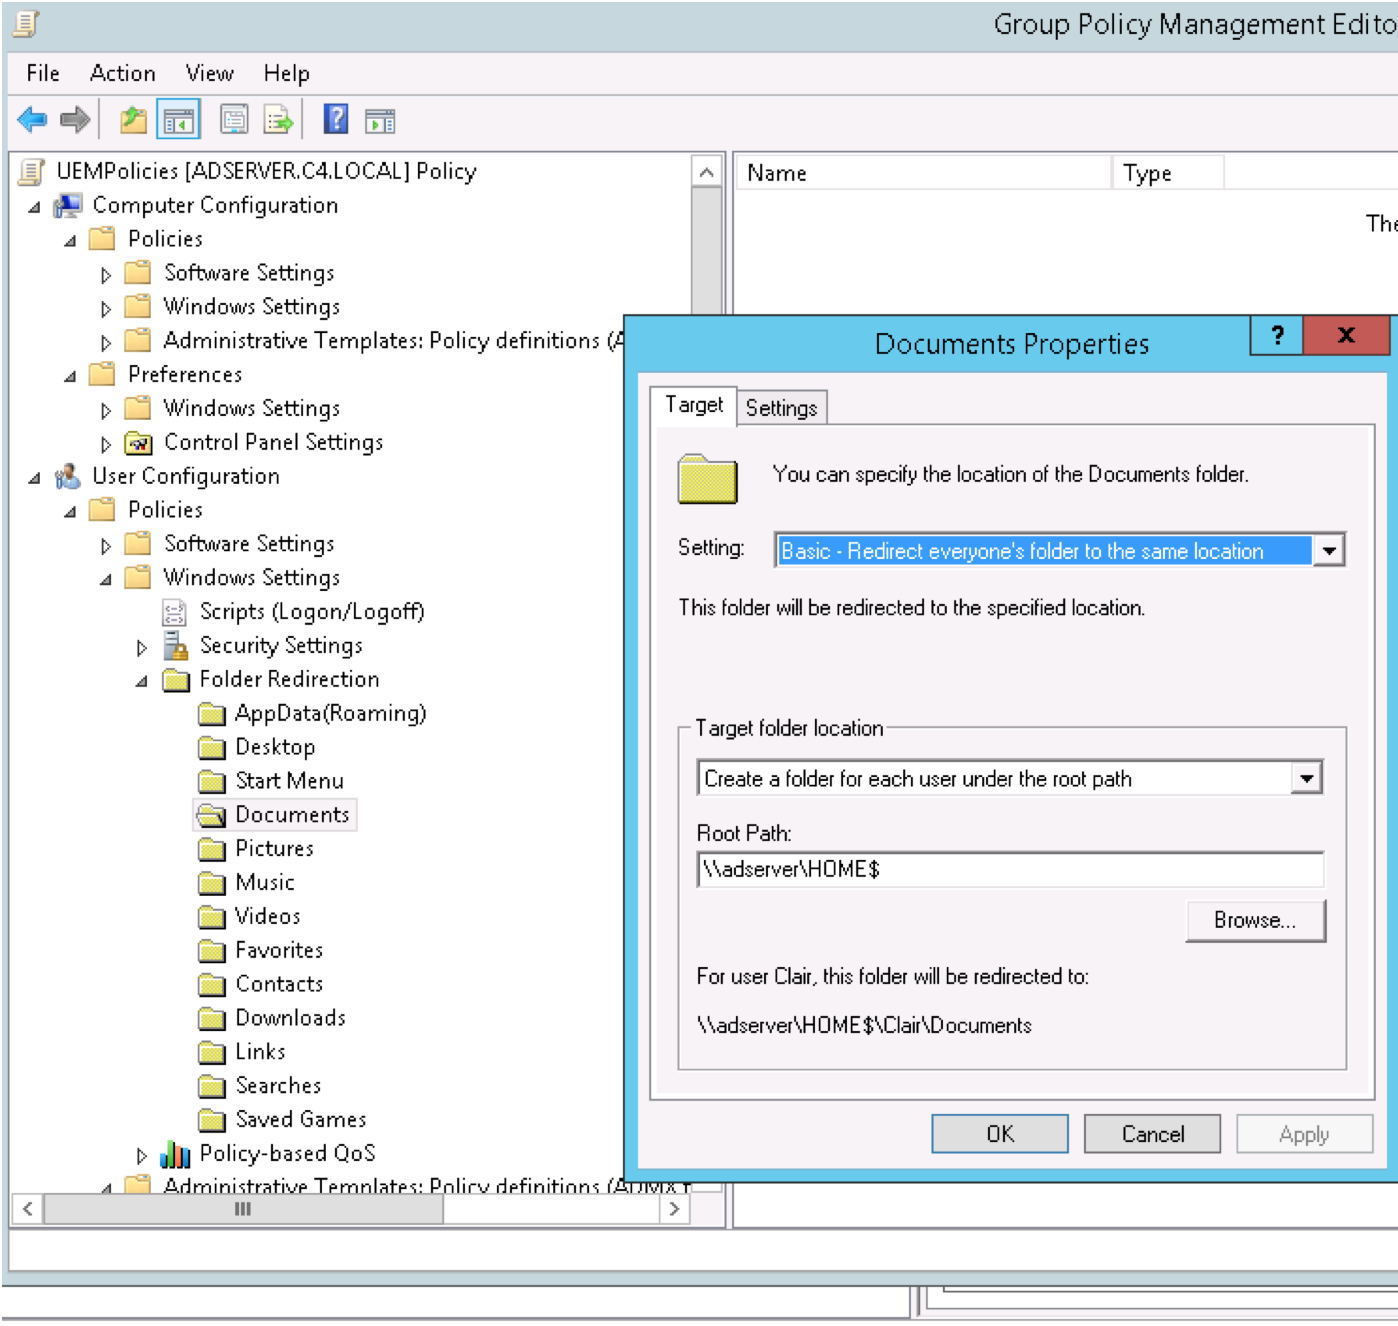
In the GPO Management Editor, navigate to User Configuration->Policies-> Windows Settings-> Folder Redirection-> Desktop. Right-click and select properties. Under Setting: select Basic – Redirect everyone’s folder to the same location. Under Target folder location, make sure that Create a folder for each user under the root path is selected. Set the Root Path to the users Home$ directory share. In our case the share is \\adserver\HOME$
Step 6: Perform the exact same procedure as above for the Documents setting.
Enabling AD GPO policies Summary:
At this point we have enabled multiple Computer policies for Network Logon, as well as User Profiles. The policies tell our computer to wait for the network at logon, and when a user logs in, force them to use the mandatory profile we created in part one.
We also specified that we want to redirect the user Desktop and My Documents to a user network HOME$ share. This will allow changes made to the Desktop, and files added to My Documents to follow them between desktops, whether they are physical or virtual.
Now we are ready to leverage UEM to deliver and maintain personalized app settings for the users.
Working with UEM to deliver a persistent experience:
This portion of the document assumes you already have UEM deployed in your environment. For guidance on installing UEM, see the UEM Install Guide in the Reference section.
Why Horizon UEM:
VMware UEM is able to deliver default or customized application settings directly to the user’s desktop session without leveraging a local or roaming profile. It also has the ability of capturing the user’s application settings changes, storing them directly to a file share without the need of a complicated database infrastructure, which allows it to have unlimited scalability. This capability dramatically simplifies the overall management of physical of virtual desktop environments, by removing the need to store and maintain user profiles to deliver application settings, as well as eliminating user profile corruption issues.
By storing the application settings outside of the user’s profile, this allows for seamless transitions between OS versions, as the profile compatibility variable is removed.
Application Personalization:
UEM leverages a whitelist approach to delivering and capturing user application settings. There is a built-in application list, that can easily be added to using the Application Profiler. Simply run the Application Profiler on a system that has the application installed, launch the application, and it will generate the necessary config files to import directly into UEM.
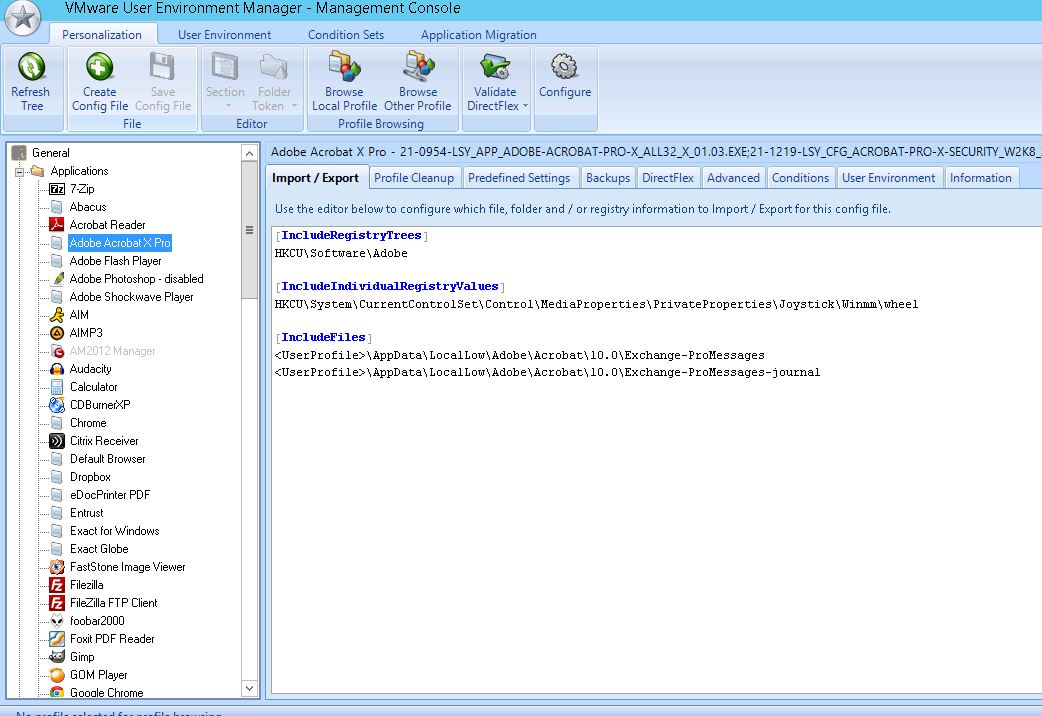
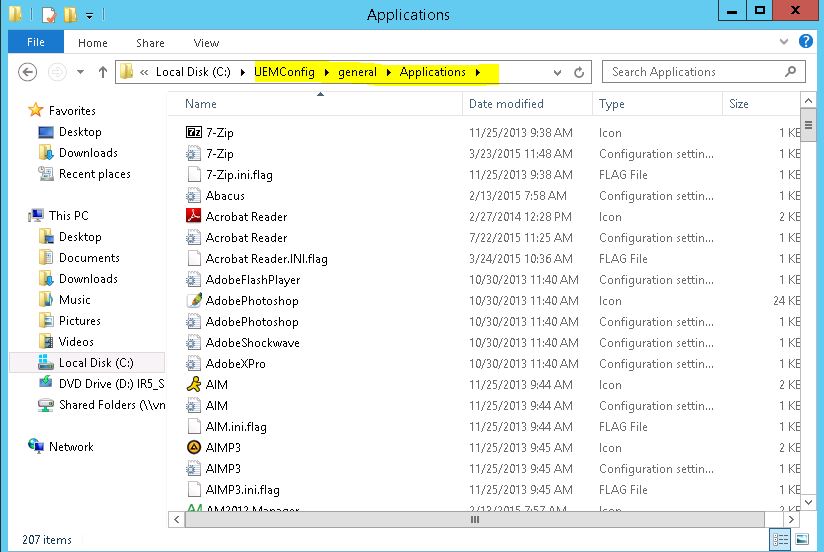
The config files will include registry entries and AppData folders where UEM will capture and push data to. If a user determines that his application settings are not being stored between sessions, you can run the Application Profiler, create the necessary configs, add them to the UEMConfig\general\Application folder, and their settings will then be captured.
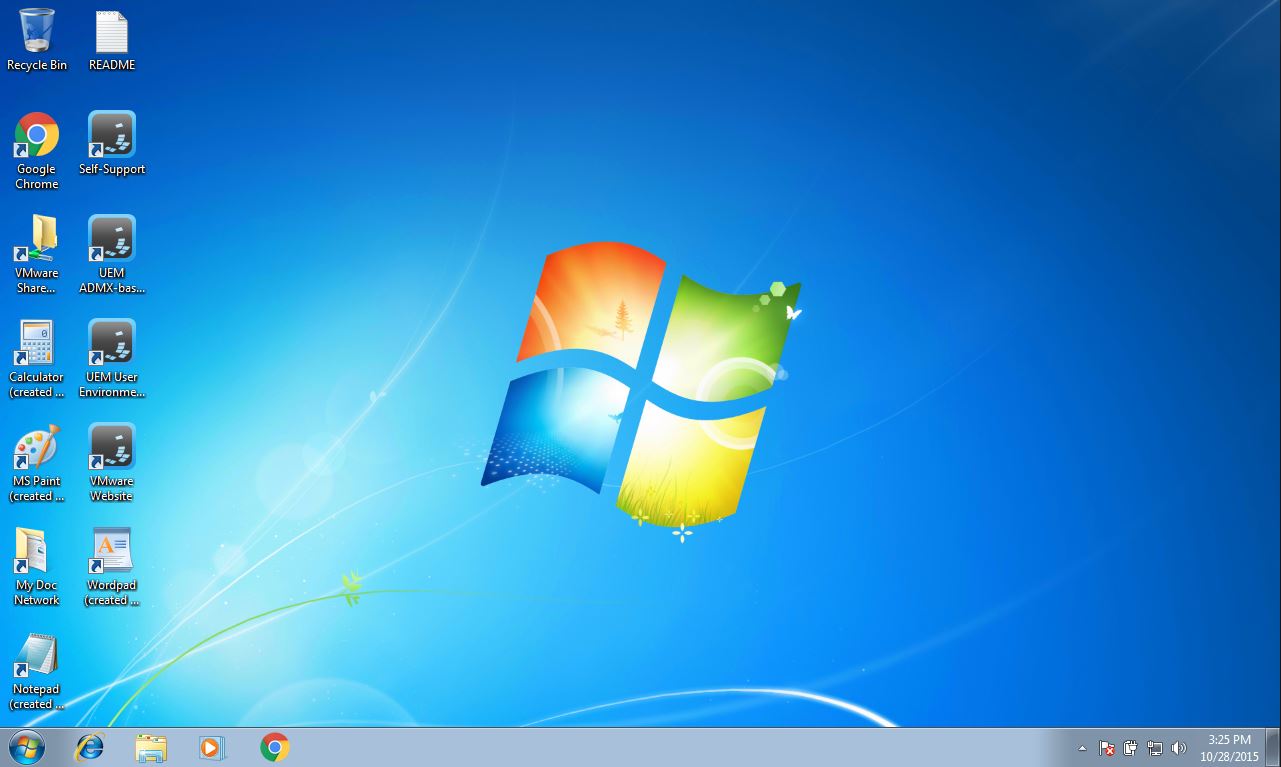
Mandatory Profile Demonstration:
In our example, we will demonstrate leveraging a mandatory profile created from a Windows Default profile, for a user who has never used MS Office 2013.
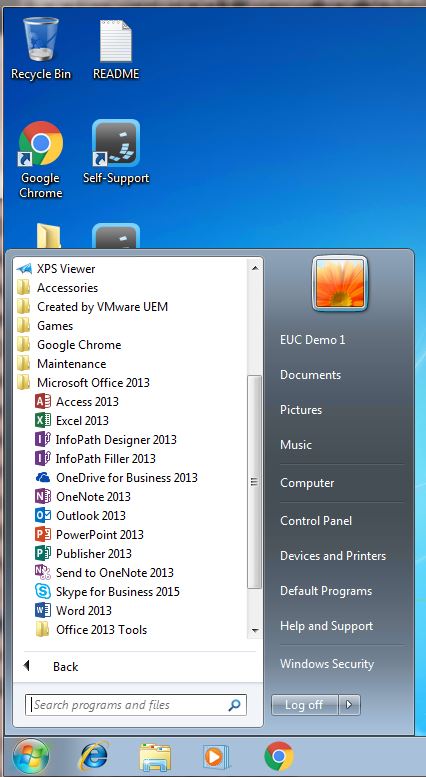
User logon:
Once the user has logged in, even though they are forced to use a Default Mandatory profile, UEM has dynamically provided them shortcuts to desktop.
Even though the user has never used Word, nor is there a profile to capture or store settings, launching word from the Start Menu reveals that the user name and AD account information is automatically populated into the application, even on first launch.
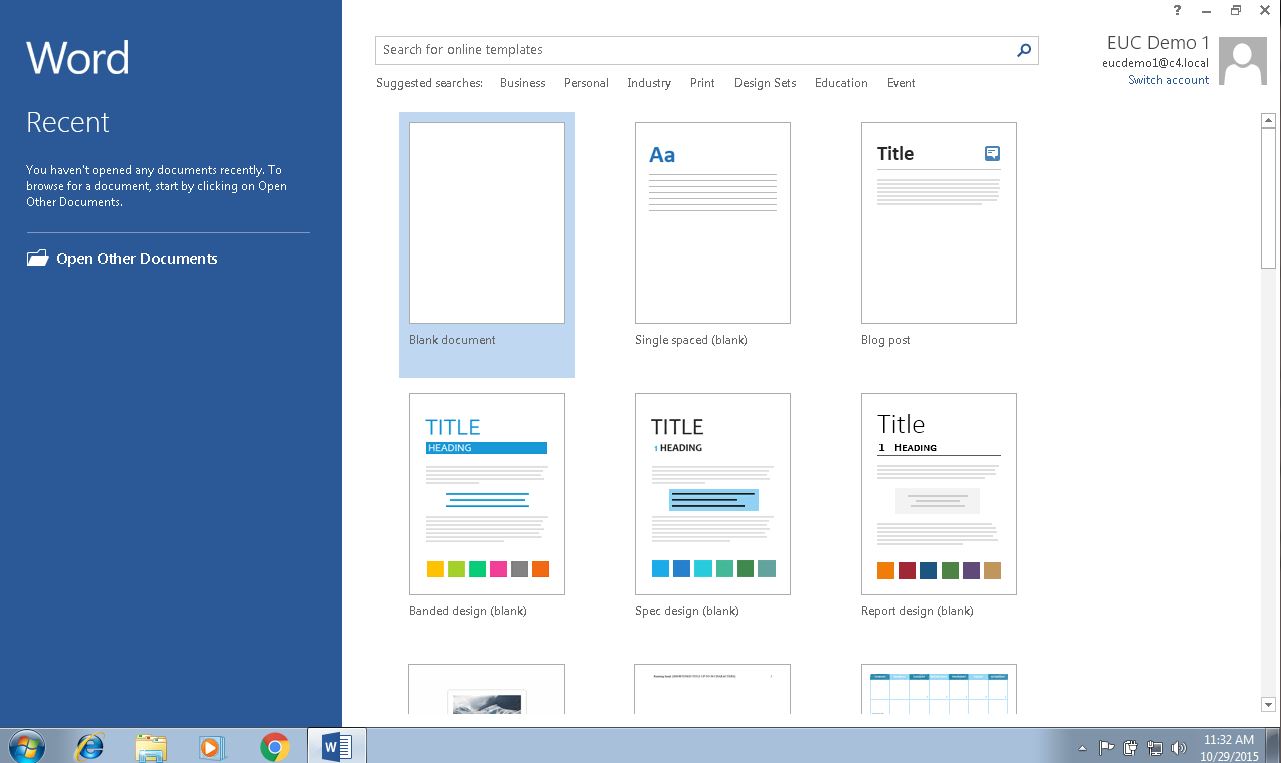
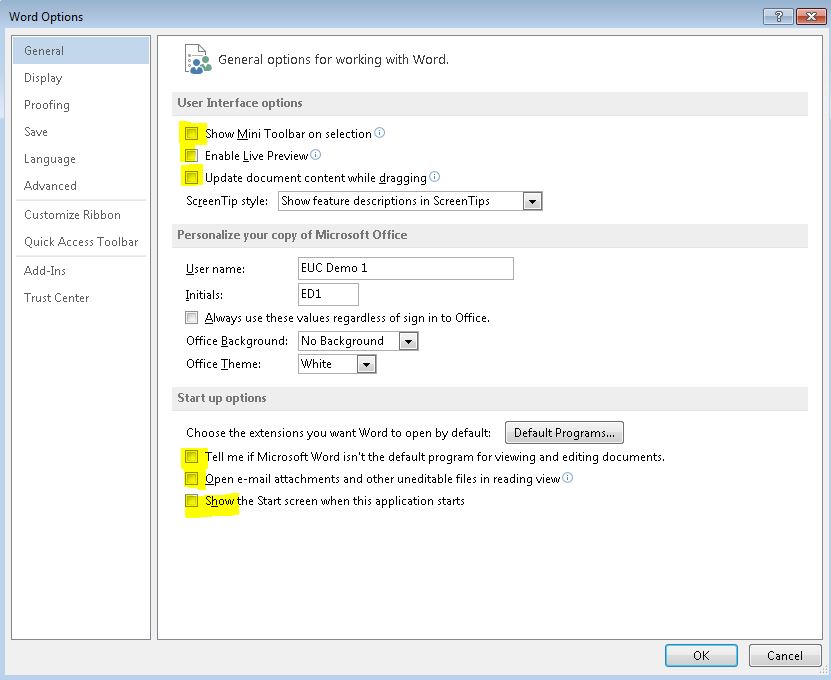
Unchecking the default options under General and logging off the machine, results in those options being stored into the User’s application settings share folder. On next logon, the unchecked General options remain for the user.
References:
User Environment Manager Administrator’s Guide: https://www.vmware.com/pdf/uem-870-admin-guide.pdf
Application Profiler Administrator’s Guide:
https://www.vmware.com/pdf/uem-870-app-profiler-admin-guide.pdf
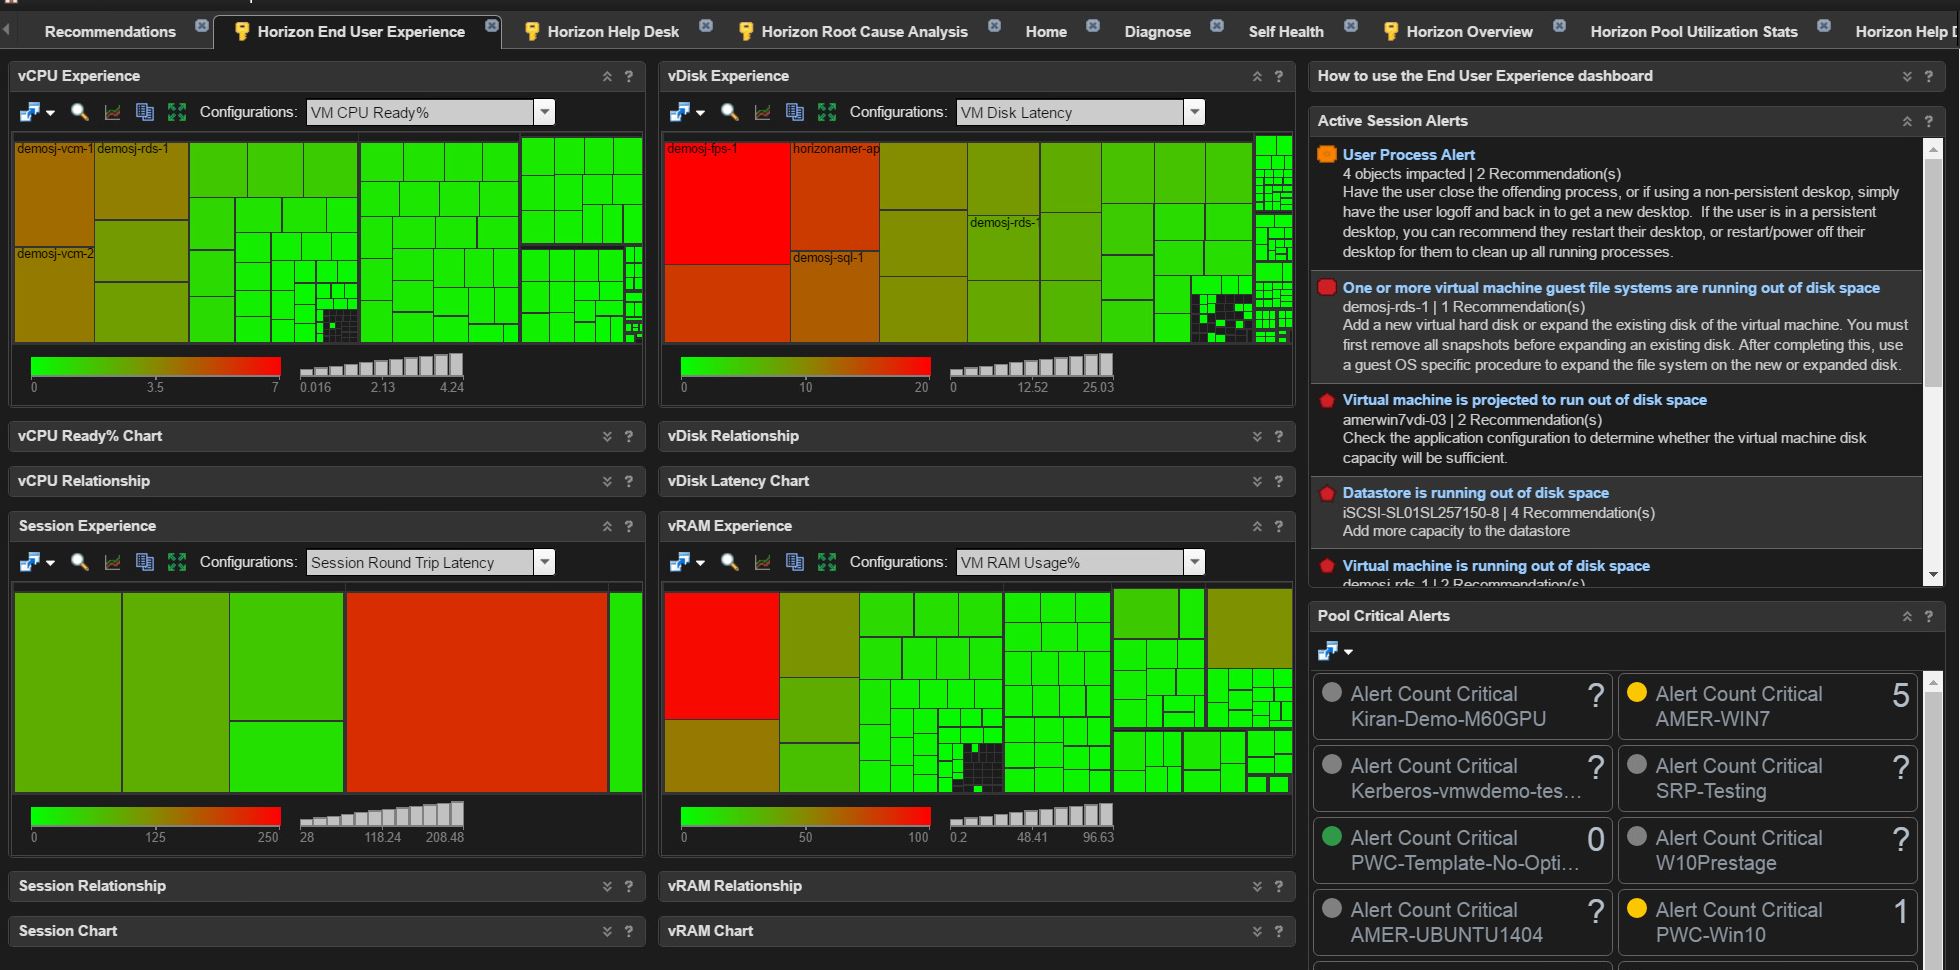
How to use the Horizon End User Experience Dashboard
This video is designed as a quick how-to guide on utilizing the latest Horizon End User Experience Dashboard.
Please leave feedback or comments for any additional training videos that you would like to see posted in upcoming blogs.
vROPs for Horizon Custom Content v8.3
**This content is now included out-of-box in the vROPs for Horizon Adapter installation .pak file and dashboards download file available at: downloads.vmware.com
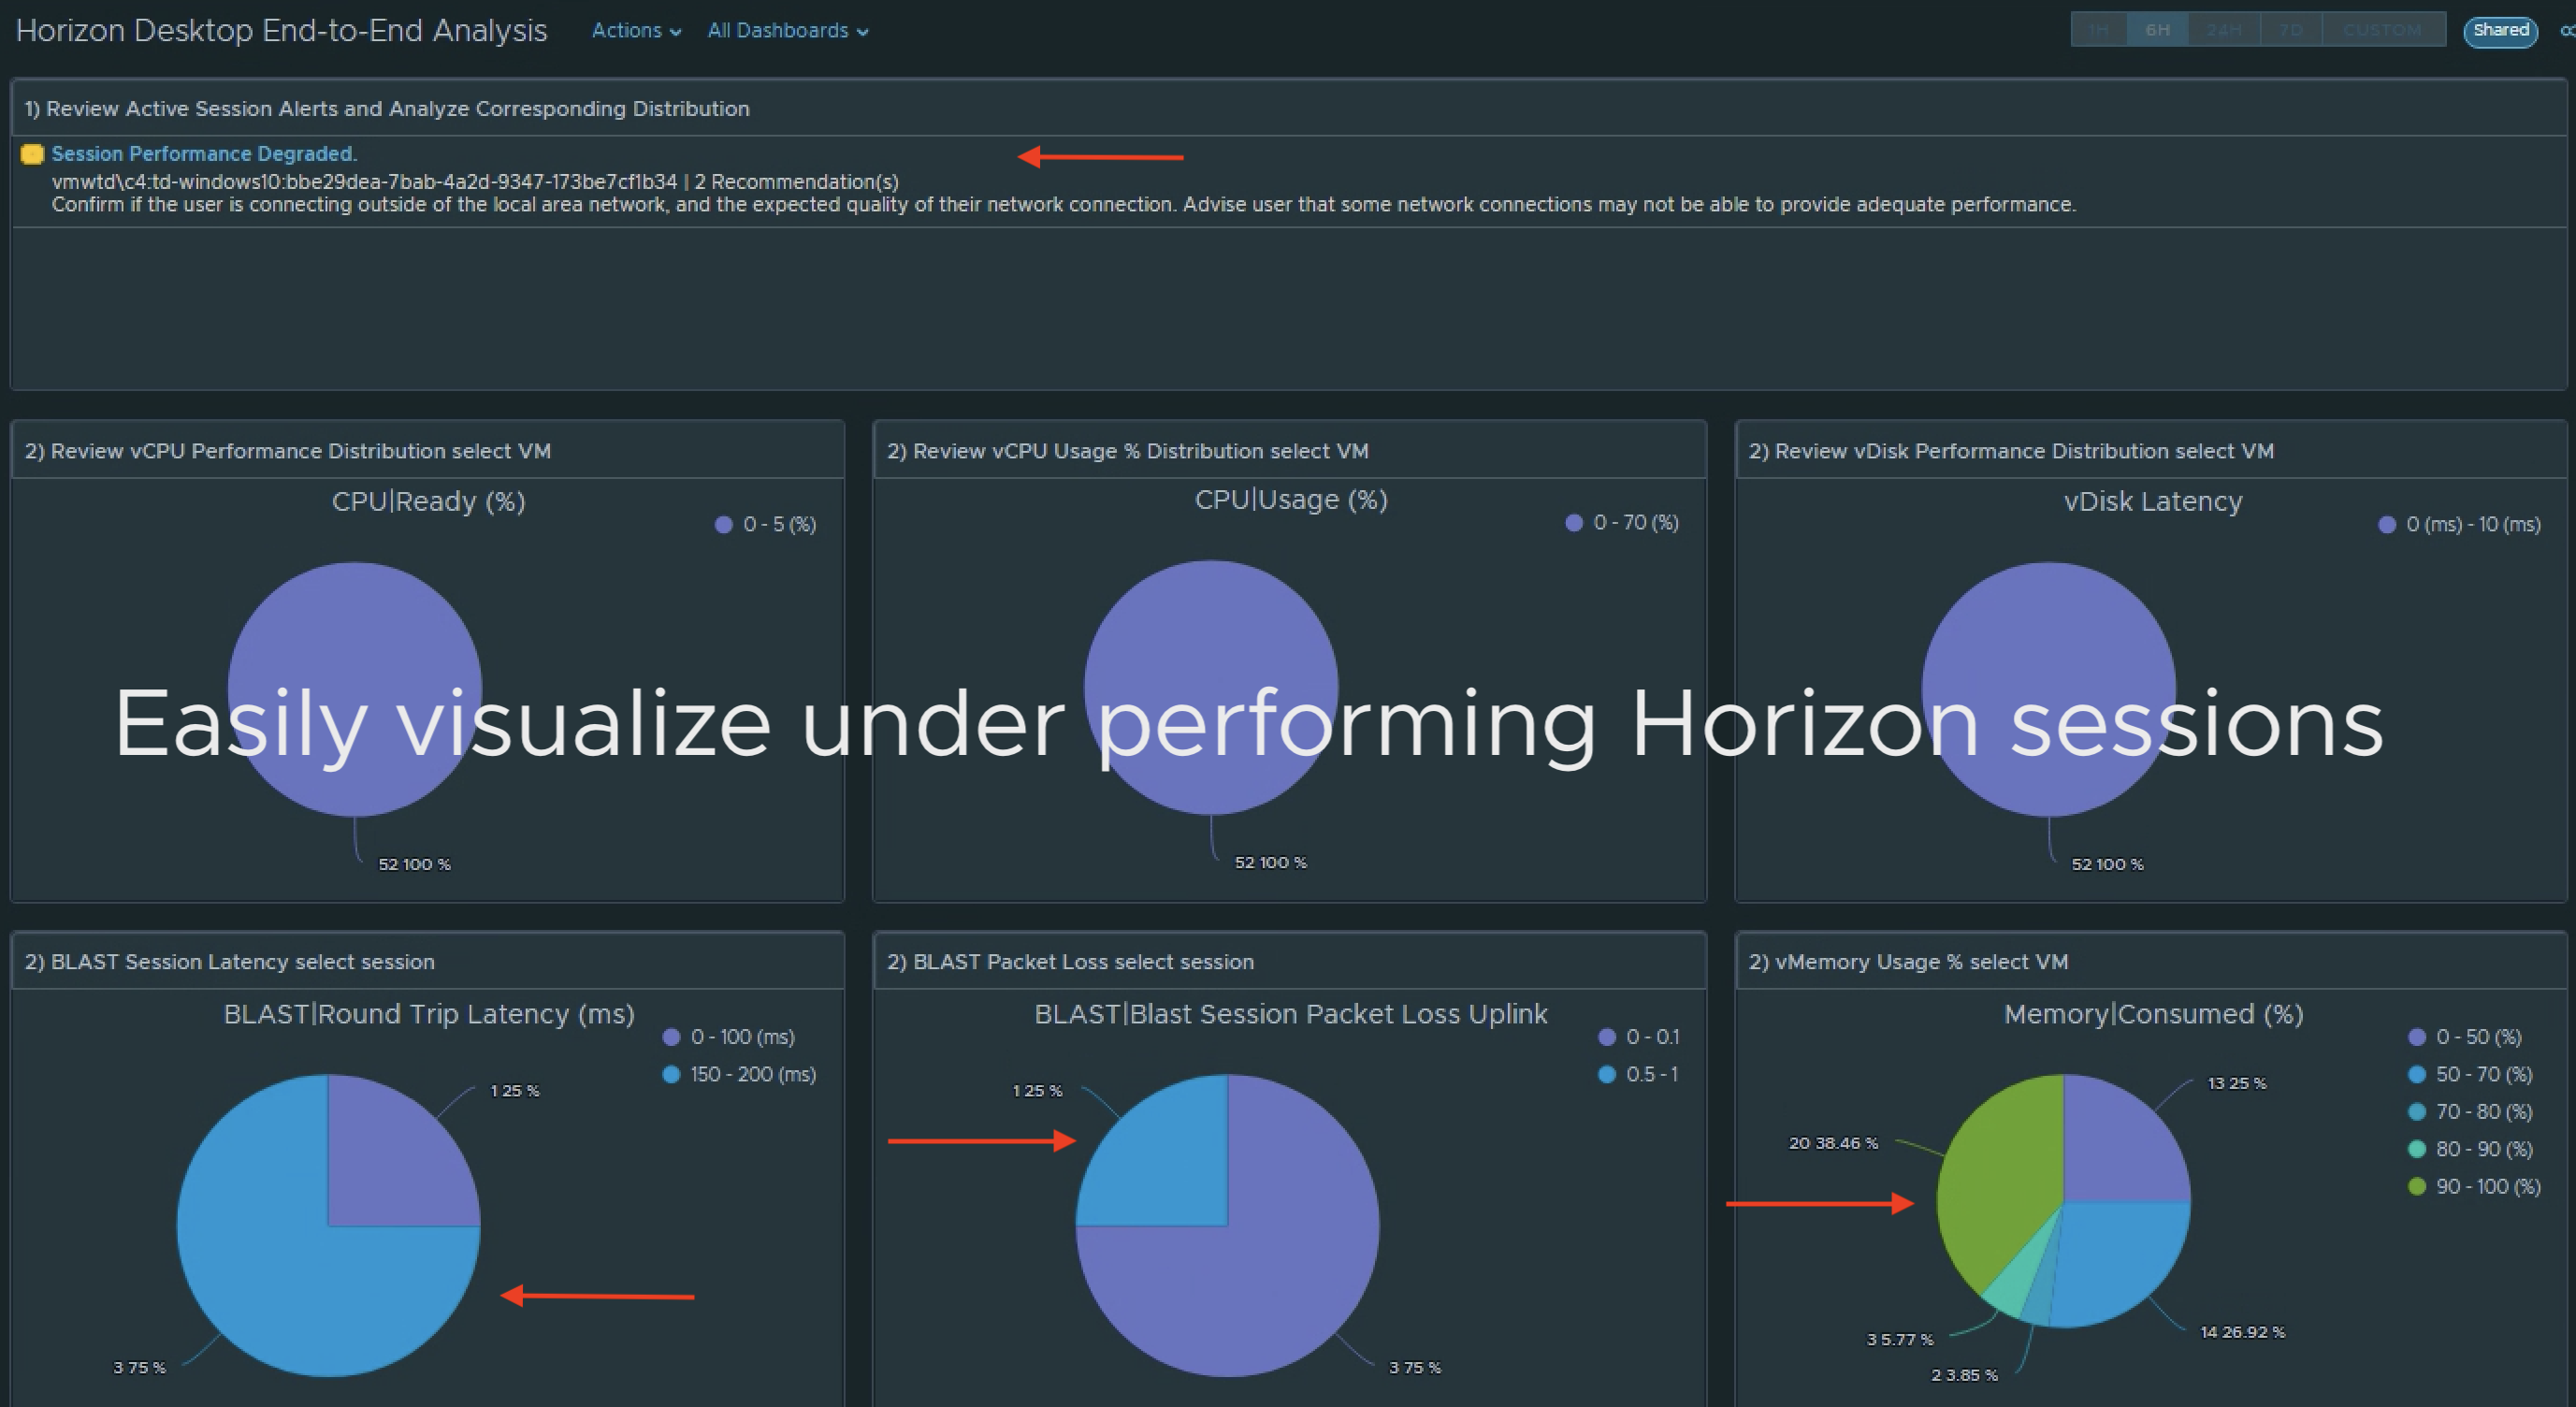
The latest vROPs for Horizon custom content includes an updated End User Experience and Help Desk dashboard, with Blast Session Metrics and Alerts, Horizon Client External IP address, as well as new Navigate to “Horizon Root Cause Analysis Dashboard” functionality.
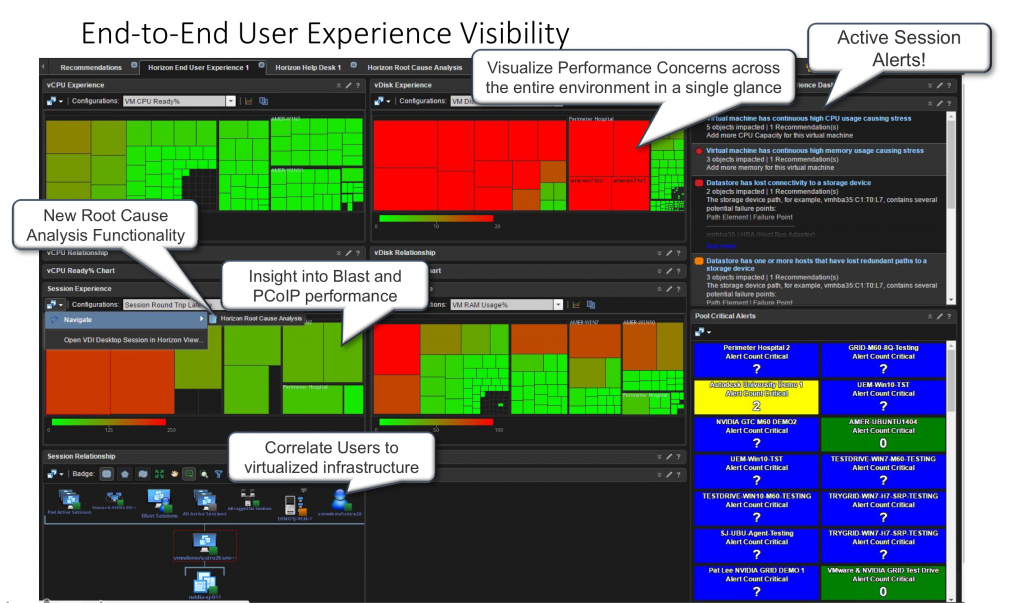
End User Experience Dashboard:
To use the root cause analysis dashboard, select any object from a heat map or relationship chart on the End User Experience dashboard, then select the Navigate to “Horizon Root Cause Analysis” option to begin troubleshooting.
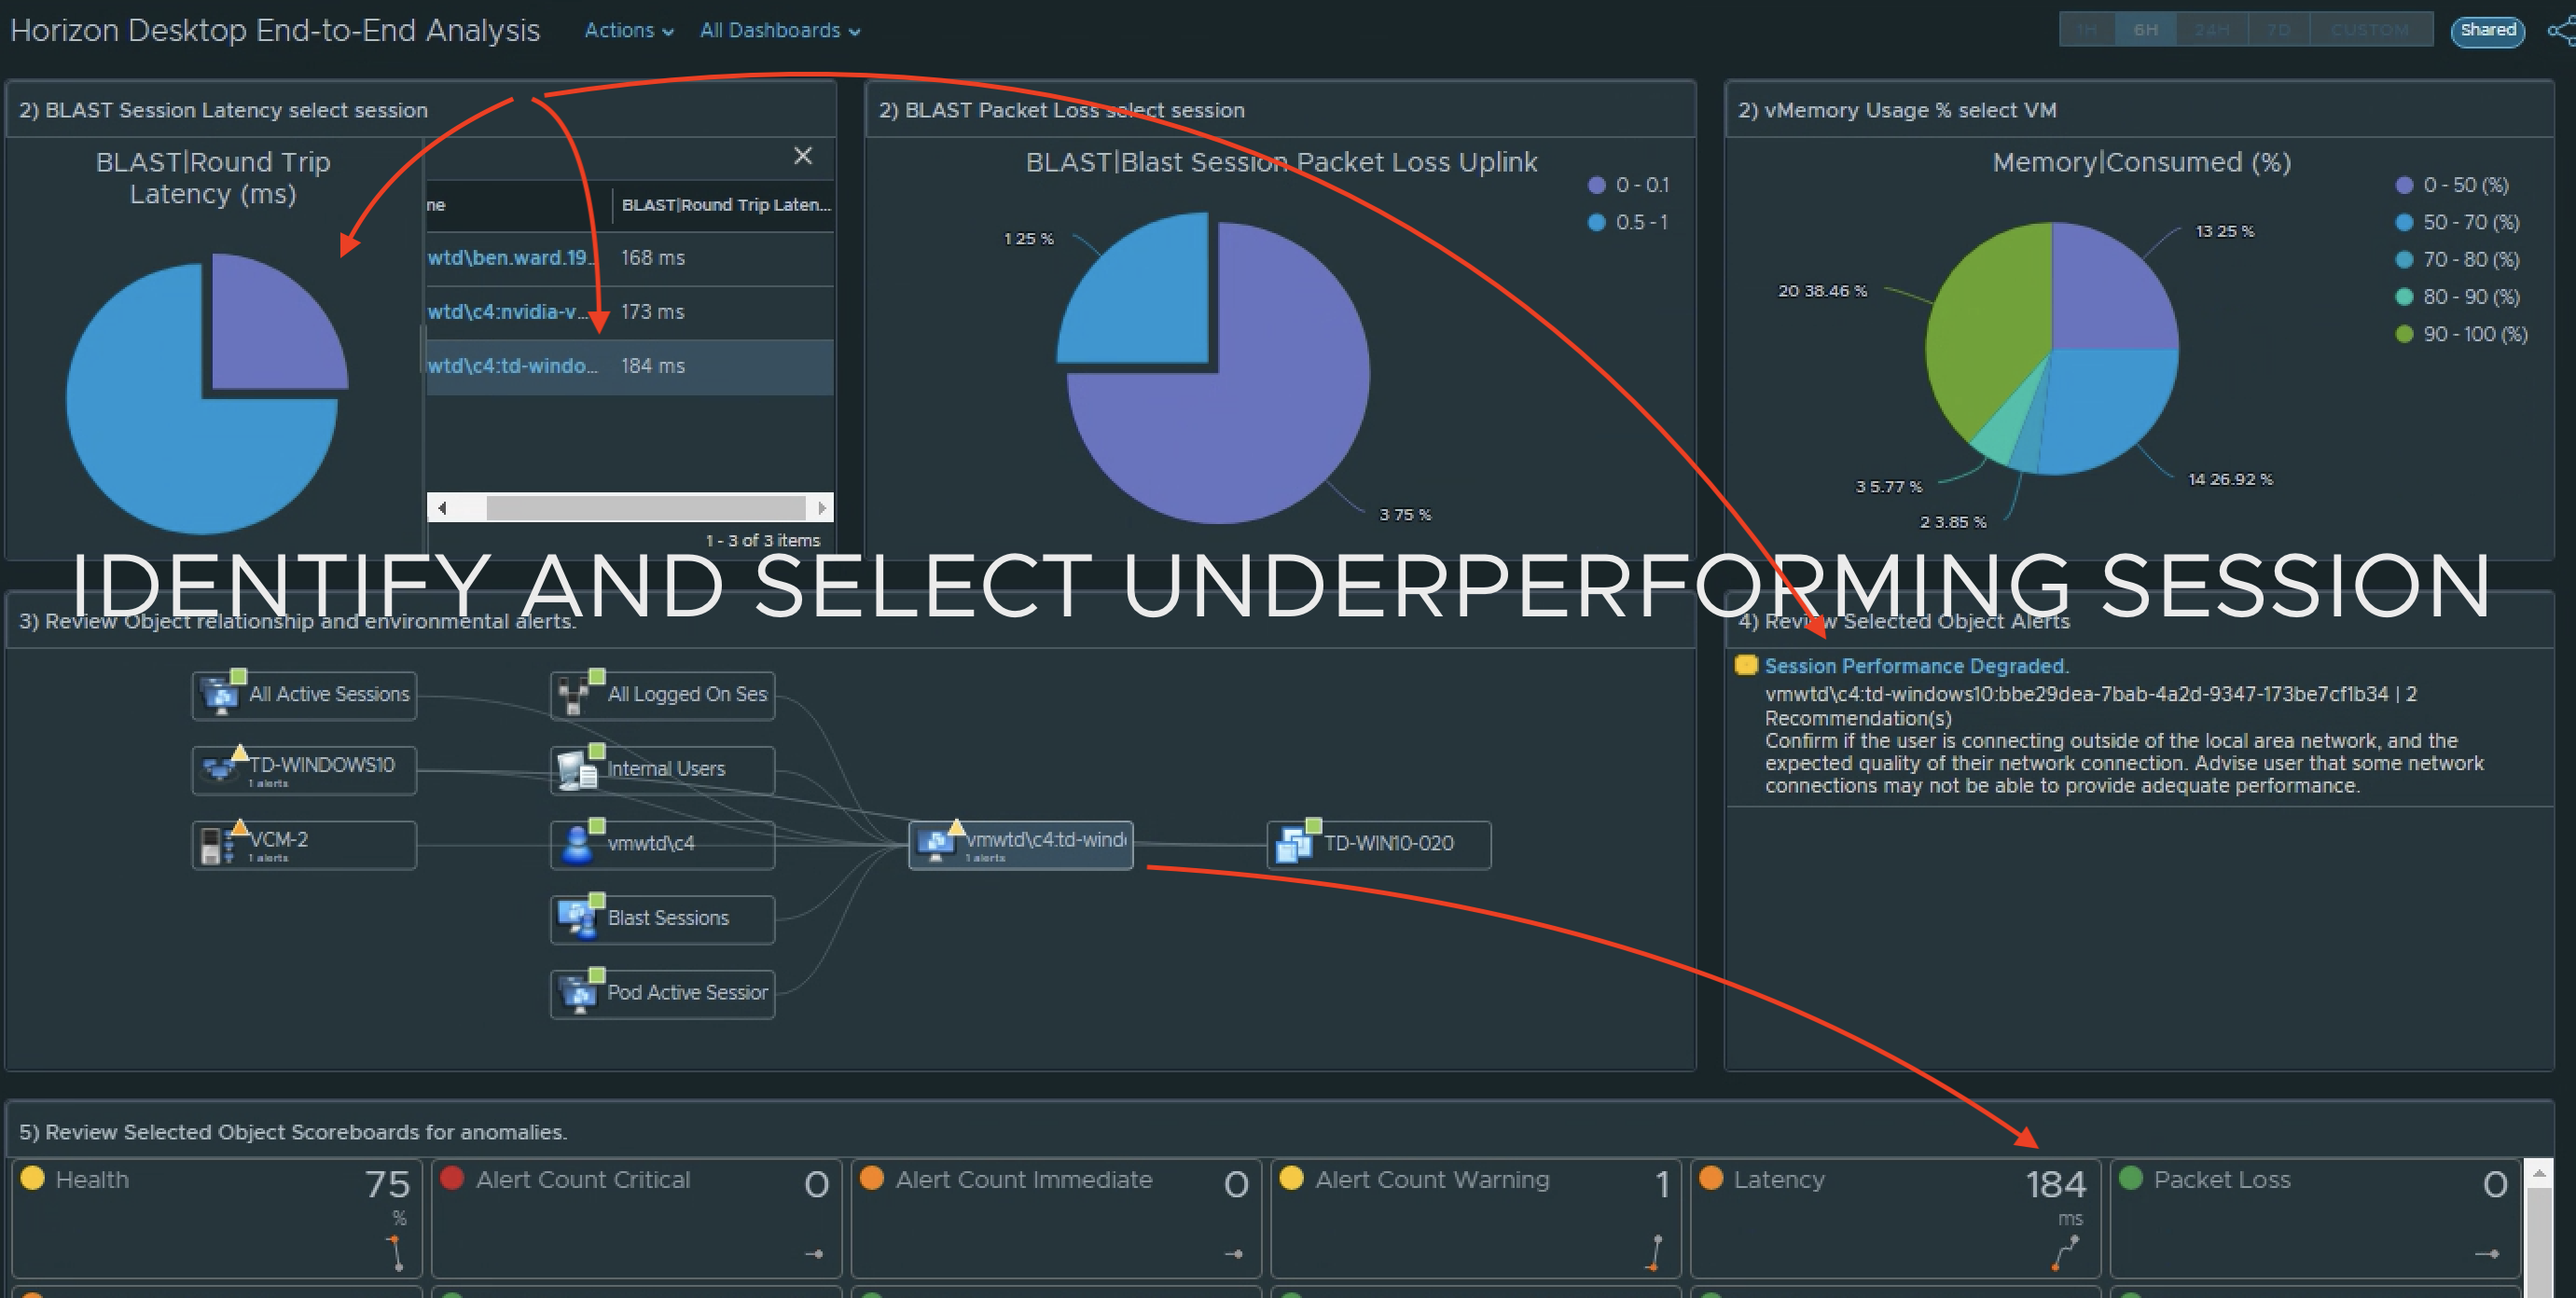
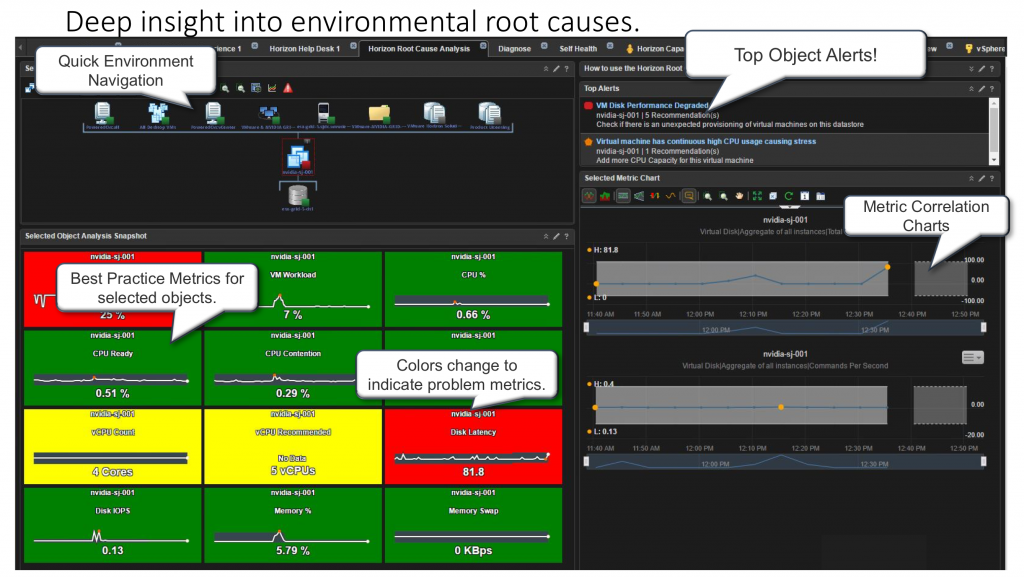
Horizon Root Cause Analysis:
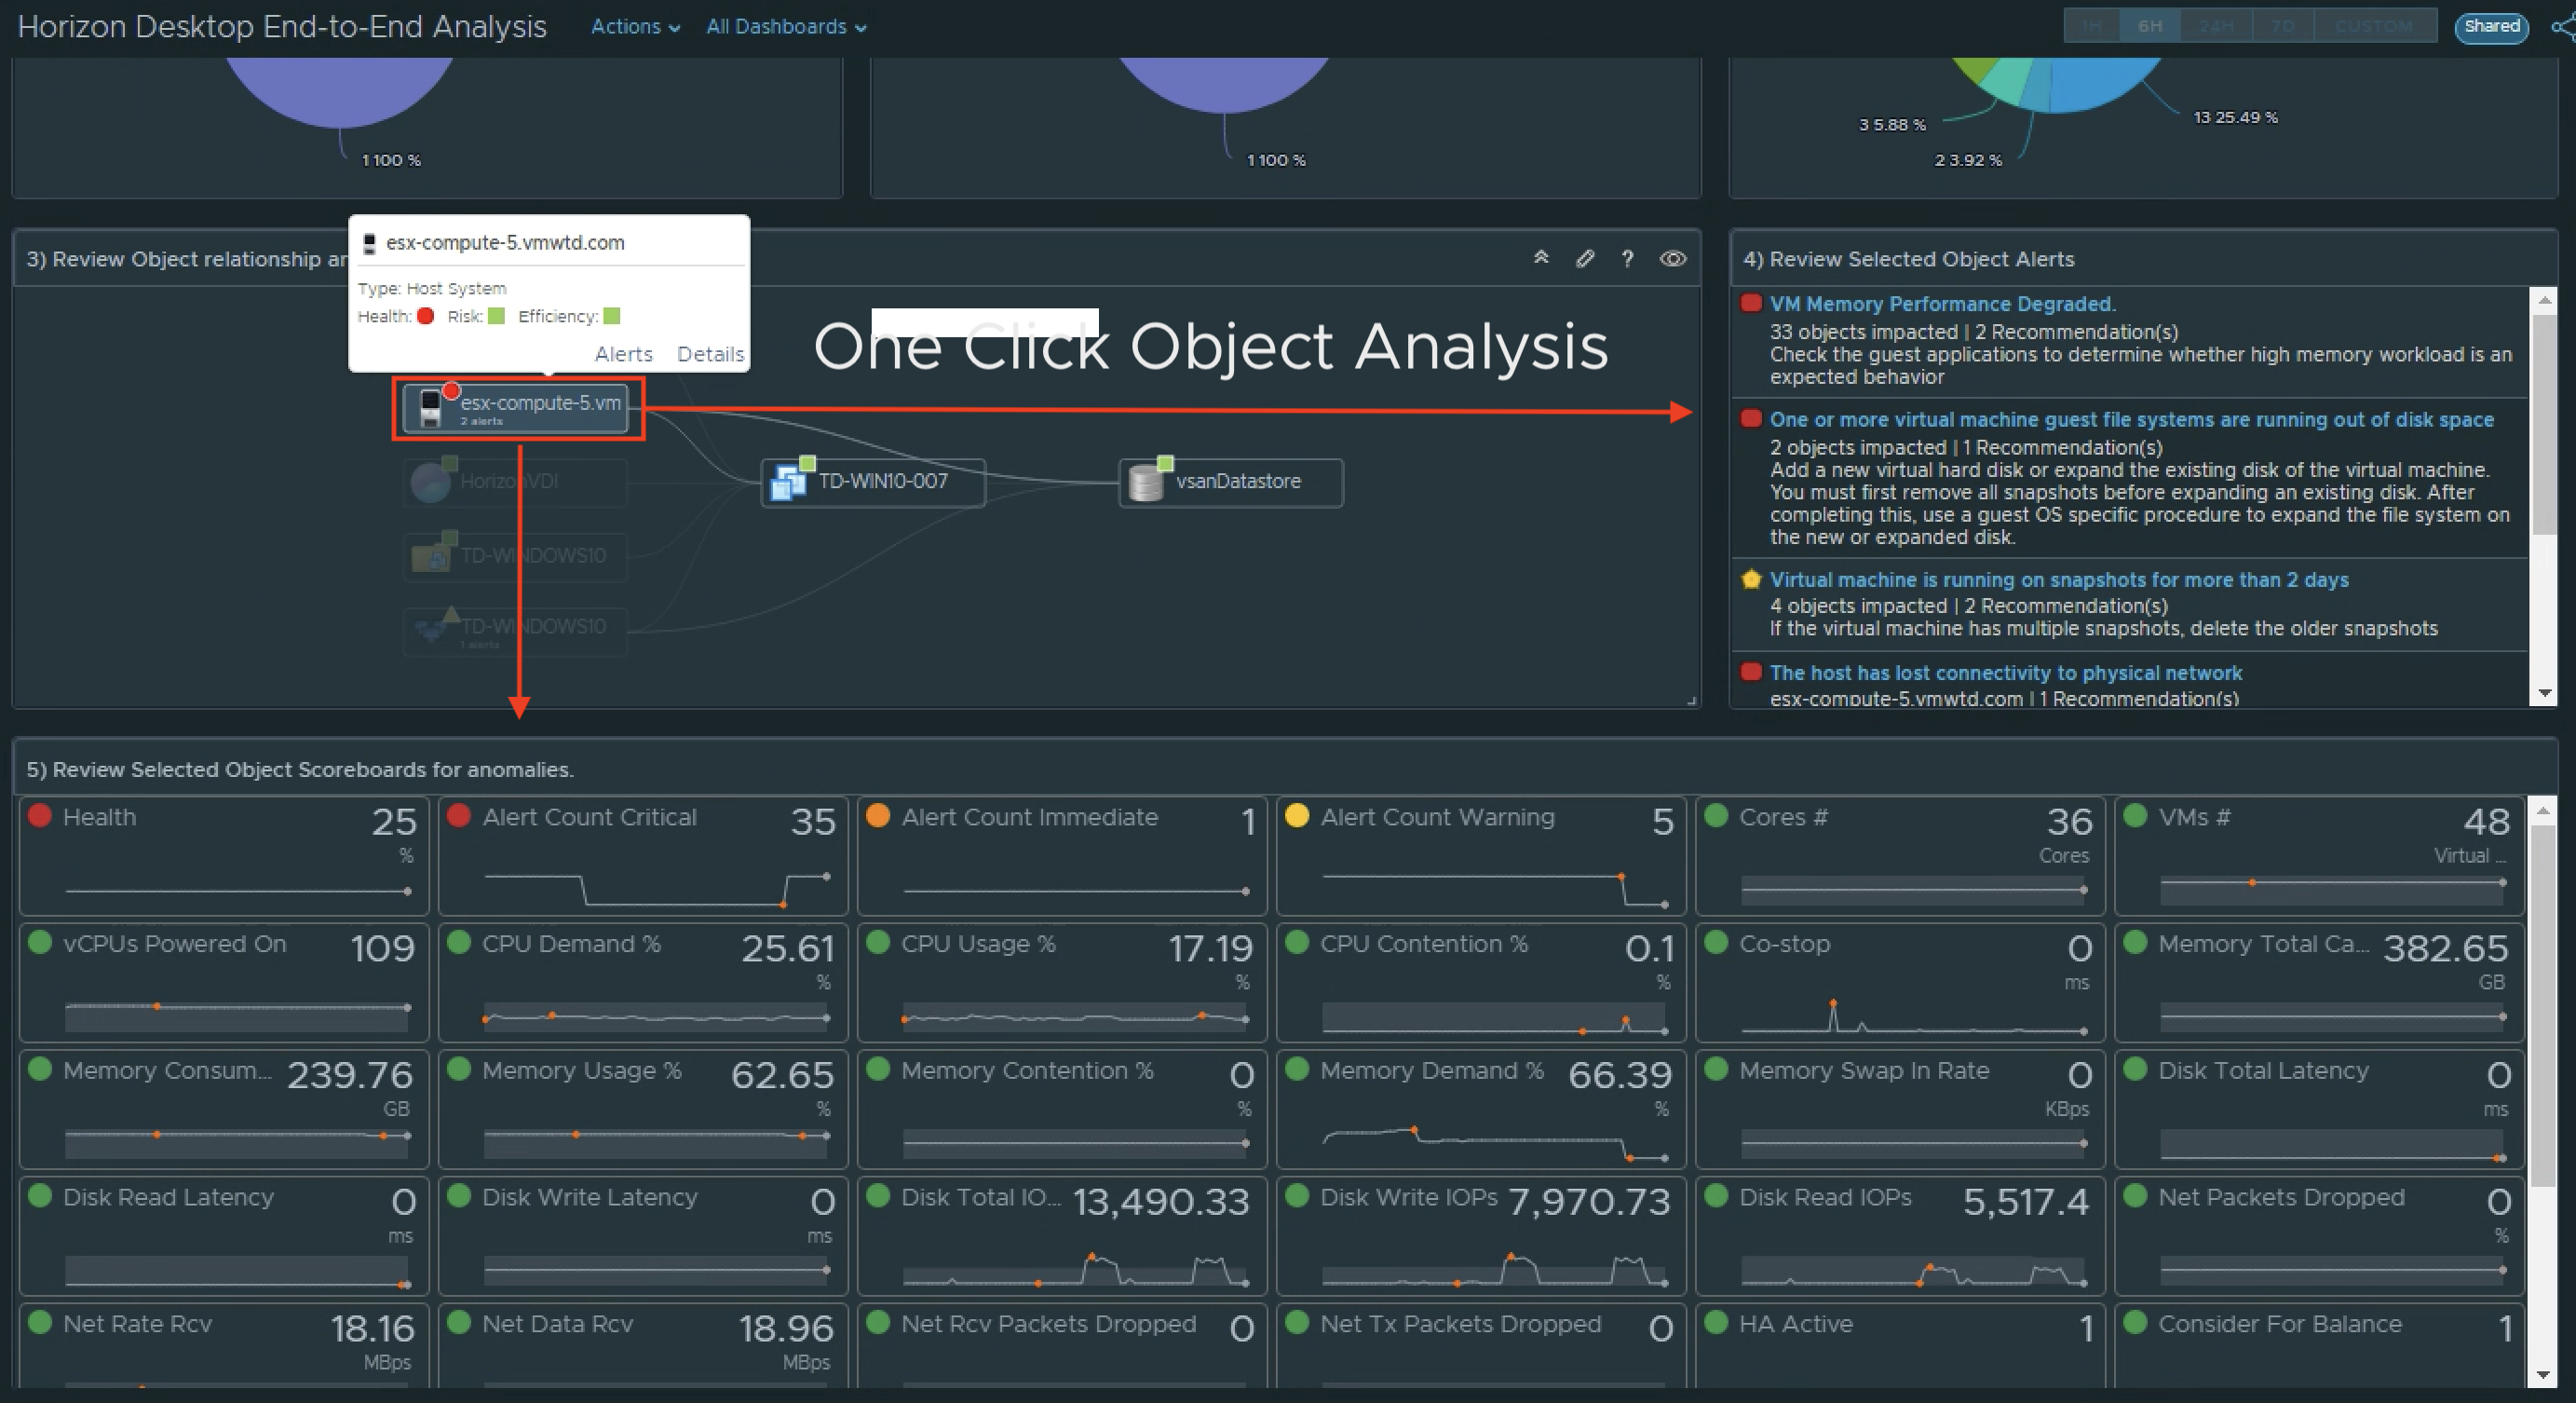
The Horizon Root Cause Analysis Dashboard allows you to quickly switch between correlated environmental objects, and see the best practice metrics and alerts on the selected item. Colors will change to indicate any problem metric, or simply provide visibility into metrics of “interest”.
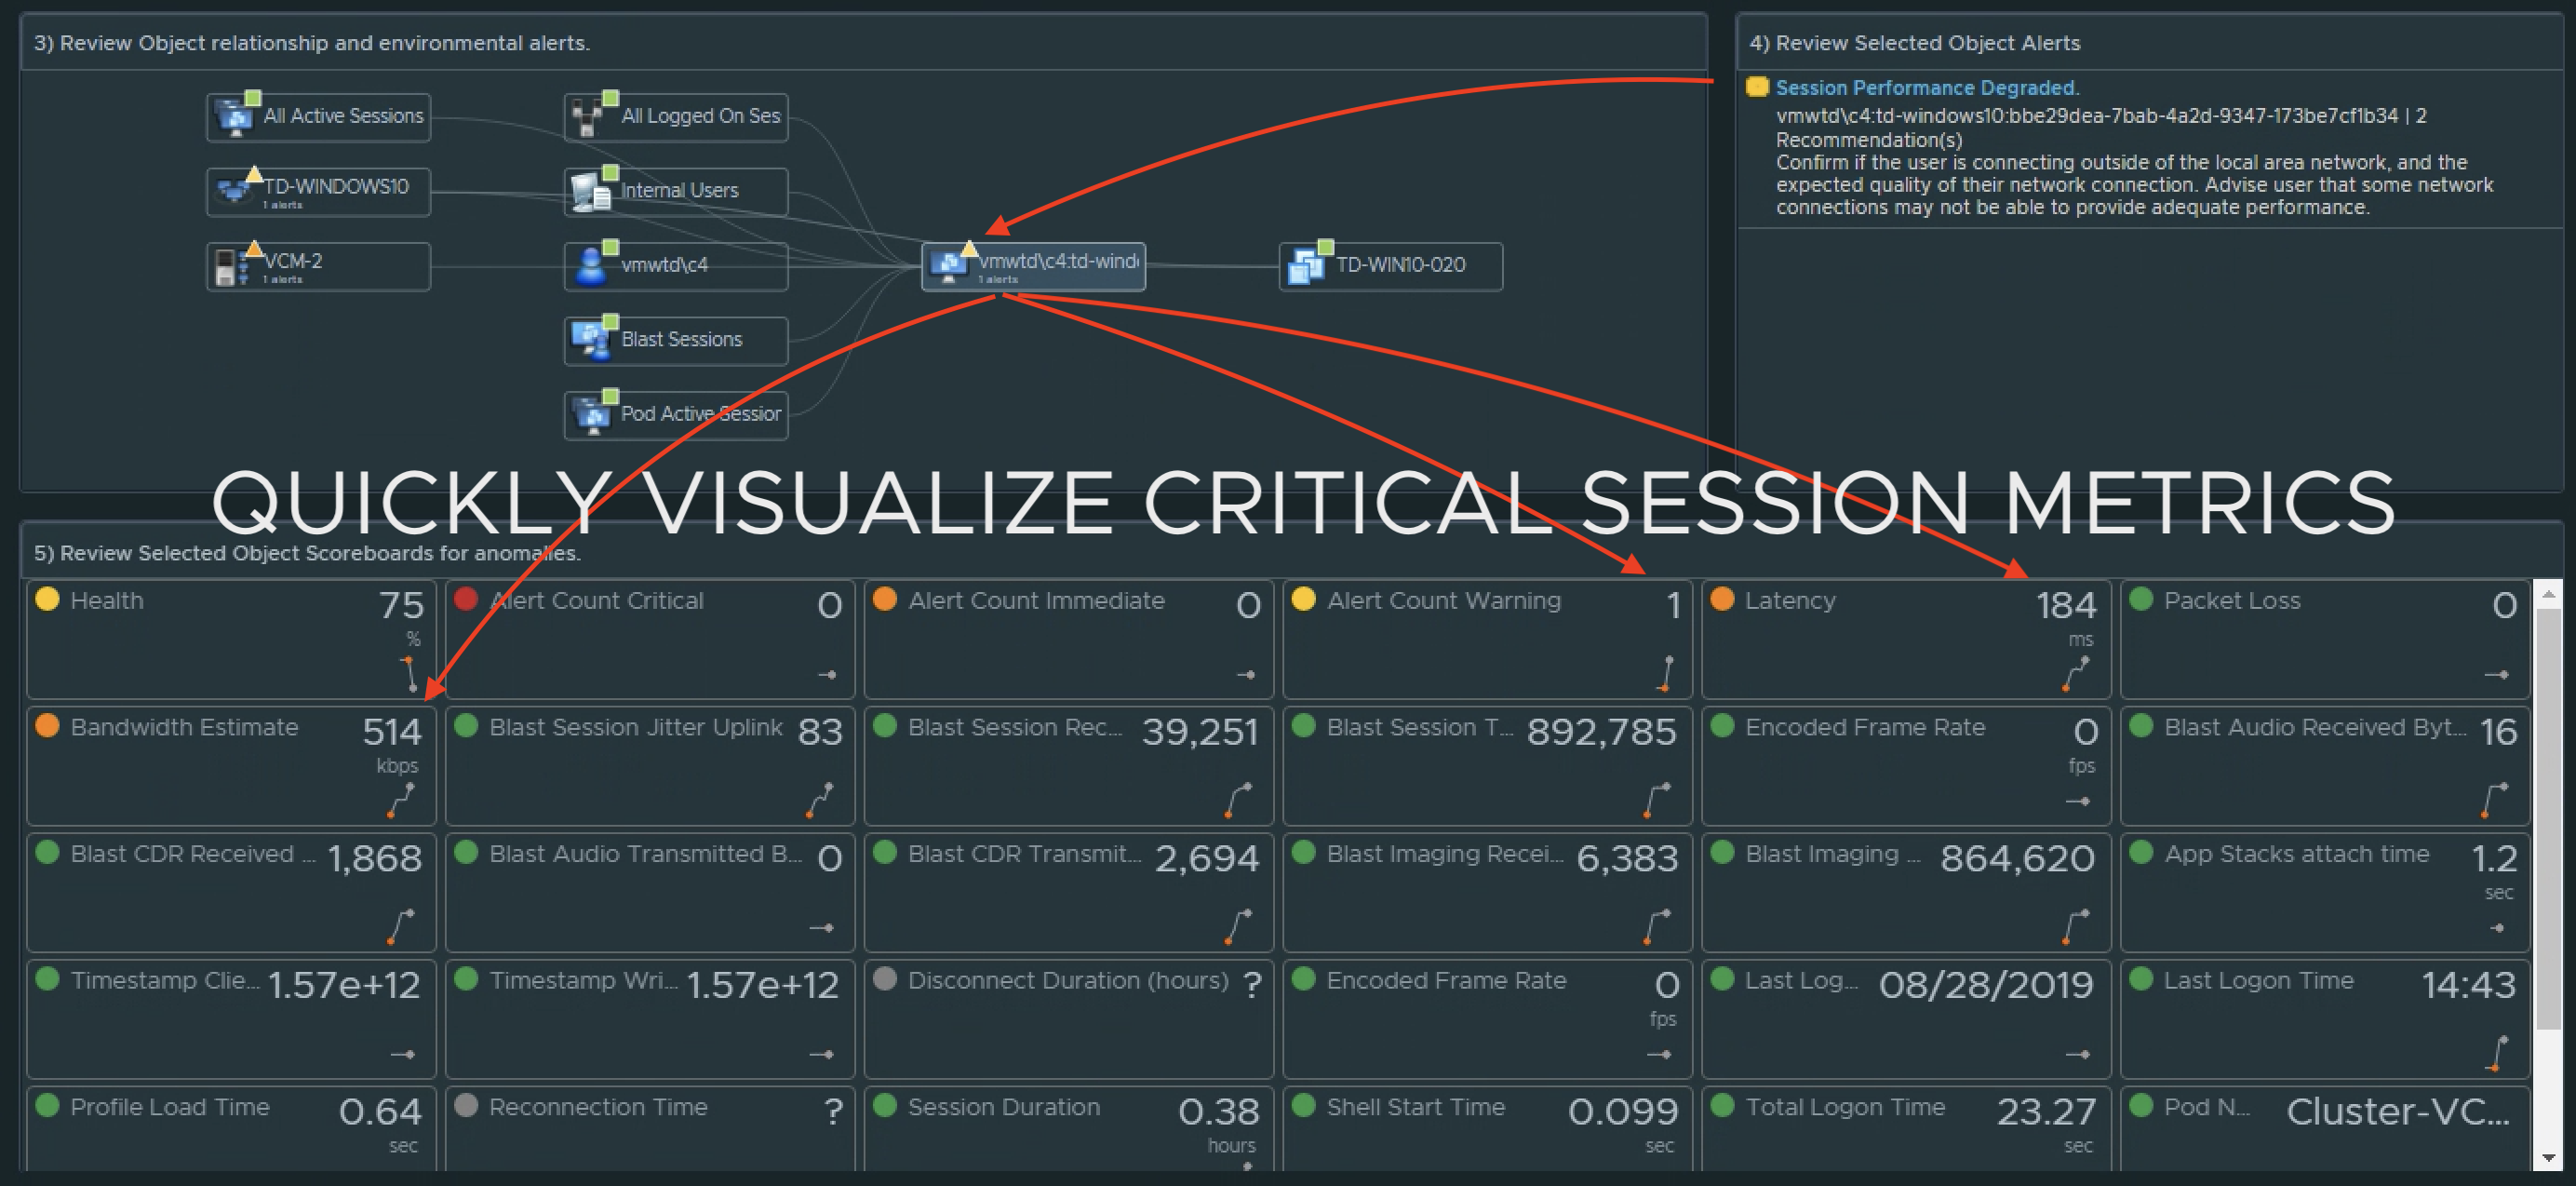
Select the object you want additional information on, and the best practice metrics will be viewed in the Scoreboard below, as well as any alerts on the selected object. You can also click a Scoreboard metric to add it to the Selected Metric Chart widget, as well as switch objects, and continue to build out the metric chart with various environmental objects to put together a cross-environment “picture” for analysis.
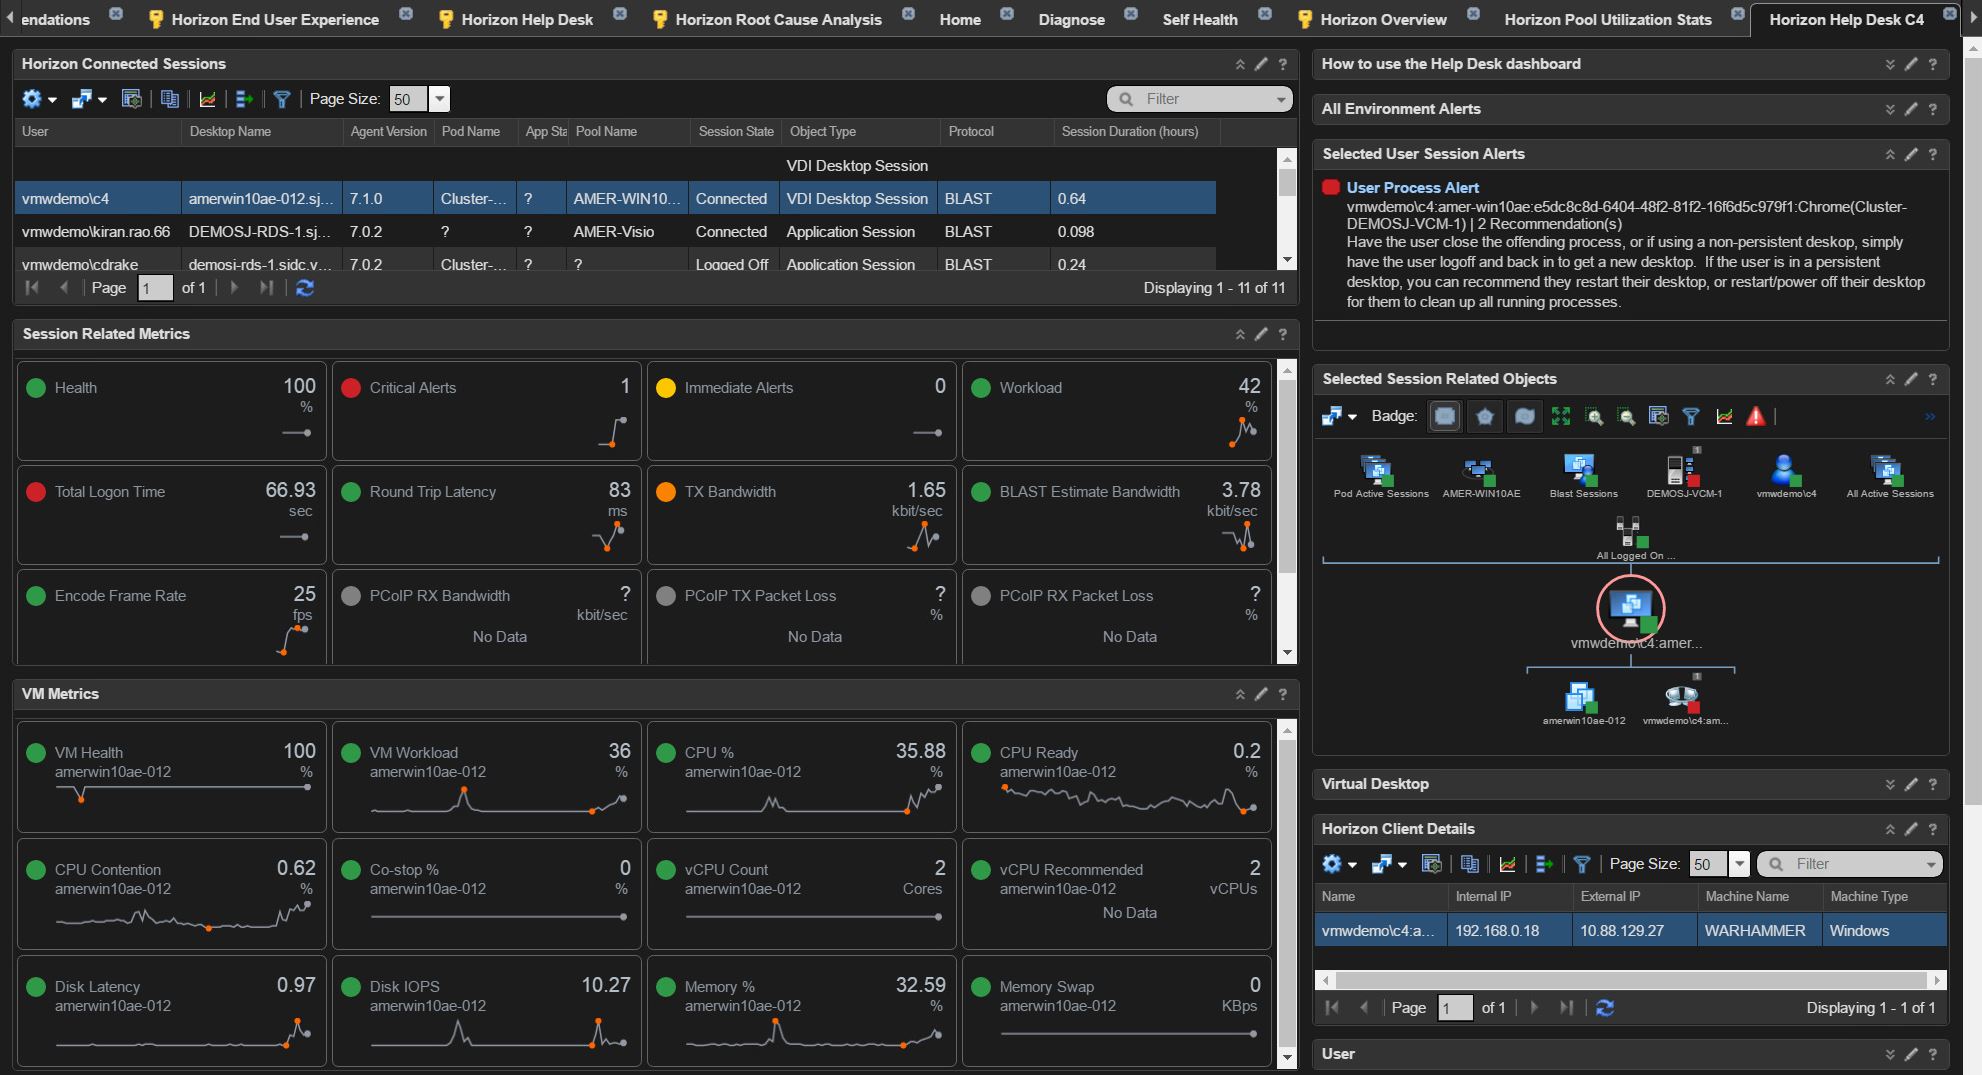
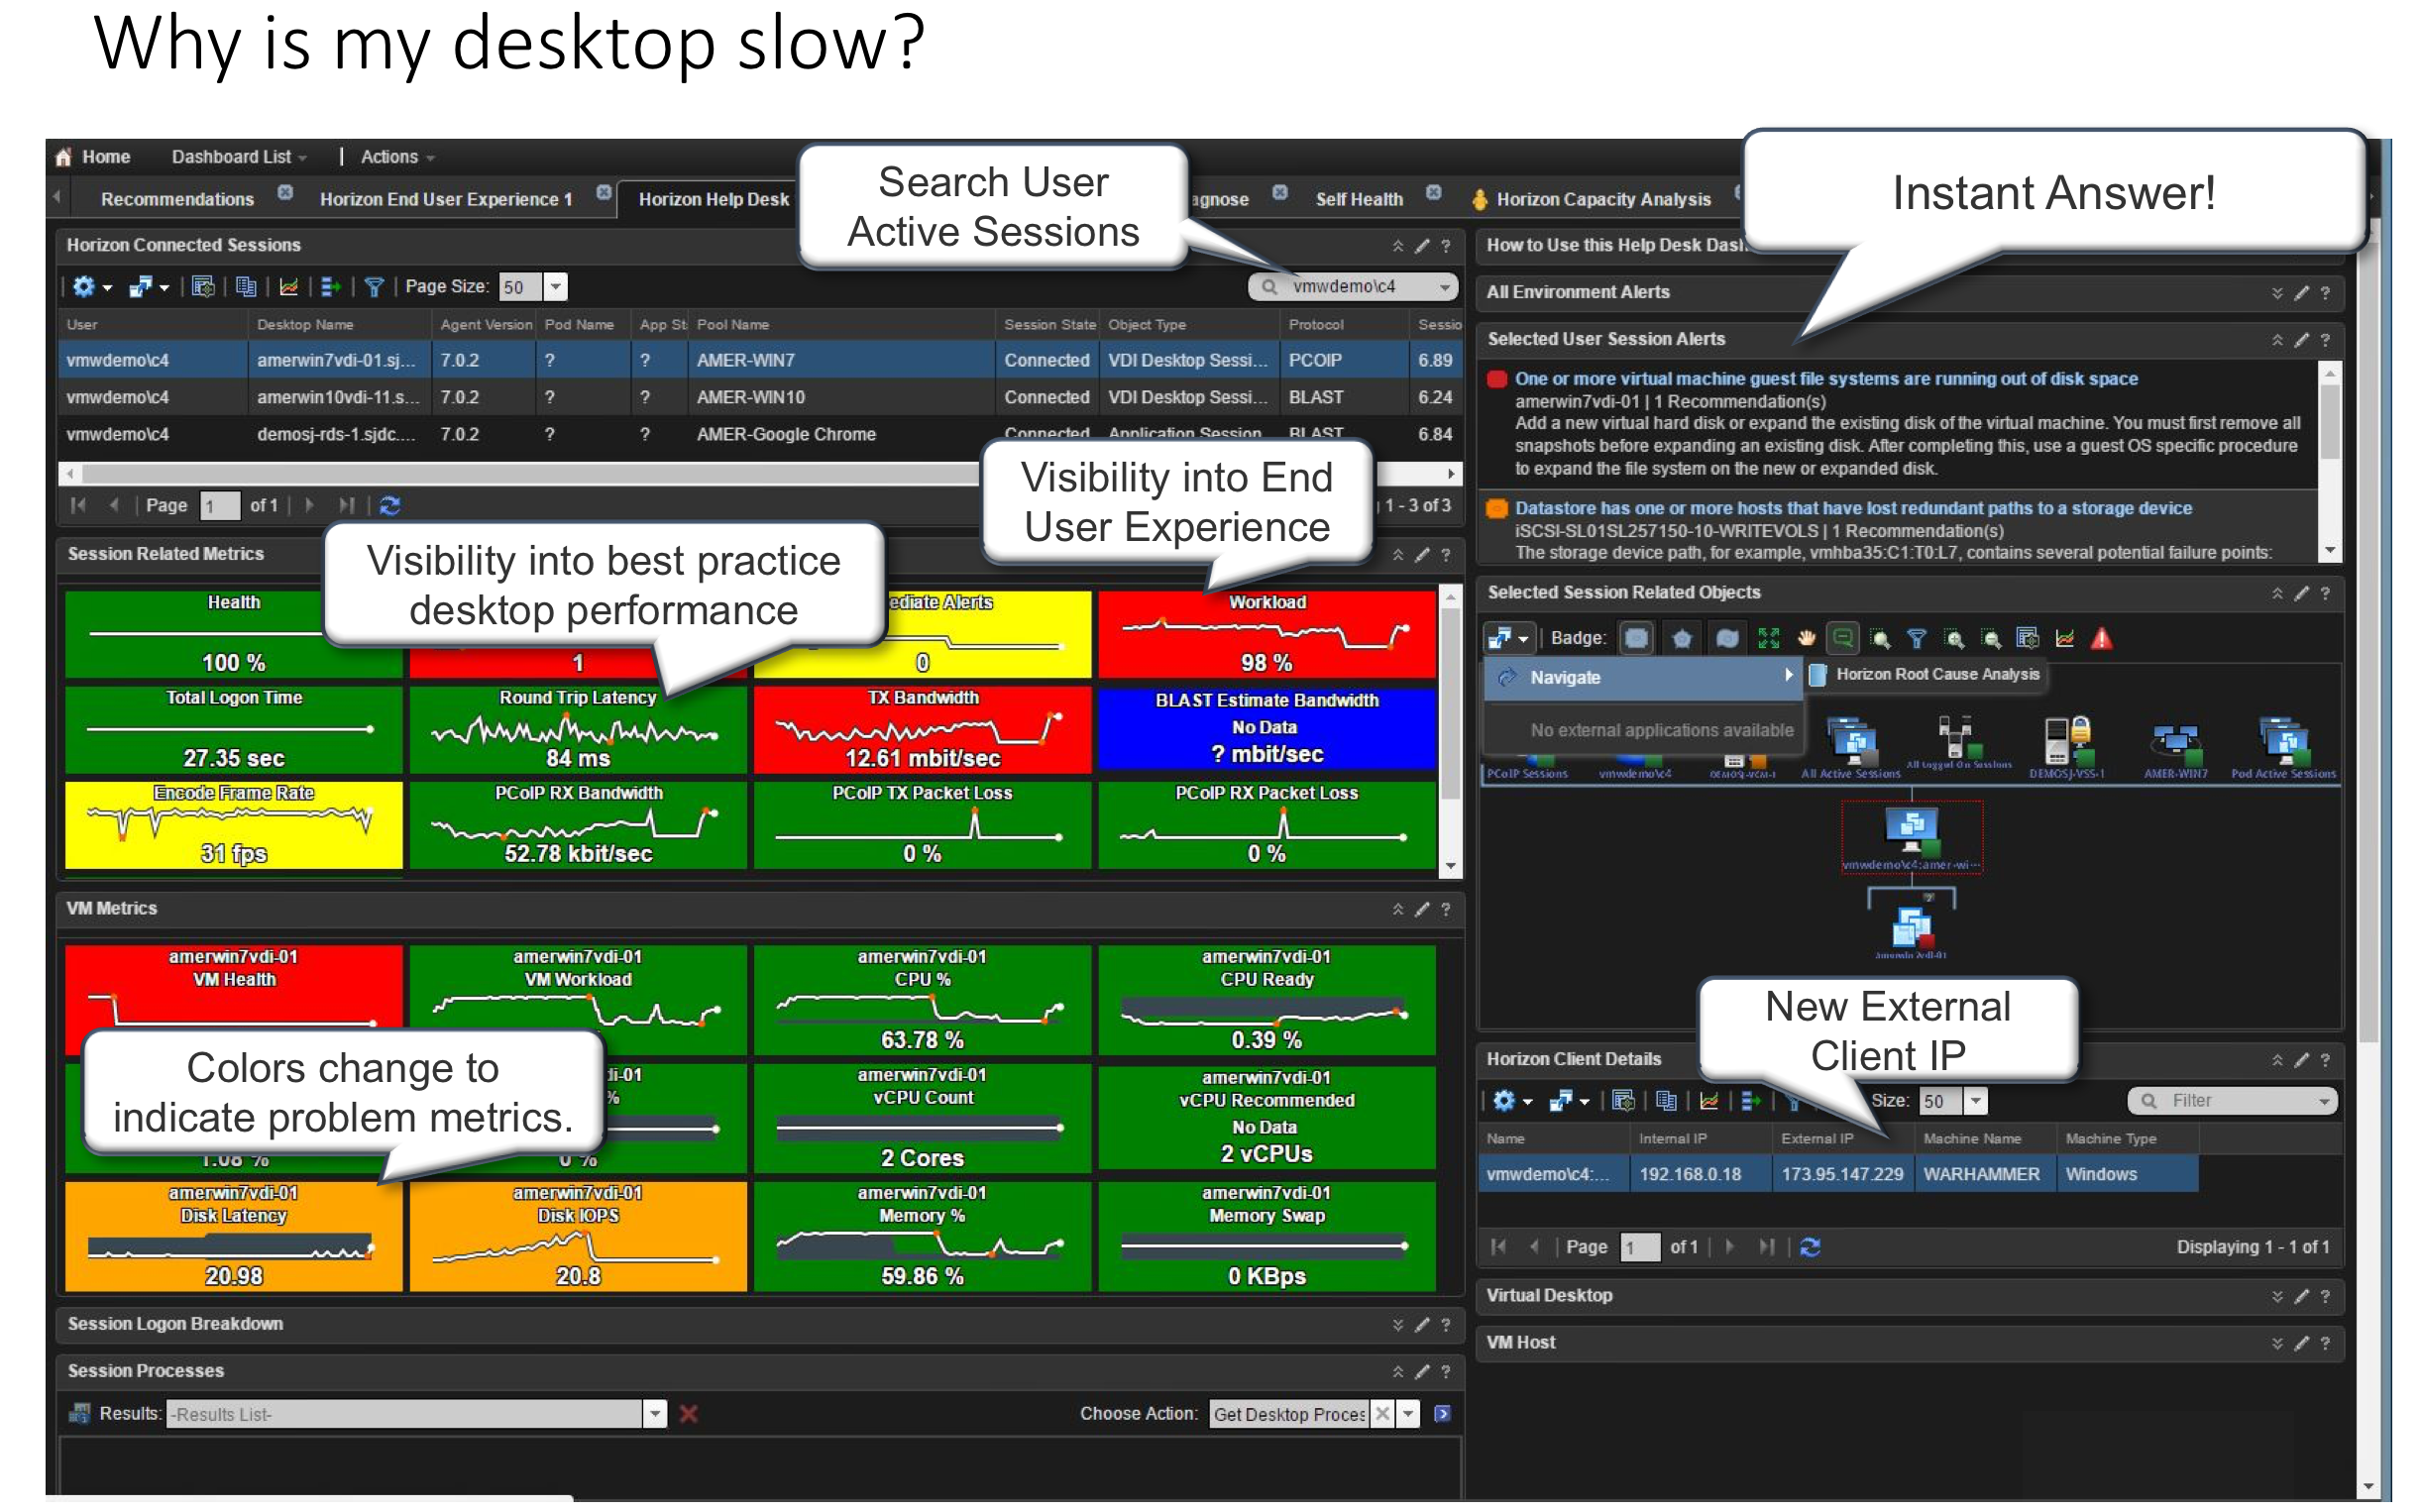
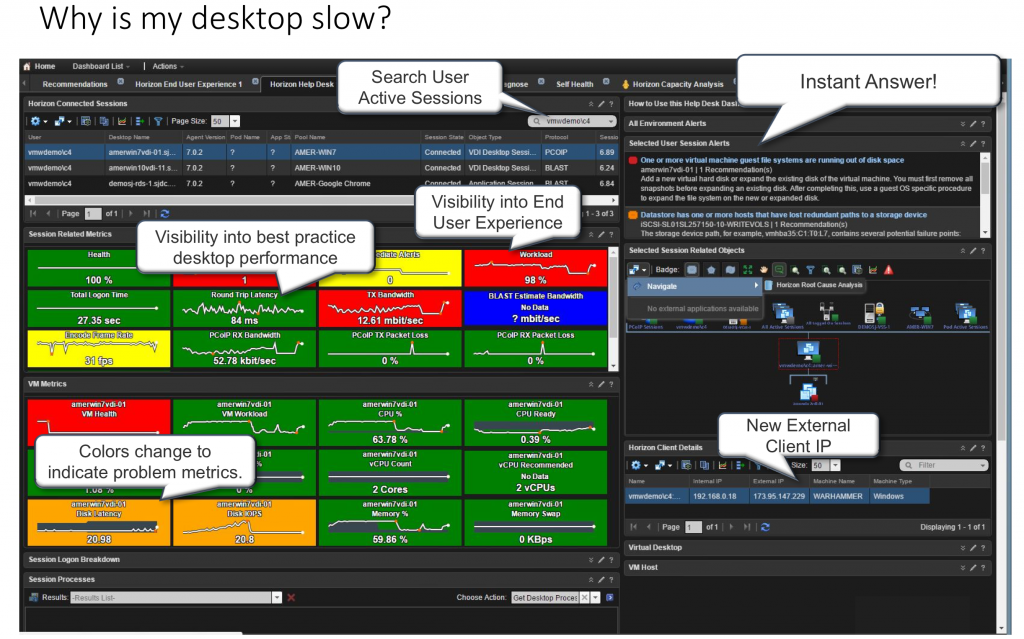
Horizon Help Desk Dashboard:
The latest Help Desk Dashboard includes Blast Session metrics and alerts, as well as an updated Horizon Client Details widget to include the External/Internal IP of the users client connecting to the environment. The navigate to “Horizon Root Cause Analysis” Dashboard functionality is available on the user session and related objects widgets.
Updated Metric Config to drive the latest Scoreboard content:
To leverage the latest Scoreboard content to see Blast Session metrics, a new metric config labeled “Session_Desktop_stats_v2.xml” is included in the latest content pack. All three dashboards included in the content pack leverage this metric config file to highlight and display key offending metrics for ease of troubleshooting. To add the new metric config, navigate to Content -> Manage Metric Config, click add new and use the exact name of “Session_Desktop_stats_v2.xml”. Then copy and paste the content of the included metric config, and click Save.
If the dashboard fails to load the content correctly, click the edit icon on the Scoreboard widgets and make sure they are pointing to the correct file name created above.
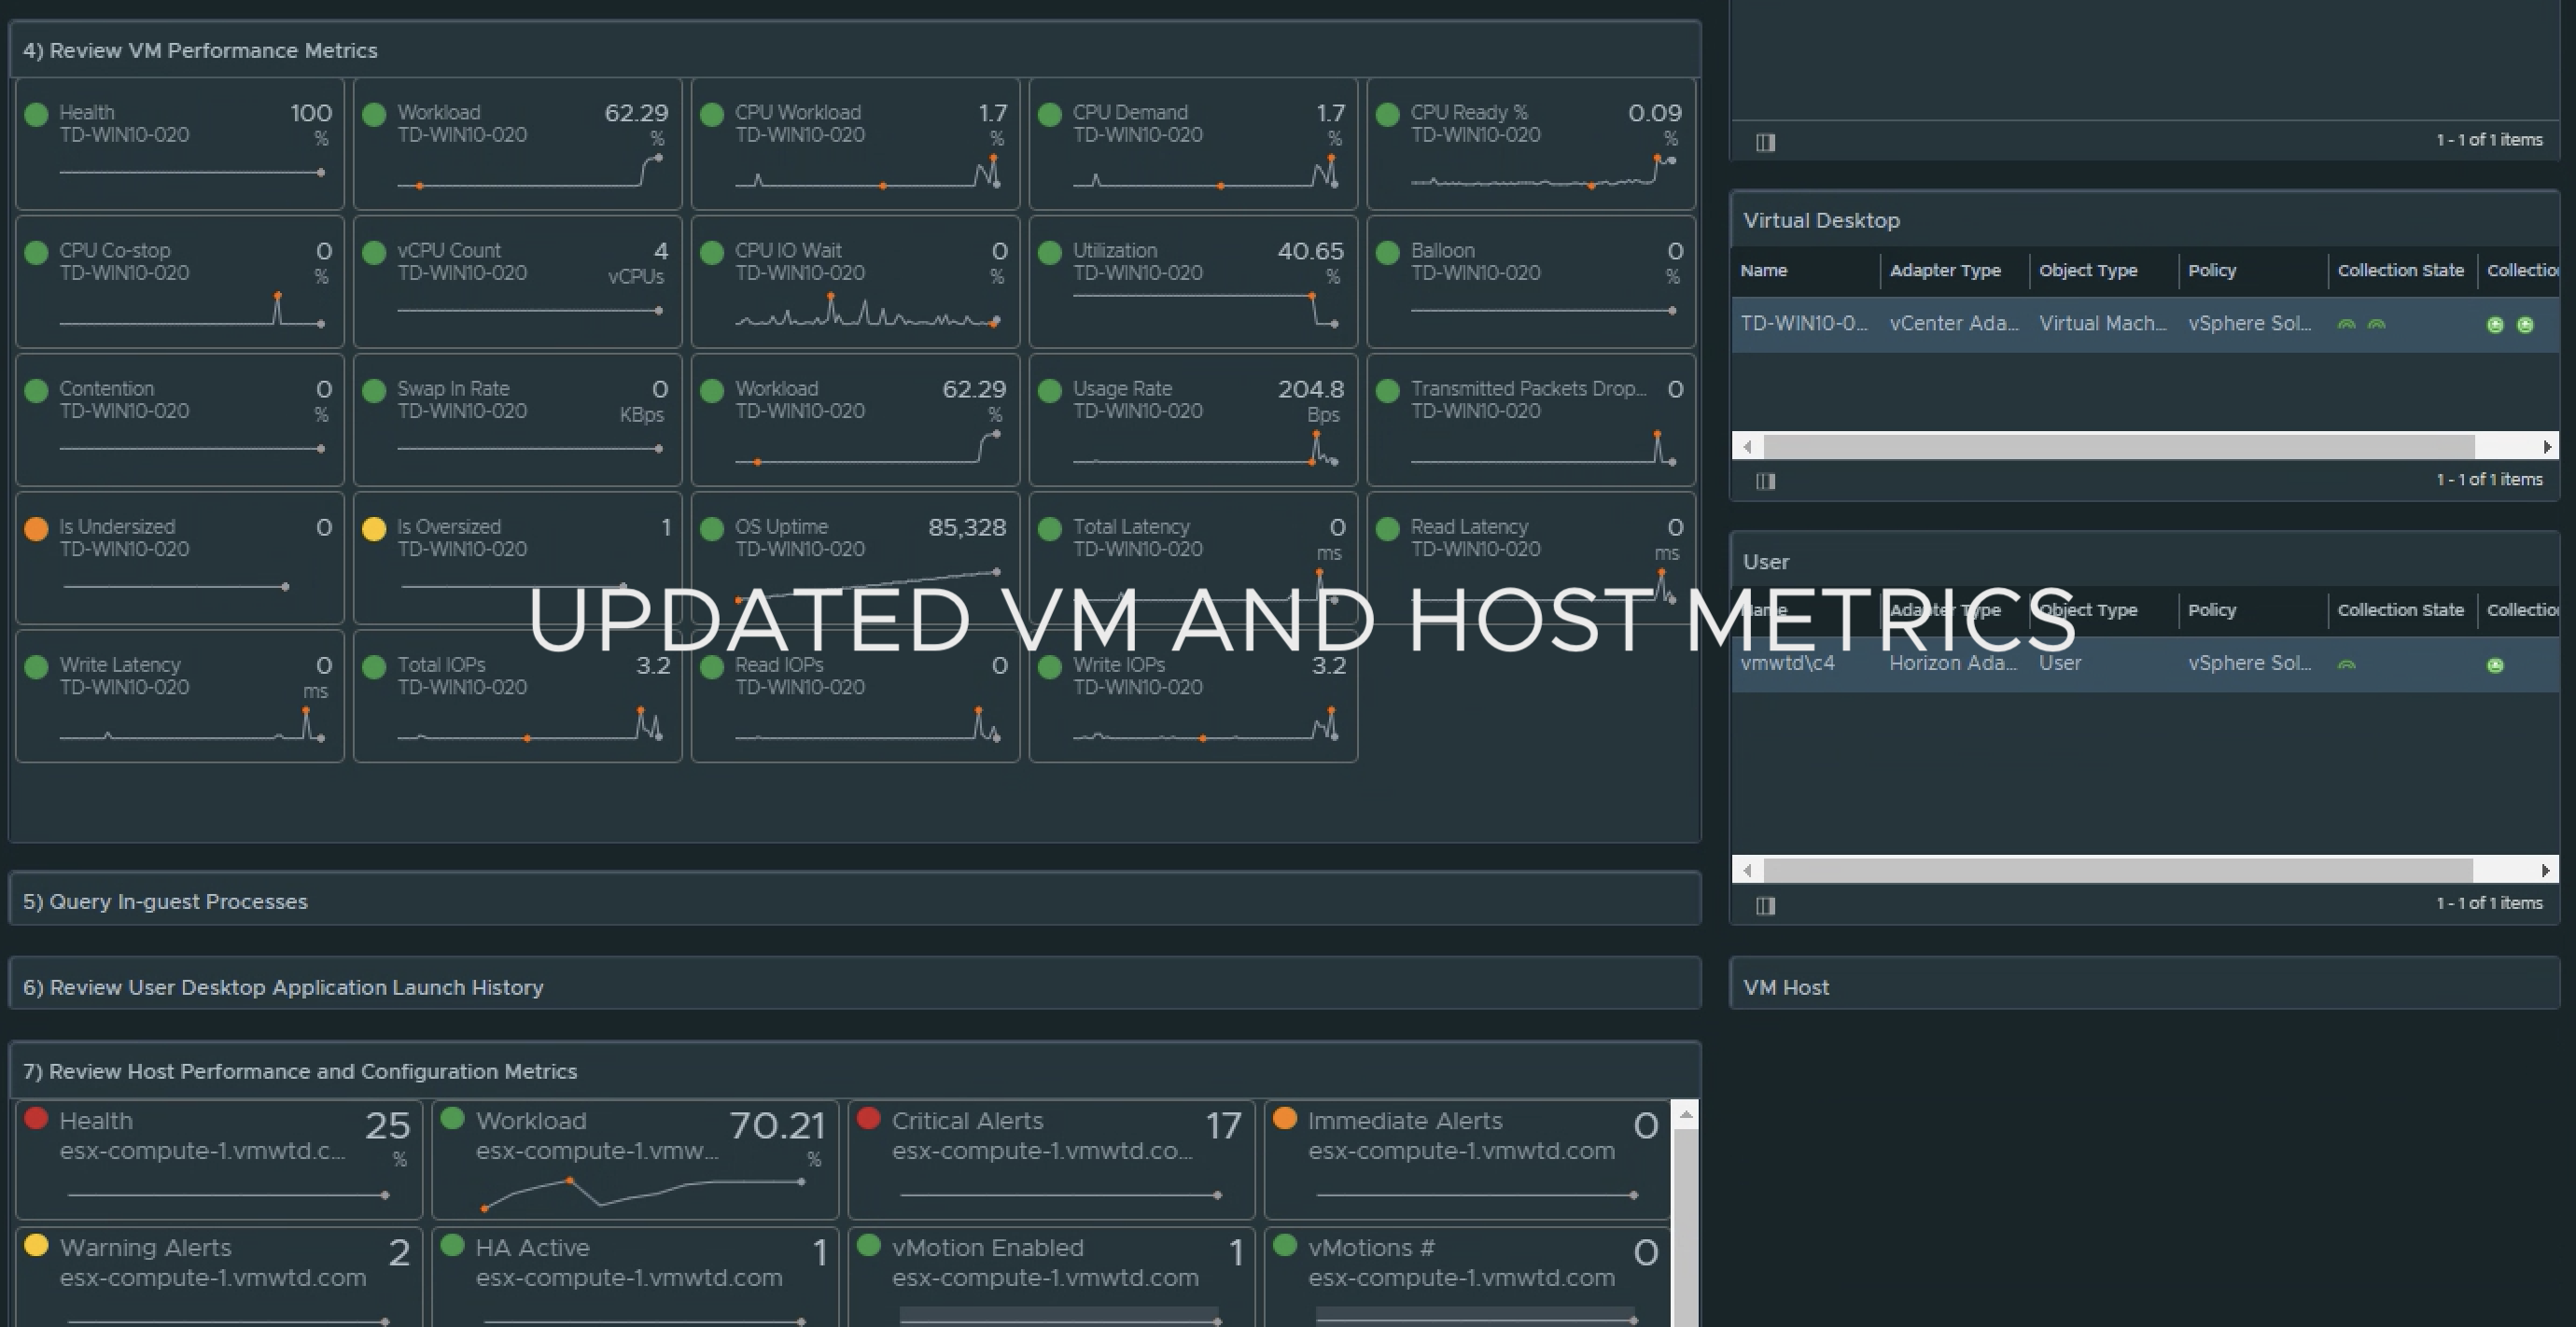
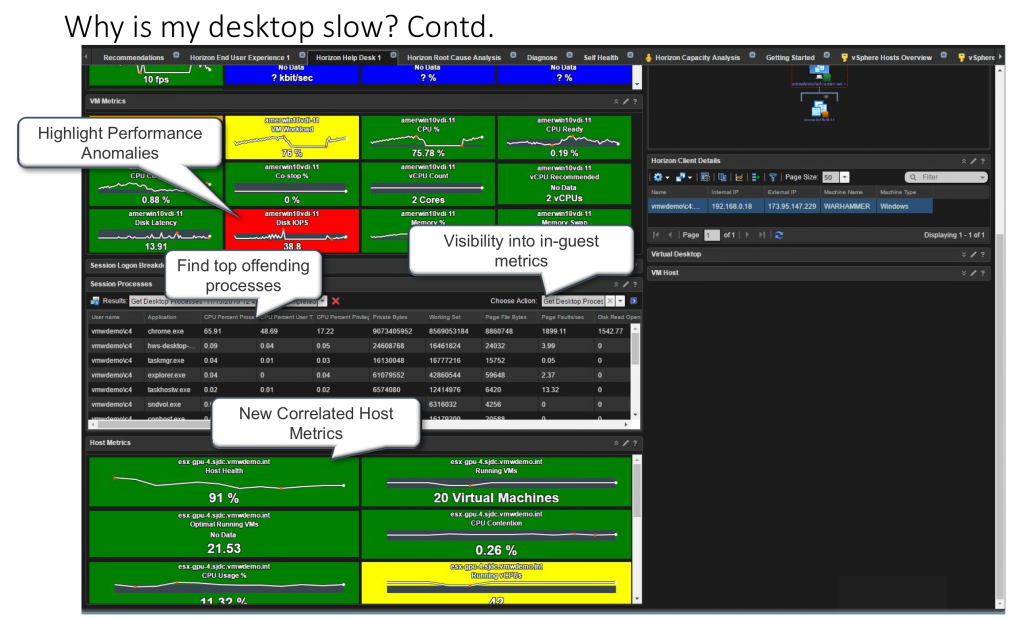
To reduce the number of clicks required for administration and add additional visibility to end-user environmental issues, a new Host Metrics scoreboard has also been added to the Help Desk dashboard. The scoreboard will show best practice metrics in green, and any metrics of concern or interest will change color (yellow, orange, red) depending on the latest reported value.
New Session Alert:
In addition to the new dashboard content, Blast and PCoIP session metrics have been added to a new single alert named “Session Protocol Performance Degraded”. This replaces the existing PCoIP Performance Degraded degraded alert. This will need to be imported under the Content -> Alerts menu.
New How To Widgets available on each dashboard:
Each dashboard now contains a “How to use…” widget that provides a brief description how to quickly operationalize the dashboards. The widgets leverage a URL link back to this website to display the latest instructions on how to use each dashboard. If the widget doesn’t display the text correctly, make sure that the URL referenced in the edit widget screen is resolvable.
**Note that most of this content will be available out-of-box in the vROPs for Horizon 6.4 release due Dec 2016. Additional custom content will only be available from this website.
Click to Download latest vROPs for Horizon Content 8.3 **download removed
Getting More out of VMware vRealize Operations for Horizon – training video
Getting More out of VMware vRealize Operations for Horizon training video:
In this training video you will learn how to quickly operationalize the vROPs for Horizon solution, and how it provides end-to-end visibility into issues plaguing your Horizon View users. Learn how to use the latest Help Desk dashboard to get instant insight into “Why their desktop is slow”.
vRealize Operations for Horizon 6.2 Deploy guide
The latest vRealize Operations for Horizon 6.2 Deployment guide is now available for download!
Click to download: vRealize Operations for Horizon 6.2 Deploy guide
June 2, 2016 – Charlotte VMUG: Charlotte Convention Center #CLTVMUG

June 2, 2016 – Charlotte VMUG: Charlotte Convention Center – Click to Register Now
I will be presenting Enabling Faster Application Delivery And Unified Management with VMware App Volumes.
June 22, 2016: Getting More Out of VMware: How to Operationalize vRealize Operations for Hori

June 22, 2016 – Getting More Out of VMware: How to Operationalize vRealize Operations for Horizon
Your’s truly will be giving a live demonstration of how to quickly operationalize the latest vROPs for Horizon solution.
- Get insight into end-user related performance issues.
- High level understanding of vROPs concepts (Health, Risk, Efficiency)
- Understand Pro-active Alerting to End User Experience issues
- How to leverage the End User Experience Dashboard for End-to-End visibility of performance concerns.
- How the Horizon Help Desk dashboard quickly identifies individual user session issues. Why is my desktop slow?
- Live Q&A